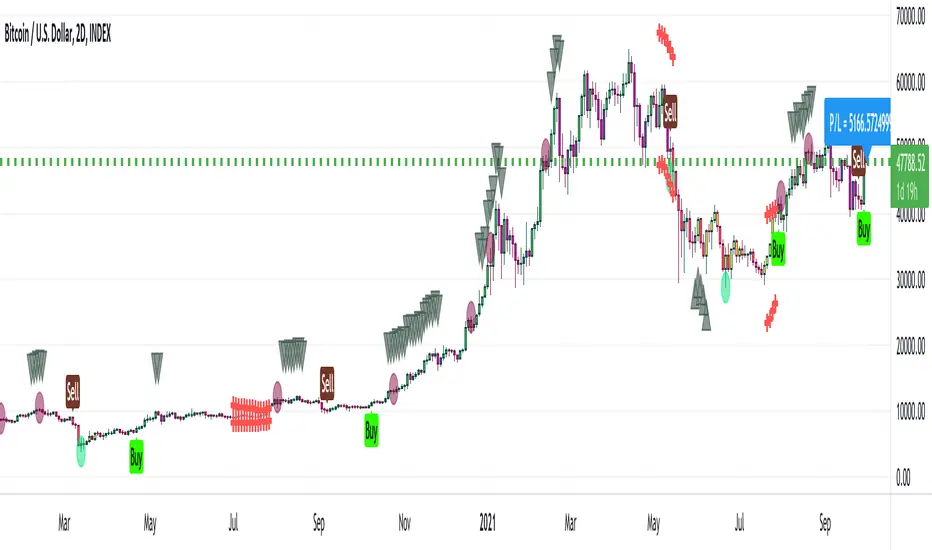
[Joy] Aladdin Long Trading Strategy 1.0.0 AlphaAladdin's Long trading strategy is to test out Aladdin for long trades only
This strategy is mainly used to test whether Aladdin is suitable for a coin/stocks/futures or for any trading. The profitability, average drawdown, average profits, etc are used by me to decide whether to use it for trading.
What is Aladdin and what does it do?
Using the volume and gradual flow of non-interrupted data (wicks and body of the candles), it tries to detect the macro condition of the market so that one may know in which direction the market is flowing.
* Bearish / Sell sign: On the candle's close, I open a short position
* Bullish sign: On the candle's close, I open a long position
* I take at least 50% profit when the indicator indicates to do so. One can configure that value as desired from the configuration depending on one's risk/money management. I might even convert some portion of the position into stable coins.
FAQ
Q: Does it use some EMA /MA/etc.? Does it use any indicator with tweaked settings?
Answer: No.
Q: What does it mostly depend on?
Answer: Volume and gradual flow of non-interrupted data. The logic depends purely on volume , price bars and the wicks.
Q: Does it work with all coins, stocks, futures, instruments?
Answer: I prefer to use the exchange with the best possible data. Then backtest out to find the best possible timeframe, stop loss and target all derived from this script data.
Q: Can you make it free or make it open source?
Answer: There is no free lunch in this world. I will never reveal or share the source code!
Q: Do you provide ongoing support for the indicator?
Answer: Yes, as long as I can, I will continue updating the indicator
Q: Are the bullish /buy & the bearish/sell markers automatic?
Answer: I have no control over the markers. It is driven purely by logic from the script.
Q: Is this financial advice?
Answer: This is not financial advice. I do not guarantee any profit or loss. I am not responsible for any of your losses or profits. My indicators do not assure profit or loss. It also does not auto-open or auto-close a trade.
Assumptions:
Only long trades are opened and closed. No short trades.
Starting Capital: $20,000
Order Size: 20% of Capital
Data used: Whatever data is available from 2011 till today on Trading view
Findings:
INDEX: BTCUSD 83% profitability using 2day tf
54 closed trades
Profit factor: 16
Sortino Ratio: 5.2
Average Winning Trade: 30%
Average Losing Trade: 9.12%
Largest Winning Trade: 1218%
Largest Losing Trade: 20.25%
Below are the profitability rate for the timeframe and the coins listed as found by running the trading strategy over the following as of today (Aug 1st 2021 12:40 pm Sydney Time).
⚜️ INDEX:BTCUSD 83% using 2day tf
⚜️INDEX:ETHUSD 80% using 1day tf
⚜️FTTUSD 81% using 2day tf
⚜️SRMUSD 71% using 1day tf
⚜️ADAUSDT 81% using 2day tf
⚜️ALGOUSD > 90% using 2day tf
⚜️ALTPERP 81% using 2day tf
⚜️AVAXUSDT 75% using 1day tf
⚜️BANDUSD > 90% using 2day tf
⚜️BCHUSD 82% using 2day tf
⚜️BNBUSD 79% using 1day tf
⚜️BNBUSD 85% using 2day tf
⚜️CHZUSD 71% using 1day tf
⚜️COMPUSD 81% using 1day tf
⚜️DOGEUSD 77% using 1day tf
⚜️EXCHPERP 83% using 1day tf
⚜️FILUSD > 90% using 1day tf
⚜️FTMUSD 70% using 2day tf
⚜️HTUSDT 75% using 2day tf
⚜️KINUSD >90% using 2day tf
⚜️LINKPERP 85% using 2day tf
⚜️LTCUSD 80% using 2day tf
⚜️MATICUSD 77% using 2day tf
⚜️NEOUSD 80% using 1day tf
⚜️NEXOUSD > 90% using 1day tf
⚜️OKBUSD 71% using 1day tf
⚜️OMGUSD 75% using 1day tf
⚜️RSRUSD 87% using 1day tf
⚜️RUNEUSD > 90% using 1day tf
⚜️SHITPERP > 90% using 1day tf
⚜️SOLUSD 84% using 1day tf
⚜️SUSHIUSD 71% using 1day tf
⚜️THETAUSD > 90% using 2day tf
⚜️UNIPERP 83% using 1day tf
⚜️VERTPERP > 90% using 1day tf
⚜️XAUUSD 63% using 2day tf
⚜️XTZUSD 83% using 2day tf
⚜️ZECUSD 72% using 2day tf
Disclaimer:
No one knows what will happen in the future. DYOR and decide on your own conditions. Do realize that neither I nor my indicator can guarantee any profit or loss. And there is no assurance that any trade will ever result in any profit. It is not financial advice.
Altcoins

[Joy] Aladdin (1.0.0 Alpha)Explanation of the markers in the indicator
* Bearish / Sell sign: On the candle's close, I open a short position
* Bullish sign: On the candle's close, I open a long position
* Red circle: On the candle's close, I take at least 50% unrealized profit into a realized profit of any running long leverage position. I might even convert some portion of the position into stable coins.
* Green circle: On the candle's close, I take at least 50% unrealized profit into a realized profit of any running short leverage position. I might even convert some portion of the position into stable coins.
* Down Arrows: When the down arrow finishes and the candle close, I put a tighter stop loss of any running long leverage position. It sometimes indicates the local top.
* Up Arrows: When the up arrow finishes and the candle close, I put a tighter stop loss of any running short leverage position. It sometimes indicates the local bottom.
* Purple candle: Weakly bullish.
* Green candle: Strongly bullish
* Red candle: Strongly bearish
* Yellow candle: Weakly bearish
FAQ
Q: Does it use some EMA /MA/etc.? Does it use any indicator with tweaked settings?
Answer: No.
Q: What does it mostly depend on?
Answer: Volume and gradual flow of non-interrupted data. The logic depends purely on volume, price bars and the wicks.
Q: Does it work with all coins, stocks, futures, instruments?
Answer: I prefer to use the exchange with the best possible data. Then backtest out to find the best possible timeframe, stop loss and target all derived from this script data.
Q: Can you make it free or make it open source?
Answer: There is no free lunch in this world. I will never reveal or share the source code!
Q: Do you provide ongoing support for the indicator?
Answer: Yes, as long as I can, I will continue updating the indicator
Q: Are the bullish /buy & the bearish /sell markers automatic?
Answer: I have no control over the markers. It is driven purely by logic from the script.
Q: Is this financial advice?
Answer: This is not financial advice. I do not guarantee any profit or loss. I am not responsible for any of your losses or profits. My indicators do not assure profit or loss. It also does not auto-open or auto-close a trade.
Note:
The Aladdin has been derived from the Super Algorithm Indicator. I have depreciated the Super Algorithm Indicator I have automatically migrated every user to Aladdin, who had Super Algorithm Indicator. One should not use the SA indicator. One should start using this indicator instead.
Version 1
A derived version of Super Algorithm Indicator with optimized code (uses arrays, removes few warnings in the code, makes code more reusable) so that I can add further features in the future. A few new coding features in the pine script encouraged me to go for this version. Since the codebase has been revamped, it made sense for me to make it a new indicator. have also changed a small parameter that is configurable at the moment. Previously it was valued at 26. Now I am putting value at 21.
Aggregated Volume Colored (Bitcoin, ETH, Altcoins, everything)BITSTAMP:BTCUSD
This indicator aggregates trading volume data of up to 10 symbols and can display the individual data by color.
It is useful for assets which are traded on multiple exchanges, like cryptocurrencies, commodities, forex and derivatives showing you what is happening across the market and on the individual exchanges to give you beter insights.
You can change the symbols from which the indicator gathers data in the settings under inputs, just like the colors, and you can add a moving average.
By default trading volume is aggregated from the following symbols:
Binance, BTC /USDT
Binance, BTC /BUSD
Bingbon, BTC /USD
Huobi, BTC /USDT
OkeX, BTC /USDT
Coinbase, BTC /USD
Bitfinex, BTC /USD
Gemini, BTC /USD
Kraken, XBT/USD
Bitstamp, BTC /USD

Binance Futures BasisCONCEPT
The futures basis for multiple coins based on the Binance coin margin quarterly futures contracts.
If you need a run down of what the futures basis is, check out this short educational post (click on the chart):
In short: the futures basis is the premium at which futures contracts are trading compared to the spot market.
FEATURES
Futures basis for the following coins:
BTC
ETH
LTC
BNB
ADA
DOT
BCH
LINK
There's also an average futures basis which is an average premium of all the coins I just listed.
As you can see there's also a zero line which you can turn on in the settings.
This is quite useful for when the futures start trading in or close to backwardation.
It's possible to show all the premiums at the same time.
This makes it easy to look for outliers.
You can choose the candle source too.
By default it's set on "close" which probably makes the most sense.
All data will be based on candle closes.
However if you're looking at higher timeframes sometimes crucial info is lost when you keep it on "close".
As you can see in this BTC futures basis example with "close" as a candle source you don't seen anything peculiar even though there were two violent liquidation cascades that temporarily had a huge impact on the futures basis.
If you then select "ohlc4" for example which uses an average value of each candle you can clearly see the impact that those drops had.
Basically when you're looking at most recent data I prefer candle close, but when looking at higher timeframes for historic data the ohlc4 option is more useful.
At the time of publishing this indicator it's using the September quarterly futures contracts (which is the closest expiration).
I'll update this every time the expiration happens.
However, in the settings you'll find the code for these futures contracts.
If you want to take a look at the next expiration for example, which is December right now, you can just fill in the Binance code of those contracts and it'll re-calculate everything and print the futures basis for the December futures.
This way you can also update the indicator yourself each time contracts expire (to make sure the indicator keeps working just in case I were to disappear or something).
The code for the current (September) contracts is U2021.
The code for the next expiration (December) is Z2021.
This will become out dated of course.
TRADING
You can find more info on how it's useful for trading in the educational post I linked.
Some short notes...
This premium works very similar to the perpetuals basis or funding.
Simply put a high premium could be a sign that the market is overbought and a very low premium could be a sign that the market is oversold.
Backwardation (below 0) is very rare and usually only happens after a violent crash. Historically those are good buying opportunities.
Divergences also often work really well.
If you want access send me a private message so we can discuss it.
Cheers.

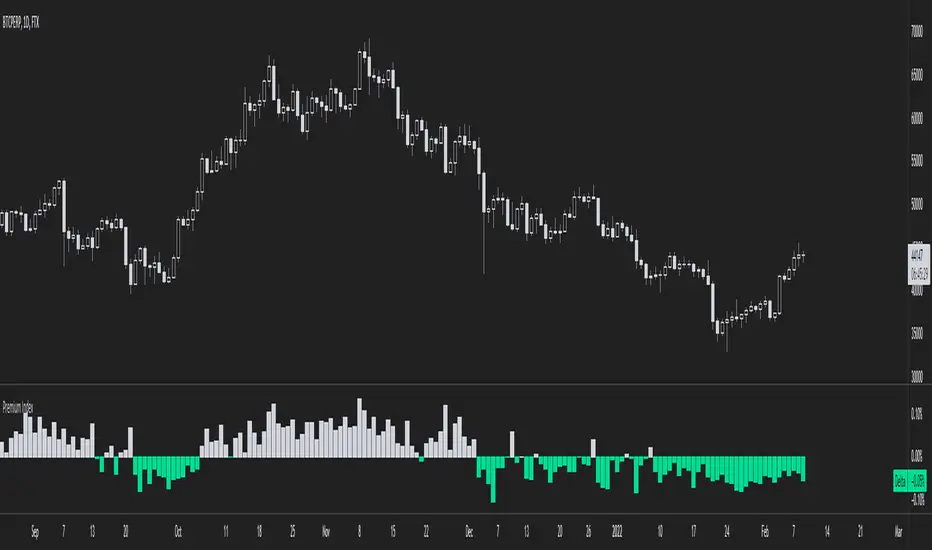
Binance Premium IndexCONCEPT
An indicator with official Binance premium index data for BTC and a bunch of altcoins.
The premium index is based on the difference in price between the perpetual swap contract last price and the price of a volume weighted spot index.
Simply put: it shows you for each coin whether the spot market is trading higher than the Binance perp or not.
FEATURES
Premium index for:
BTC
ETH
LTC
BNB
ADA
DOGE
DOT
UNI
SOL
LINK
There's also an average premium based on the premiums of all these coins combined.
You can also choose in the settings to display all the premiums at the same time.
This makes it easy to find outliers.
There are two extra features that need some explaining.
First of all: the clamp.
It doesn't happen often, but sometimes as a result of massive liquidation cascades there's temporarily a huge spot premium (or derivs premium, but usually spot premium).
In such a scenario the value of the premium dwarfs all other historical data and the indicator becomes nearly unreadable.
The clamp option allows you to put a cap on how extreme the values can get so that the indicator becomes easier to read again.
In the settings you can also change what you want the max value to be.
When you select the option that shows all premiums you'll definitely run into this problem as well.
But you can put a clamp on these too.
The second option is more straight forward: smoothing.
The premium can sometimes be a bit all over the place. It's possible to display the data as a smoothed moving average.
Here's an example of the raw data of the global average premium.
Now with smoothing. Looks a lot more clean.
TRADING
This premium index data is what the funding rate is based on.
Thus it has a direct impact on the perpetual swap contract.
If there's a spot premium (negative values in green) funding will be negative and shorts will have to pay longs.
If there's a derivatives premium (positive values in grey) funding will be positive and longs will have to pay shorts.
Simply put, a spot premium is usually bullish and a derivatives premium is usually bearish.
A lot of people look at this stuff when it comes to bitcoin, but for altcoins it's also definitely relevant.
So here's an indicator with the premium index for 10 different coins.
I don't use more than 10 coins because otherwise the indicator will become very slow.
If you want access to the indicator send me a private message so we can discuss it.
Cheers.
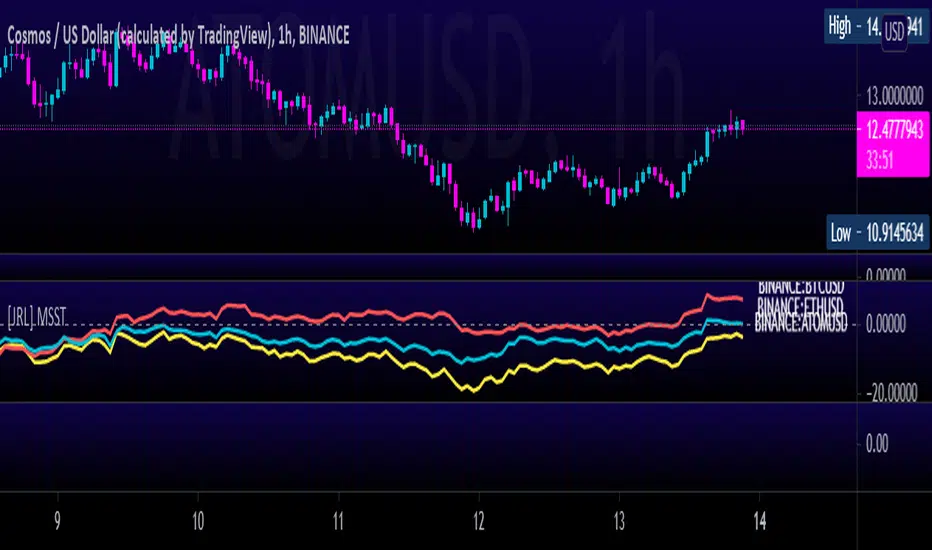
[JRL] Multi-Symbol Strength TrackerI created this script to compare cryptocurrencies that tend to be correlated, but it could also be used for forex or any other market. It is a fairly simple concept and compares price of each symbol to the specified period ema. This is helpful for tracking highly correlated symbols and visualizing moments when they are out of sync, perhaps signaling good times for buying or selling.
Alt RSI Cor [Auto] [Intromoto]This. script shows when the altcoin you're charting is above its own 50 level on the rsi, and its corresponding rsi 50 level on it's BTC and ETH pair.
Generally, while the rsi is above 50, price is more likely to increase, conversely when the rsi is below 50.
For example, if I'm on the BINANCE:NEARUSDTPERP chart, the bars will change green when the BINANACE:NEARUSDTPERP rsi is above 50, the BINANCE:NEARBTC rsi is above 50, and the BINANCE:NEARETH rsi is above 50.
This currently only works properly while on Binance USDTPERP charts, and newer pairs may not be included in the script yet. If you're on another chart the barcolors will default to BINANCE:BTCUSD.
Thanks

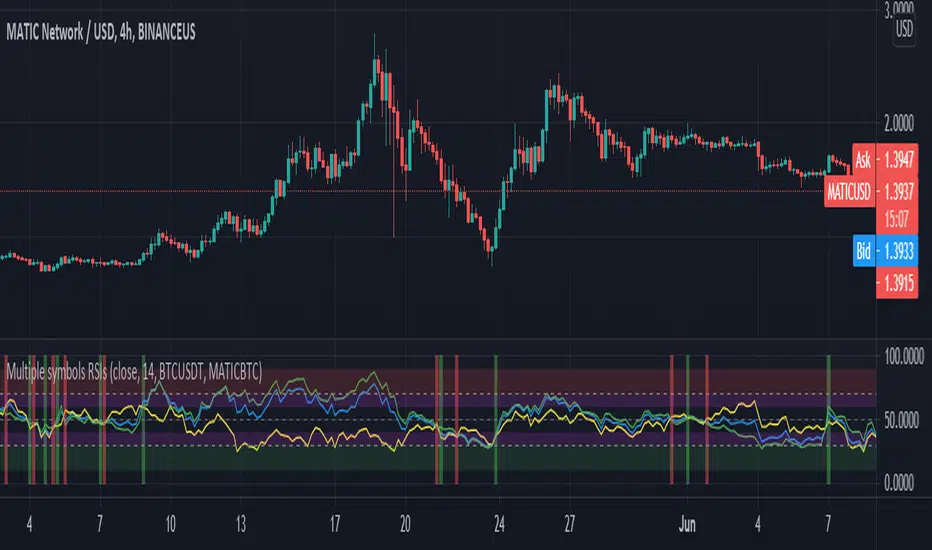
Crypto Tripple RSIGives an ability to compare 3 RSIs:
current altcoin + BTC (e.g. ADABTC) - green by default
current pair (e.g. ADAUSDT) - blue by default
BTC (e.g. BTCUSDT) - yellow by default
It helps to understand the cause of price change - whether BTC provokes price change or not. Also it shows performance of an altcoin - the bigger gaps between RSIs, the stronger (RSI of BTC is on the bottom)/ weaker (RSI of BTC is on the top) altcoin is.
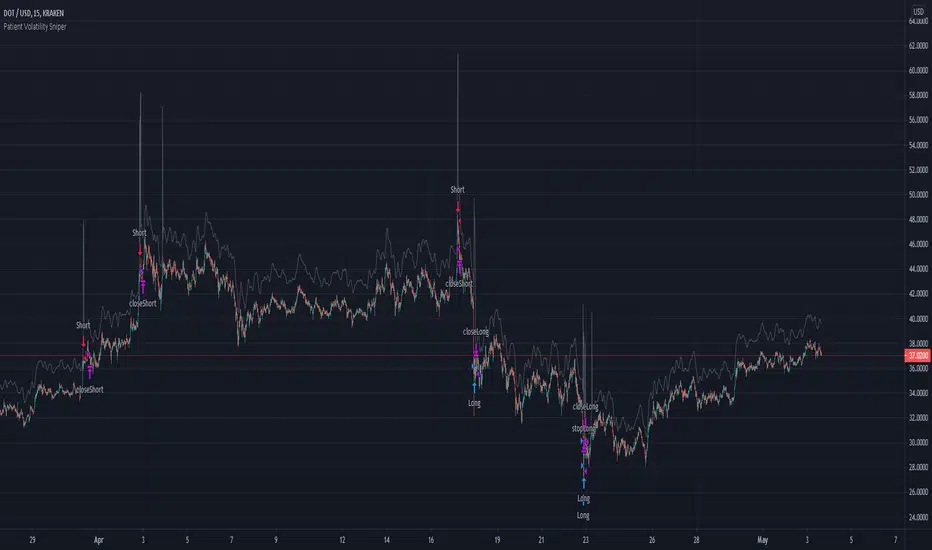
Patient Volatility SniperThis strategy waits for moments of high volatility where an asset is significantly overbought/oversold and makes very short trades.
When the indicator line spikes, it means the script sees a "window of opportunity." However, it will only enter a position if the underlying oscillators are overbought/oversold as determined by the threshold you set.
It does not produce a particularly gaudy net profit compared to many other strategies and can go weeks without making a trade. However, since the win/loss ratio tends to be consistently favorable (based on backtests: see below) it may be useful as a supplement to more "active" trading strategies.
I backtested it over the last year or so with a handful of different altcoins (specifically: ETH, ADA, DOT, XLM, VET, ZEC, and OMG), and it seems fairly robust. Please keep in mind that past results do not guarantee future success. Feel free to confirm the backtesting for yourself, especially as it may change in the future after this was written.
USAGE NOTE: If you have access to custom timeframes on tradingview, I strongly recommend using this strategy on charts in the range of 10m to 12m. In practice, there's not much of a difference, but I did optimize it for those slightly shorter timeframes. There are a handful of tickers for which it does not seem to work very well once you go up to 15m (notably, as of the time of publishing, DOGE).
Commission fee included because not doing so is unrealistic.
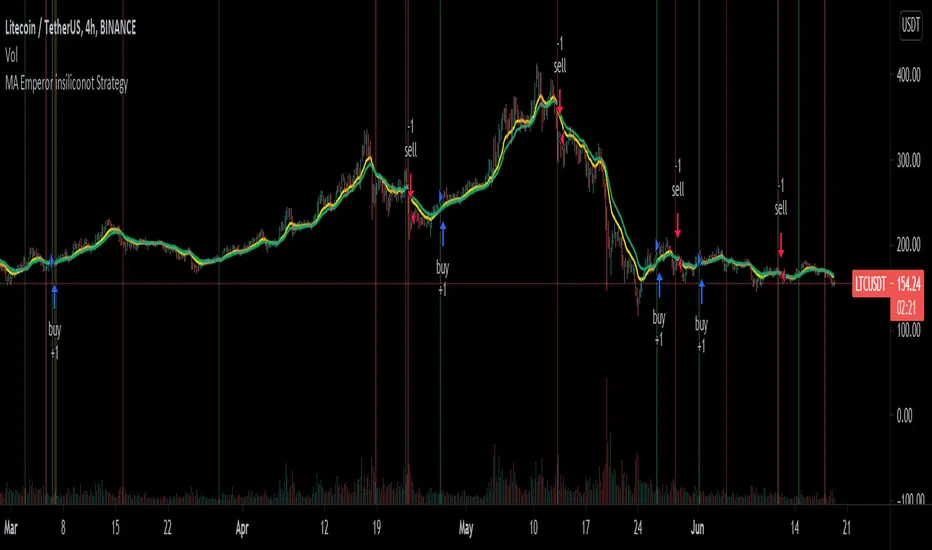
MA Emperor insiliconot StrategyConverted EmperorBTC's EMA crossover indicator for easy backtesting and added ability to:
Specify time period for backtesting
Specify order quantity
Toggle original indicators (default off)
Quoting EmperorBTC:
Entry is to be made when the
1. Cross over gives a P(Positive Sign) and the candle completely closes above the cross-over
2. When the Heikin Ashi turns green and the next green HA candle goes above the previous green HA candle.
3. The price should be at-least above the 0.236 Level from the Swing high.
Kindly note that the strategy only attempts to do check number 1, where it ensures the entry opens above the cross-over.
MA Strategy Emperor insiliconotThe Script offers 9 different EMAs with 14 different MA types.
The make use of the script is to find the entry on the 1-4 hour altcoins while using the in-built 13/21 crossover strategy to be used in sync with Heikin Ashi cross-over with Fib levels of 0.236 Fib level.
How to use it.
Entry is to be made when the
1. Cross over gives a P(Positive Sign) and the candle completely closes above the cross-over
2. When the Heikin Ashi turns green and the next green HA candle goes above the previous green HA candle.
3. The price should be at-least above the 0.236 Level from the Swing high.
All the Best.
EmperorBTC

4X EMA and volume strategyThis is a strategy made from multiple types of EMA and volume(EOM).
This is a long only strategy.
EMA 1 = 13
EMA 2 = 21
EMA 3 = 50
EMA 4 = 180
In this case we have 2 options for entry:
1.We check that are candles are in ascending order and EOM is above 0 - > long, descending and eom<0 -> exit long
2.We check if we have a crossover between the first ema with the second and the third. Cross up -> long, crossdown -> exit long
If you have any questions let me know!

BTC/usd BTC/usdt Volume & AltcoinsMarketcap dominance BithanosIndex introduction:
Function 1 of this indicator:Display the average trading volume of the 8 major BTC spot exchanges.
Bitcoin trading volume select BTC /USD
VOLBITSTAMP
VOLCOINBASE
VOLGEMINI
VOLKRAKEN
Bitcoin trading volume select BTC /USDT
VOLHUOBI
VOLBINANCE
VOLOKEX
VOLBITFINEX
Average trading volume = ( BTC /USD trading volume aggregation + BTC /USDT trading volume aggregation) / 8
This indicator function 2:Display BTC /USD trading volume as a percentage of total trading volume .
BTC /USD trading volume ratio = BTC /USD trading volume aggregation / ( BTC /USD trading volume aggregation + BTC /USDT trading volume aggregation)*100%
This indicator function 3:Displays the percentage of the market value of altcoins in the total market value of the cryptocurrency market.
Market value of altcoins = total market value of altcoins / total market value of cryptocurrencies * 100%
Glossary:
"MA length volume moving average period"
"Adopt Vol MA Enable Volume Moving Average"
"Vol average BTC combin shows the average trading volume of the 8 largest BTC spot exchanges"
"Adopt Btc /Usd Vol% Enable Btc /Usd Vol %"
"Adopt ALTS marketcap% enabled altcoin market cap"
"EmaBoll for Vol% / Marketcap% The Bollinger Bands based on Ema's mid-rail can be used for the volume ratio or the market value ratio"
本指标功能1:显示8大BTC现货交易所均摊成交量。
比特币成交量选取 BTC /USD
VOLBITSTAMP
VOLCOINBASE
VOLGEMINI
VOLKRAKEN
比特币成交量选取 BTC /USDT
VOLHUOBI
VOLBINANCE
VOLOKEX
VOLBITFINEX
均摊成交量 = (BTC/USD 成交量聚合 + BTC /USDT 成交量聚合)/ 8
本指标功能2:显示BTC/USD 成交量 占总成交量百分比。
BTC /USD 成交量占比 = BTC /USD 成交量聚合 / (BTC/USD 成交量聚合 + BTC /USDT 成交量聚合)*100%
本指标功能3:显示 山寨币市值 占据 加密货币市场总市值 百分比。
山寨币市值 占比 = 山寨币总市值 / 加密货币总市值 * 100%
名词解释:
" MA length 成交量均线周期"
"Adopt Vol MA 启用成交量均线"
"Vol average BTC combin 显示8大BTC现货交易所均摊成交量"
"Adopt Btc /Usd Vol % 启用Btc/Usd成交量占比"
"Adopt ALTS marketcap % 启用山寨币市值占比"
"EmaBoll for Vol% / Marketcap% 基于Ema中轨的布林带 可用于成交量占比 或 市值占比"

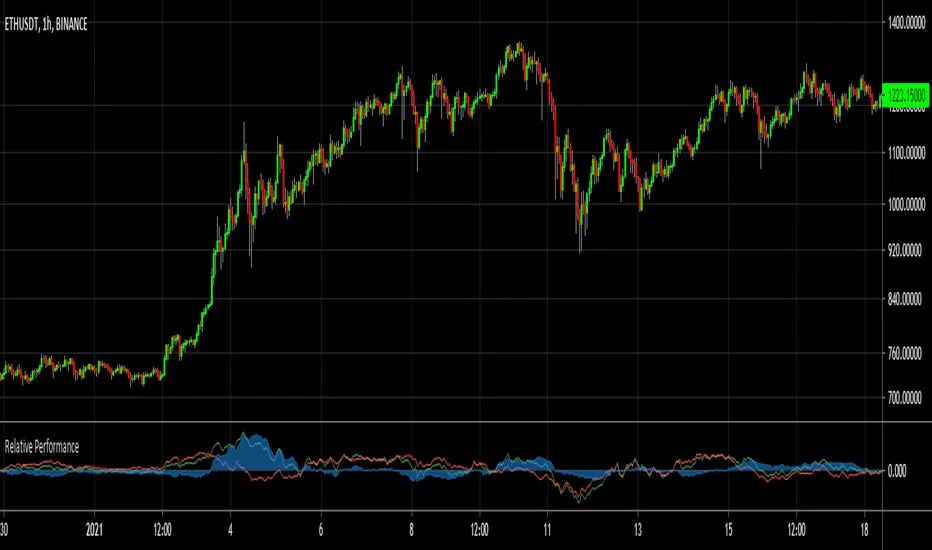
Relative Performance IndicatorEver since I started with trading, I was interested in the relative performance over a given period of a certain crypto against Bitcoin. This is particularly useful for finding potential winners in trending markets. In bullish markets you want to look for crypto’s that are underperforming against BTC, with the hope that at some point in the near future they will overtake BTC’s growth and see exponential returns.
This indicator should not be used on a timeframe lower than 1 hour, else the amount of noise could be distorting your trades. With the standard settings this indicator compares your currently selected asset and compares it against Bitcoin’s performance over a given period.
How to trade: I use this indicator to find crypto’s which could see strong returns in the near future because they are lagging behind (blue area < zero) BTC, and therefore have more ground to make up for. The first pic is a trade which I recently shared on Tradingview using this indicator. ALPHA's returns were weakening compared to Bitcoin’s and was therefore a decent buying opportunity. Also, this indicator is great to find potential tops (or bottoms). When the blue area starts peaking and reversing, it would be a good moment to exit your trade.
It’s not recommended to use this indicator “naked”. Use it to find potential undervalued (or overvalued) assets and adjust your trading plan accordingly.
Select the “Difference Switch” option if you’d want to attach an alert to the study. This alert will trigger once the indicator goes from negative to positive or the other way around.
Companion::InsurgentCompanion::Insurgent is a combined indicators strategy. Performances are pretty good on 1D, 4H and 1H timeframes and it can be used on Bitcoin and Altcoin markets.
Mainly, it is a trategy based on Ehlers formulas.
Used indicators:
- Ehlers Instantaneous Trend: trendline analysis;
- Ehlers Super Bandpass Filter: momentum detection;
- EMA: Long/Short time selector.
What the script does:
- determines trendlines combining mulitple indicators;
- automaticlally calculates Take profit and Stop Loss levels;
- permits automation generating Autoview signals (create an alert with {{strategy.order.alert_message}} in message text field to trap Autoview commands;
- supports for margin trading. Spot trading will be added in the future.
BACKTESTING
Backtest is not leveraged. Defaults are set as follow:
Capital: 10000
Percent of equity used for trades: 10%
Commission: 0.18% this is Bitfinex commission on orders
Change them accordingly on how you trade to get a more realistic backtest results.

Cryptos Relative Strength Oscillator
This is an oscillator made of biggest 40 cryptocurrency/USDT pairs.
* It shows relative strength and change of crypto market during certain time on given interval.
* The tool has a bunch of data put together into one oscillator:
* top and bottom lines are made of 3 strongest and 3 weakest crypto pairs (out of 40)
* has visible names of that pairs for several candles back (it cannot show more due to TV's Pine limitations)
* in settings you can set up 2 methods of calculations:
1) % change from SMA of price, default is SMA 5
2) % changes from x-candles back, to see that change from the last candle please turn of 'Moving Average' and set up 'Bars Back' to 1
* you can change source to close/hl2/ohlc2/etc
Notice 1:
- to have nicer visibility of whole oscillator make it bigger part of whole screen then you normally use for other oscillators
Notice 2:
- scroll your mouse to widen the horizontal axis, so names of certain crypto pairs will be more readable
Notice 3:
- script has 40 Pine security functions (to gather all the data from all pairs) so it can load up to several seconds
- also every change in settings will possibly result in longer loading time
ps. This script is invite-only for the members of our trading group (info in signature, group is free of charge).


Betelgeuse-Good entry/exit zoneHello everyone and welcome!
This is the my first indicator and also the first version of Betelgeuse script,I hope you will like it.
The indicator was designed to be used on cryptocurrencies
The idea is to be able to identify good entry and exit points in the market, traders often try to identify the minimum or maximum points and this is why Betelgeuse was born.
Betelgeuse should be combined with your analysis and other indicators to find good entry and exit zones and not a precise point.Obviously the more the indicator will be used
over long time frames the more accurate the signals will be.
You can decide to wait for a good signal from the RSI or from the MACD and add up
the Betelegeuse confirmation for a good entry or exit from the market.
The MA based indicator will give you an idea of the direction of the medium term trend.
Direct message me for acces.
JFRewards Indi Channel <Heikin> v4.0<>
SOP guidelines only given to JF members .
The ideas are:
1) Finding where to enter position of buying and sell.
2) Finding where is the realistic take profit target within 24 hours with maximum profits.
3) Finding Trailing STOP LOSS, Trailing Take Profit, Take Profit, STOP LOSS.
Fully tested with @Binance Exchanger with numerous of stablecoins and altcoins as well as BTC , ETH.
Performance cannot be shown due to non standard chart of Heikin Ashi.

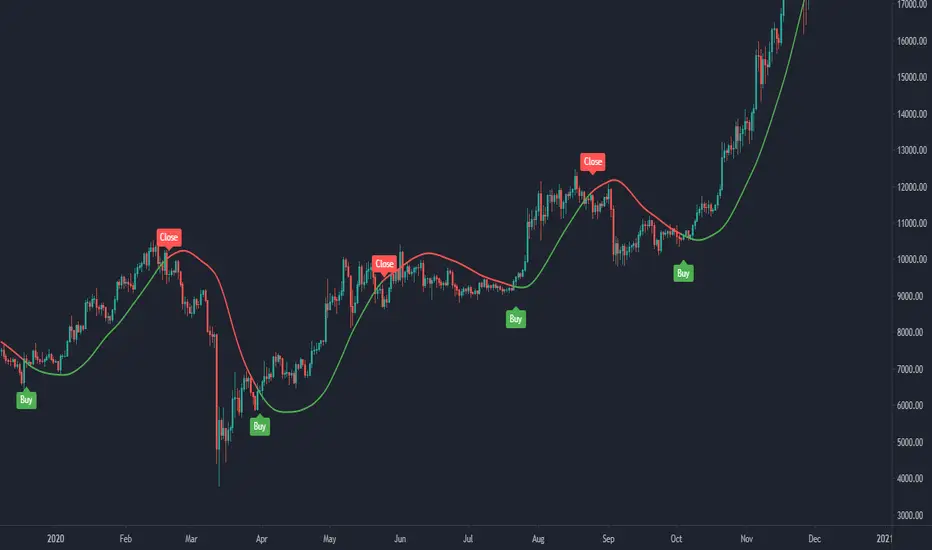
BTC and ETH Long strategy - version 2I wrote my first article in May 2020. See below
BTC and ETH Long strategy - version1
After 6 months, it is now time to check the result of my script for the last 6 months.
XBTUSD (4H): 14/05/2020 --> 22/11/2020 = +78% in 4 trades
ETHXBT (4H): 14/05/2020 --> 22/11/2020 = +21% in 9 trades
ETHUSD (4H): 14/05/2020 --> 22/11/2020 = +90% in 6 trades
Using the signals from this strategy to trade manually has shown that this was a bit frustrating because of the low rate of winning trades.
If you have to enter 100 trades and see 75% of them failing and 25% winning, this is frustrating. For sure the strategy makes good money but it is difficult to hold this mentality.
So, I have reviewed and modified it to get a higher winning rate.
After few days of work, tests and validation, I managed to get a wining rate close to 60%.
The key element was also to decrease the number of trades by using a higher time frame. (4H candles instead of 2H candles).
- Entry in position is based on
MACD, EMA (20), SMA (100), SMA (200) moving up
AND EMA (20) > SMA (100)
AND SMA (100) > SMA (200)
- Exit the position if: Stoploss is reached OR EMA (20) crossUnder SMA (100)
The goal of this new script is to be able to follow the signals manually and only make few trades per years.
I have also validated it against some other altcoins where some are giving very good results.
Here are some results for 2020 (from 01/01/2020 until now (22/11/2020). Those results are the one I get when using 4H candles.
ETH/USD: +144% in 8 trades.
BTC/USD: +120% in 7 trades.
ETH/BTC: +33% in 9 trades.
ICX/USD: +123% in 10 trades.
LINK/USD: +155% in 11 trades.
MLN/USD: +388% in 8 trades.
ADA/USD: +180% in 7 trades.
LINK/BTC: +97% in 10 trades.
The best is that above results are without considering compound effect. If you re-invest all gains done in each new trade, this will give you the below results :)
ETH/USD: +189% in 8 trades.
BTC/USD: +260% in 7 trades.
ETH/BTC: +29% in 9 trades.
ICX/USD: +112% in 10 trades.
LINK/USD: +222% in 11 trades.
MLN/USD: +793% in 8 trades.
ADA/USD: +319% in 7 trades.
LINK/BTC: +103% in 10 trades.
As you can see, the results are good and the number of trades for 11 months is not big, which allows the trader to place orders manually.
But still, I'm lazy :), so, I have also coded this strategy in HaasScript language which allows you to automate this strategy using the HaasOnline software specialized in automated crypto trading.
I hope that this strategy will give you ideas or will be the starting point for your own strategy.
Let me know if you need more details.

TBT ForecasterThe TBT Forecaster is a visual representation of the "weather forecast" for the crypto market, mainly Bitcoin and ALT coins.
Purpose:
The reason behind creating this indicator is to help give crypto traders a sense of what to expect in crypto currency markets. In general, crypto markets (ALT coins) are extremely dependent on the price action and sentiment of Bitcoin. By knowing what to expect for both BTC and ALT markets, crypto traders will have an edge on other traders by:
knowing when it's a good time to run BTC or stable coin pairs for bots on 3Commas
knowing when the ALT market is in a Bullish or Bearish mood
knowing if we're in a true ALT season or not
knowing if they should be focusing more on active trading on the BTC or stable coin market
Time Frame:
The TBT Forecaster can be viewed on any time frame, but it was originally designed to work off of the 6-hour time frame. Note that faster (higher) time frames can make the tool somewhat unreliable since faster (higher) time frames are subject to more sudden, volatile movements compared to the 6-hour or Daily time frames. To help users of the TBT Forecaster keep a healthy perspective, the indicator can be set to "same as symbol" (the indicator will adapt to any time frame you use) or "6 hours" (the original and intended time frame).
Metrics:
The two lines of the indicator represent Bitcoin (top) and ALT coins (below). The TBO Forecaster uses information derived from the price of Bitcoin, Bitcoin price volatility, moving averages, ATR (Average True Range), Bitcoin Dominance, and the ALT coin indexes (TOTAL2 and OTHERS). All of these metrics are combined and weighted into a system that quantifies the market sentiment for BTC and ALTs.
Sentiment:
The TBT Forecaster shows a gradient of market sentiment, from Bearish to Bullish. These market sentiment labels consist of a variety of different metrics that have to do with volume, price action, and several indices. The full gradient of sentiment is:
Bearish
Weak Bearish (ALT line only)
Neutral
Weak Bullish
Bullish
Realistic Expectations:
Note that it is impossible and unrealistic for the ALTs line to represent every single ALT coin/token/chart/symbol on every exchange. In my experience, there are always good charts to trade no matter what Bitcoin is doing. However, if we as traders know that ALTs are Bearish, then we can focus our efforts on trading Bitcoin (or just staying out of the ALT market until conditions change).
Use the link below to obtain access to this indicator

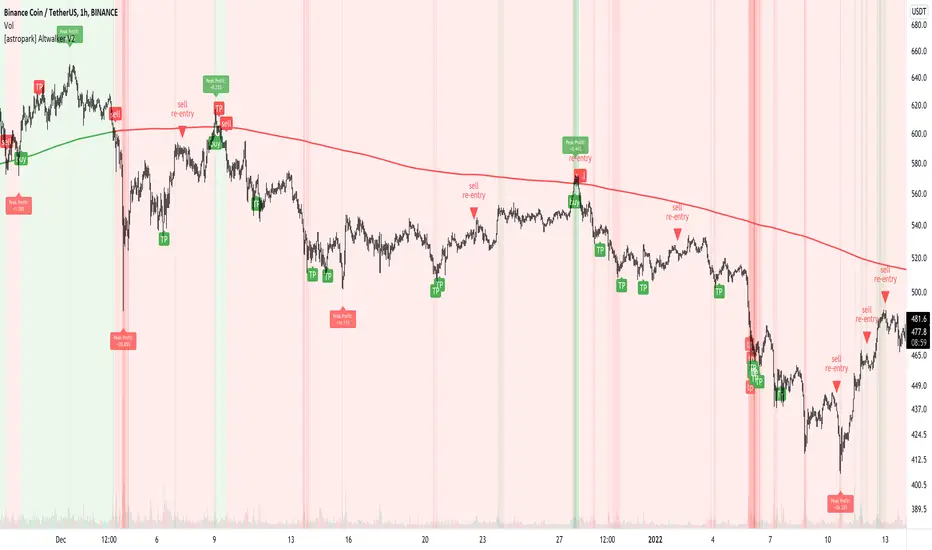
[astropark] Altwalker V2Dear Followers,
today I'm happy to share with you Altwalker V2 , an updated version of the former Altwalker for lower timeframes (from 5 minutes to 4 hours).
It is both a Swing and Scalping Strategy indicator , based on a simple trend following theory , mainly designed for Cryptocurrencies, Altcoins and of course Bitcoin.
Here you can see the Altwalker V1:
Based on Moving Average, Altwalker V2 on low timeframes dynamically identifies market resistance and support, so in which trend a cryptocurrency is during time:
green trendline and background means bullish trend , in fact it start with a "buy" signal
red trendline and background means bearish trend , in fact it start with a "sell" signal
if a series of buy and sell appears (this may happen especially in lower timeframes), this means price is in consolidation or distribution phase, so be prepared for a new trending phase coming soon, always remembering that taking profits is awesome and managing your risk by defining you position size and having a stoploss is a must in trading
To help in Taking Profits, Altwalker integrates also 2 special tools besides the trend highlighter:
Overbought and Oversold RSI Signals , which appear both as darker background (the darker the color, the more the price is in overbought/oversold) and green "ob"-"tp" / red "os"-"tp" labels (they optionally pop up only on a configurable stronger overbought/oversold condition) (you can enable/disable it optionally)
Peak Profit Tracker , which resets every time a new trade start and keeps track of price fluctuation during the trade: the message is don't be too much greedy and take profits or lock them with a stoploss in profit (you can enable/disable it optionally)
You can edit many options in order to
enable/disable showing buy/sell signals
enable/disable showing trendline
edit trendline variant (you have 2 options, by default variant 1 is selected)
enable/disable showing trend as background
enable/disable showing RSI TP signals
edit RSI length, overbought (OB) and oversold (OS) levels
enable/disable showing peak profits on each trade
The user who wants to use this strategy, especially via an automated bot, must always set a stoploss (example 150$ from entry on bitcoin ) or use a proper risk management strategy .
This is not the "Holy Grail", so use it with caution. It's highly suggested to use a proper money management .
This script will let you set all notifications you may need in order to be alerted on each triggered signals.
Here there are some examples how Altwalker V2 works on many timeframes and markets:
LINK/USDT 1h
XLM/BTC 1h
ETH/BTC 1h
ETH/USDT 1h
COMP/USDT 1h
YFI/USDT 15m
NEO/BTC 5m
VET/USDT 15m
This is a premium indicator , so send me a private message in order to get access to this script .
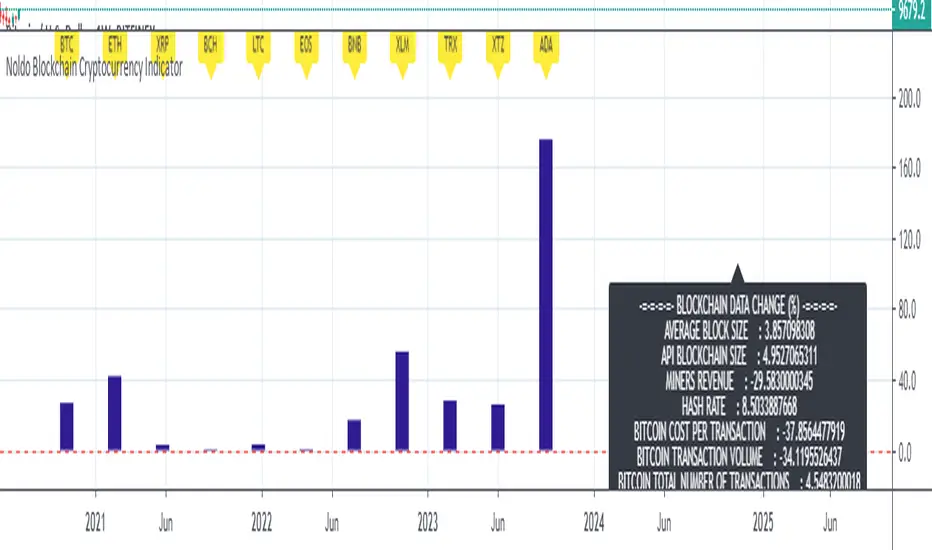
Noldo Blockchain Cryptocurrency Indicator
Hello, this script has the same logic as Noldo CFTC COT Forex Indicator :
And Noldo CFTC COT Commodities Indicator :
*
Script briefly calculates the period length between two signals of Pivot Reversal Strategy when new signal arrives and allows us to see relative Blockchain data and price changes of Major Cryptocurrencies over that automatic length.
This saves us from the hassle and time wasting of searching for a reference point.
Usage
This script works only on all Bitcoin / U.S Dollar pairs and futures.
It only works on 1W graphics.
ICOT data are pulled via Quandl
NOTE :
Since blockchain data is very votalile, 7-day ema values are adjusted to take into account.
Regards.