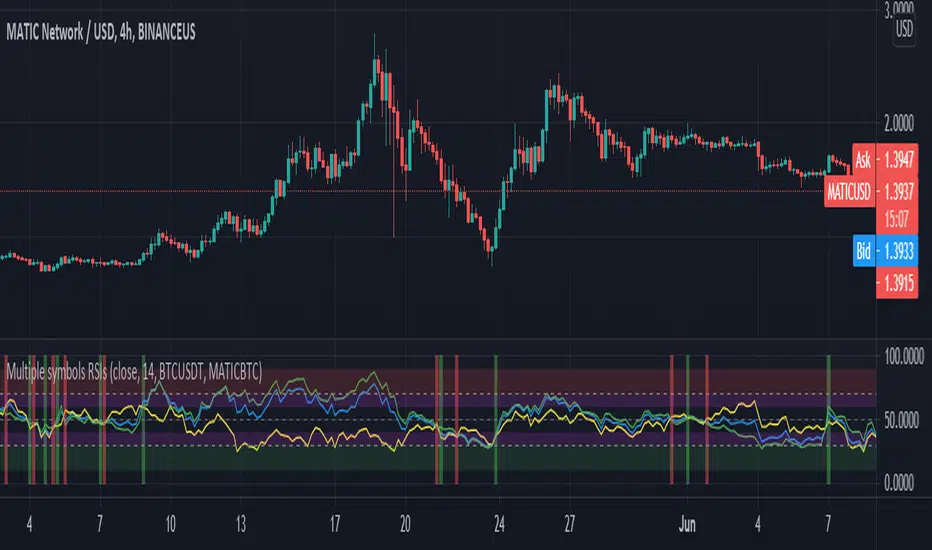
Crypto Tripple RSIGives an ability to compare 3 RSIs:
current altcoin + BTC (e.g. ADABTC) - green by default
current pair (e.g. ADAUSDT) - blue by default
BTC (e.g. BTCUSDT) - yellow by default
It helps to understand the cause of price change - whether BTC provokes price change or not. Also it shows performance of an altcoin - the bigger gaps between RSIs, the stronger (RSI of BTC is on the bottom)/ weaker (RSI of BTC is on the top) altcoin is.
Altcoins
MA Strategy Emperor insiliconotThe Script offers 9 different EMAs with 14 different MA types.
The make use of the script is to find the entry on the 1-4 hour altcoins while using the in-built 13/21 crossover strategy to be used in sync with Heikin Ashi cross-over with Fib levels of 0.236 Fib level.
How to use it.
Entry is to be made when the
1. Cross over gives a P(Positive Sign) and the candle completely closes above the cross-over
2. When the Heikin Ashi turns green and the next green HA candle goes above the previous green HA candle.
3. The price should be at-least above the 0.236 Level from the Swing high.
All the Best.
EmperorBTC

BTC/usd BTC/usdt Volume & AltcoinsMarketcap dominance BithanosIndex introduction:
Function 1 of this indicator:Display the average trading volume of the 8 major BTC spot exchanges.
Bitcoin trading volume select BTC /USD
VOLBITSTAMP
VOLCOINBASE
VOLGEMINI
VOLKRAKEN
Bitcoin trading volume select BTC /USDT
VOLHUOBI
VOLBINANCE
VOLOKEX
VOLBITFINEX
Average trading volume = ( BTC /USD trading volume aggregation + BTC /USDT trading volume aggregation) / 8
This indicator function 2:Display BTC /USD trading volume as a percentage of total trading volume .
BTC /USD trading volume ratio = BTC /USD trading volume aggregation / ( BTC /USD trading volume aggregation + BTC /USDT trading volume aggregation)*100%
This indicator function 3:Displays the percentage of the market value of altcoins in the total market value of the cryptocurrency market.
Market value of altcoins = total market value of altcoins / total market value of cryptocurrencies * 100%
Glossary:
"MA length volume moving average period"
"Adopt Vol MA Enable Volume Moving Average"
"Vol average BTC combin shows the average trading volume of the 8 largest BTC spot exchanges"
"Adopt Btc /Usd Vol% Enable Btc /Usd Vol %"
"Adopt ALTS marketcap% enabled altcoin market cap"
"EmaBoll for Vol% / Marketcap% The Bollinger Bands based on Ema's mid-rail can be used for the volume ratio or the market value ratio"
本指标功能1:显示8大BTC现货交易所均摊成交量。
比特币成交量选取 BTC /USD
VOLBITSTAMP
VOLCOINBASE
VOLGEMINI
VOLKRAKEN
比特币成交量选取 BTC /USDT
VOLHUOBI
VOLBINANCE
VOLOKEX
VOLBITFINEX
均摊成交量 = (BTC/USD 成交量聚合 + BTC /USDT 成交量聚合)/ 8
本指标功能2:显示BTC/USD 成交量 占总成交量百分比。
BTC /USD 成交量占比 = BTC /USD 成交量聚合 / (BTC/USD 成交量聚合 + BTC /USDT 成交量聚合)*100%
本指标功能3:显示 山寨币市值 占据 加密货币市场总市值 百分比。
山寨币市值 占比 = 山寨币总市值 / 加密货币总市值 * 100%
名词解释:
" MA length 成交量均线周期"
"Adopt Vol MA 启用成交量均线"
"Vol average BTC combin 显示8大BTC现货交易所均摊成交量"
"Adopt Btc /Usd Vol % 启用Btc/Usd成交量占比"
"Adopt ALTS marketcap % 启用山寨币市值占比"
"EmaBoll for Vol% / Marketcap% 基于Ema中轨的布林带 可用于成交量占比 或 市值占比"

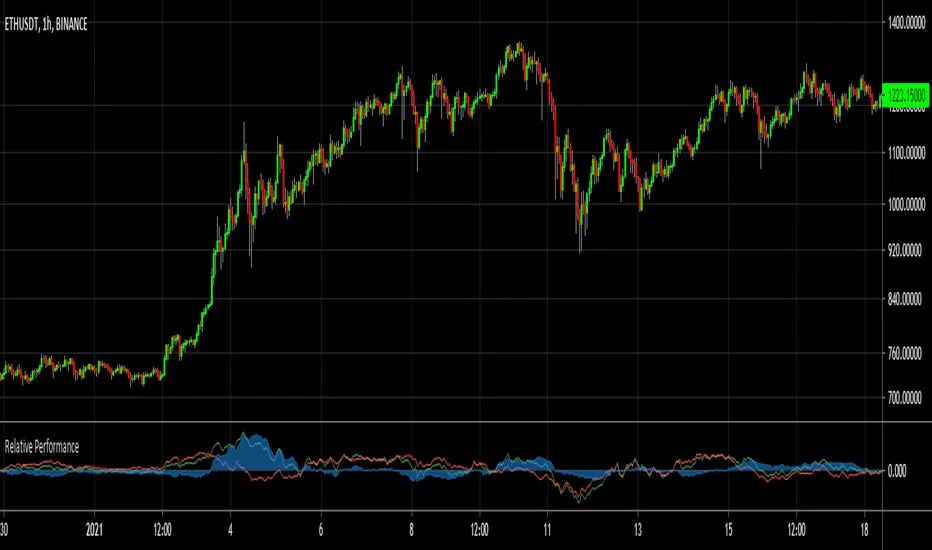
Relative Performance IndicatorEver since I started with trading, I was interested in the relative performance over a given period of a certain crypto against Bitcoin. This is particularly useful for finding potential winners in trending markets. In bullish markets you want to look for crypto’s that are underperforming against BTC, with the hope that at some point in the near future they will overtake BTC’s growth and see exponential returns.
This indicator should not be used on a timeframe lower than 1 hour, else the amount of noise could be distorting your trades. With the standard settings this indicator compares your currently selected asset and compares it against Bitcoin’s performance over a given period.
How to trade: I use this indicator to find crypto’s which could see strong returns in the near future because they are lagging behind (blue area < zero) BTC, and therefore have more ground to make up for. The first pic is a trade which I recently shared on Tradingview using this indicator. ALPHA's returns were weakening compared to Bitcoin’s and was therefore a decent buying opportunity. Also, this indicator is great to find potential tops (or bottoms). When the blue area starts peaking and reversing, it would be a good moment to exit your trade.
It’s not recommended to use this indicator “naked”. Use it to find potential undervalued (or overvalued) assets and adjust your trading plan accordingly.
Select the “Difference Switch” option if you’d want to attach an alert to the study. This alert will trigger once the indicator goes from negative to positive or the other way around.
Cryptos Relative Strength Oscillator
This is an oscillator made of biggest 40 cryptocurrency/USDT pairs.
* It shows relative strength and change of crypto market during certain time on given interval.
* The tool has a bunch of data put together into one oscillator:
* top and bottom lines are made of 3 strongest and 3 weakest crypto pairs (out of 40)
* has visible names of that pairs for several candles back (it cannot show more due to TV's Pine limitations)
* in settings you can set up 2 methods of calculations:
1) % change from SMA of price, default is SMA 5
2) % changes from x-candles back, to see that change from the last candle please turn of 'Moving Average' and set up 'Bars Back' to 1
* you can change source to close/hl2/ohlc2/etc
Notice 1:
- to have nicer visibility of whole oscillator make it bigger part of whole screen then you normally use for other oscillators
Notice 2:
- scroll your mouse to widen the horizontal axis, so names of certain crypto pairs will be more readable
Notice 3:
- script has 40 Pine security functions (to gather all the data from all pairs) so it can load up to several seconds
- also every change in settings will possibly result in longer loading time
ps. This script is invite-only for the members of our trading group (info in signature, group is free of charge).


Betelgeuse-Good entry/exit zoneHello everyone and welcome!
This is the my first indicator and also the first version of Betelgeuse script,I hope you will like it.
The indicator was designed to be used on cryptocurrencies
The idea is to be able to identify good entry and exit points in the market, traders often try to identify the minimum or maximum points and this is why Betelgeuse was born.
Betelgeuse should be combined with your analysis and other indicators to find good entry and exit zones and not a precise point.Obviously the more the indicator will be used
over long time frames the more accurate the signals will be.
You can decide to wait for a good signal from the RSI or from the MACD and add up
the Betelegeuse confirmation for a good entry or exit from the market.
The MA based indicator will give you an idea of the direction of the medium term trend.
Direct message me for acces.
TBT ForecasterThe TBT Forecaster is a visual representation of the "weather forecast" for the crypto market, mainly Bitcoin and ALT coins.
Purpose:
The reason behind creating this indicator is to help give crypto traders a sense of what to expect in crypto currency markets. In general, crypto markets (ALT coins) are extremely dependent on the price action and sentiment of Bitcoin. By knowing what to expect for both BTC and ALT markets, crypto traders will have an edge on other traders by:
knowing when it's a good time to run BTC or stable coin pairs for bots on 3Commas
knowing when the ALT market is in a Bullish or Bearish mood
knowing if we're in a true ALT season or not
knowing if they should be focusing more on active trading on the BTC or stable coin market
Time Frame:
The TBT Forecaster can be viewed on any time frame, but it was originally designed to work off of the 6-hour time frame. Note that faster (higher) time frames can make the tool somewhat unreliable since faster (higher) time frames are subject to more sudden, volatile movements compared to the 6-hour or Daily time frames. To help users of the TBT Forecaster keep a healthy perspective, the indicator can be set to "same as symbol" (the indicator will adapt to any time frame you use) or "6 hours" (the original and intended time frame).
Metrics:
The two lines of the indicator represent Bitcoin (top) and ALT coins (below). The TBO Forecaster uses information derived from the price of Bitcoin, Bitcoin price volatility, moving averages, ATR (Average True Range), Bitcoin Dominance, and the ALT coin indexes (TOTAL2 and OTHERS). All of these metrics are combined and weighted into a system that quantifies the market sentiment for BTC and ALTs.
Sentiment:
The TBT Forecaster shows a gradient of market sentiment, from Bearish to Bullish. These market sentiment labels consist of a variety of different metrics that have to do with volume, price action, and several indices. The full gradient of sentiment is:
Bearish
Weak Bearish (ALT line only)
Neutral
Weak Bullish
Bullish
Realistic Expectations:
Note that it is impossible and unrealistic for the ALTs line to represent every single ALT coin/token/chart/symbol on every exchange. In my experience, there are always good charts to trade no matter what Bitcoin is doing. However, if we as traders know that ALTs are Bearish, then we can focus our efforts on trading Bitcoin (or just staying out of the ALT market until conditions change).
Use the link below to obtain access to this indicator

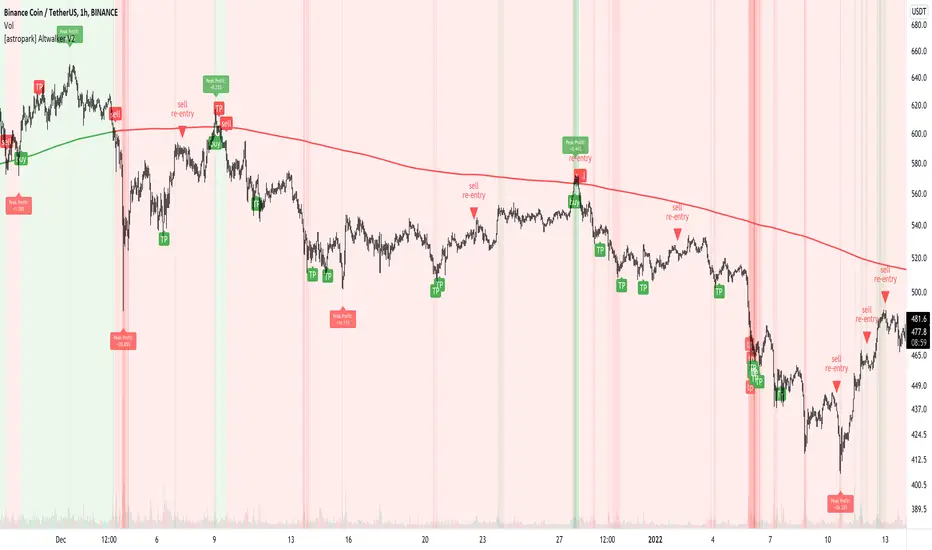
[astropark] Altwalker V2Dear Followers,
today I'm happy to share with you Altwalker V2 , an updated version of the former Altwalker for lower timeframes (from 5 minutes to 4 hours).
It is both a Swing and Scalping Strategy indicator , based on a simple trend following theory , mainly designed for Cryptocurrencies, Altcoins and of course Bitcoin.
Here you can see the Altwalker V1:
Based on Moving Average, Altwalker V2 on low timeframes dynamically identifies market resistance and support, so in which trend a cryptocurrency is during time:
green trendline and background means bullish trend , in fact it start with a "buy" signal
red trendline and background means bearish trend , in fact it start with a "sell" signal
if a series of buy and sell appears (this may happen especially in lower timeframes), this means price is in consolidation or distribution phase, so be prepared for a new trending phase coming soon, always remembering that taking profits is awesome and managing your risk by defining you position size and having a stoploss is a must in trading
To help in Taking Profits, Altwalker integrates also 2 special tools besides the trend highlighter:
Overbought and Oversold RSI Signals , which appear both as darker background (the darker the color, the more the price is in overbought/oversold) and green "ob"-"tp" / red "os"-"tp" labels (they optionally pop up only on a configurable stronger overbought/oversold condition) (you can enable/disable it optionally)
Peak Profit Tracker , which resets every time a new trade start and keeps track of price fluctuation during the trade: the message is don't be too much greedy and take profits or lock them with a stoploss in profit (you can enable/disable it optionally)
You can edit many options in order to
enable/disable showing buy/sell signals
enable/disable showing trendline
edit trendline variant (you have 2 options, by default variant 1 is selected)
enable/disable showing trend as background
enable/disable showing RSI TP signals
edit RSI length, overbought (OB) and oversold (OS) levels
enable/disable showing peak profits on each trade
The user who wants to use this strategy, especially via an automated bot, must always set a stoploss (example 150$ from entry on bitcoin ) or use a proper risk management strategy .
This is not the "Holy Grail", so use it with caution. It's highly suggested to use a proper money management .
This script will let you set all notifications you may need in order to be alerted on each triggered signals.
Here there are some examples how Altwalker V2 works on many timeframes and markets:
LINK/USDT 1h
XLM/BTC 1h
ETH/BTC 1h
ETH/USDT 1h
COMP/USDT 1h
YFI/USDT 15m
NEO/BTC 5m
VET/USDT 15m
This is a premium indicator , so send me a private message in order to get access to this script .
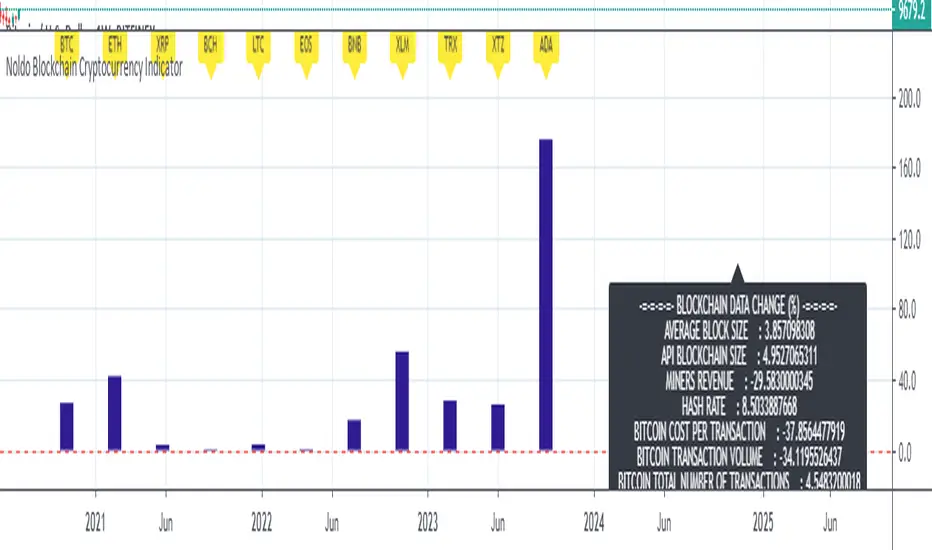
Noldo Blockchain Cryptocurrency Indicator
Hello, this script has the same logic as Noldo CFTC COT Forex Indicator :
And Noldo CFTC COT Commodities Indicator :
*
Script briefly calculates the period length between two signals of Pivot Reversal Strategy when new signal arrives and allows us to see relative Blockchain data and price changes of Major Cryptocurrencies over that automatic length.
This saves us from the hassle and time wasting of searching for a reference point.
Usage
This script works only on all Bitcoin / U.S Dollar pairs and futures.
It only works on 1W graphics.
ICOT data are pulled via Quandl
NOTE :
Since blockchain data is very votalile, 7-day ema values are adjusted to take into account.
Regards.
AMA 2Hi
Here is the 2ed edition of the AMA indicator.
what you would know to know?
AMA indicator based on support and resistance in a different way.
Basically, you have the X line (black color) and when you see candles is over it, then you can go long, and when it's below it you may go short or just close your deal and wait for a better chance to re-enter again.
You see the confirmation signs which helps you to get more signals for the deal.
You find a colored background that is based on the volume that could help you to know where if the traders are buying or selling.
AMA is configured to work with Alerts.
We've added EMA and our special moving average to help you in your decision.
Finally, the indicator is tested and works fine with Binance on 1H, 4H, D and you could change the length to have better results for the daily time frame.

Horus Spreadmaster
Hello Traders,
Horus Spreadmaster is an oscillator based on the spread of two tickers and may indicate oversold / overbought conditions compared to one or the other . You can also setup an other time frame.
How it works?
- Setup the tickers
- Check the invert box if you have the correct ticker order
- Setup any time frame you want
- Display Stochastic
- Display StochRSI
If its indicated overbought, this does not mean it can't go higher. Same the other way around.
Use other indicators and PA for more confluence.
Wuuzzaa
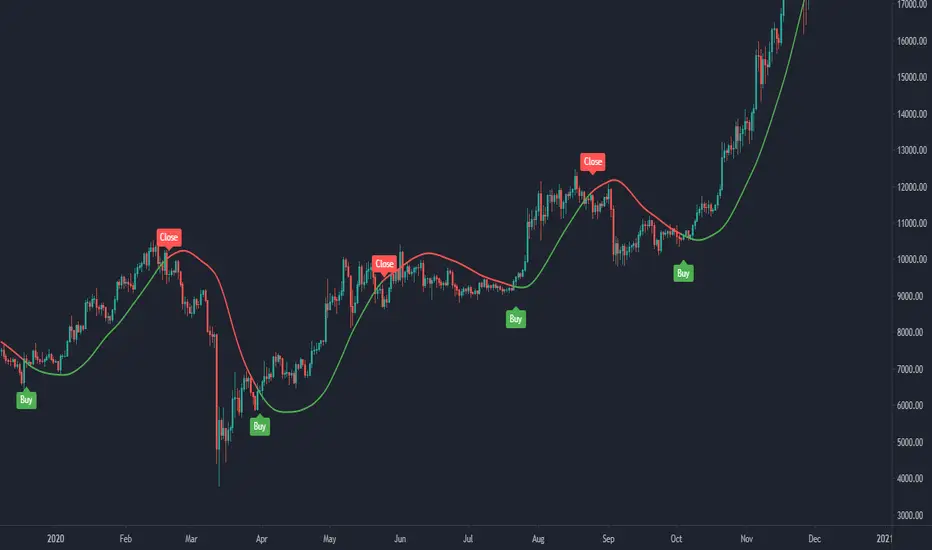
[astropark] AltwalkerDear Followers,
since today you can enjoy Altwalker , a new Swing and Scalping Strategy based on a simple trend following theory , mainly designed for Cryptocurrencies, Altcoins and of course Bitcoin.
It works also on all timeframes, but it's suggested to use it on higher ones: 1D - 12h - 6h - 4h , not suggested to use it below 1h-30m.
Based on Moving Average, Altwalker dynamically identifies market resistance and support, so in which trend a cryptocurrency is during time:
green trendline and background means bullish trend , in fact it start with a "buy" signal
red trendline and background means bearish trend , in fact it start with a "sell" signal
if a series of buy and sell appears (this may happen especially in lower timeframes), this mean price is in consolidation or distribution phase, so be prepared for a new trending phase coming soon, always remembering that taking profits is awesome and managing your risk by defining you position size and having a stoploss is a must in trading
Altwalker integrates also 2 special tools besides the trend highlighter:
MoneyFlow Signals , which appear as Red and Green tiny Triangles , highlight when money are starting flowing in (green - bullish sing) or out (red - bearish sign)
Overbought and Oversold RSI Signals , which appear both as darker background (the darker the color, the more the price is in overbought/oversold) and green "ob"-"tp" / red "os"-"tp" labels (they optionally pop up only on a configurable stronger overbought/oversold condition)
You can edit many options in order to
enable/disable showing buy/sell signals
enable/disable showing trendline
enable/disable showing trend as background
enable/disable showing moneyflow signals
edit moneyflow period of analysis (I suggest a number between 70 and 100 in general)
enable/disable showing rsi signals
edit rsi length, overbought and oversold levels
The user who wants to use this strategy, especially via an automated bot, must always set a stoploss (example 150$ from entry on bitcoin) or use a proper risk management strategy .
This is not the "Holy Grail", so use it with caution. It's highly suggested to use a proper money management .
This script will let you set all notifications you may need in order to be alerted on each triggered signals.
Here there are some examples how Altwalker works and results you can get following its buy/sell trend suggestions.
LINKUSDT 1D
BNBUSDT 1D
ATOMUSDT 1D
XTZUSDT 1D
ETHBTC 6h
XBTUSD 1D
XLMUSDT 1h
VETBTC 6h
LTCBTC 6h
Here there are some examples how MoneyFlow signals give you a nice insight on near future trend - "Follow The Money" .
ETHUSD 1D
ETHBTC 1D
This is a premium indicator , so send me a private message in order to get access to this script.

Altcoin Bullphase"Altcoin Bullphase" is an indicator to check if altcoins are currently in a bullphase/altseason.
The indicator is checking if Bitcoin is above or below a certain type of Moving Average and paints the color of the candles on the chart and tradingpair of your choice either green or gray for above or below the Moving Average.
NOTE: You have to disable the border color of the candles or use grayscale to get the look from the preview.
Default setting is 20 week moving average as it has the best history of calling an altcoin season.
Altcoins generally do really well when Bitcoin is above the 20 week moving average and don't do well when it falls below.
This indicator makes it easy to compare the performance of altcoins in these different phases and helps deciding on the future trend of a coin.
This script works for any altcoin, currency or stocks. Even Oil if you like to do that.
You can choose the type of MA between SMA , SMMA , EMA , WMA and VWMA .
You can set a static timeframe from 4h, 1D, 3D and 1W.
You can set any MA from 20 to 200.

[JOHN] CROSSHello this is CROSS indicator. (work on ALTCOINS, BTC AND ETH)
---------------------------------
How this indicator work?
CROSS script work with MOVING AVERAGES and MA CROSS DISPLAYED ON CHART.
This system provide
- Possible buy/sell zones, to catch bull and bear cycle. (H4 AND D1 WORK PERFECTLY)
----> YELLOW BARS BUY
----> RED BAR SELL (TAKE PROFIT ON POSITION OR SHORT)
- Crossover of the 2 Moving averages ploting on chart with "GOLDEN CROSS" and "DEATH CROSS" with alert condition included if you want receive alerts.
BELOW SOME EXAMPLE WITH SOME COINS
Remember the rules and watch the charts below
YELLOW CANDLES = BUY
RED CANDLE = SELL
----------------------
LEO / BTC
MATIC / BTC
XTZ / BTC
LINK / BTC
ETH / BTC
ETH / USDT
BTC / USDT
THIS CAN BE USED WITH KNIFE CUT INDICATOR FOR HELP ON BIAS.
----------------------
i hope you like, if you have question please comment below
i will help you.
Thanks

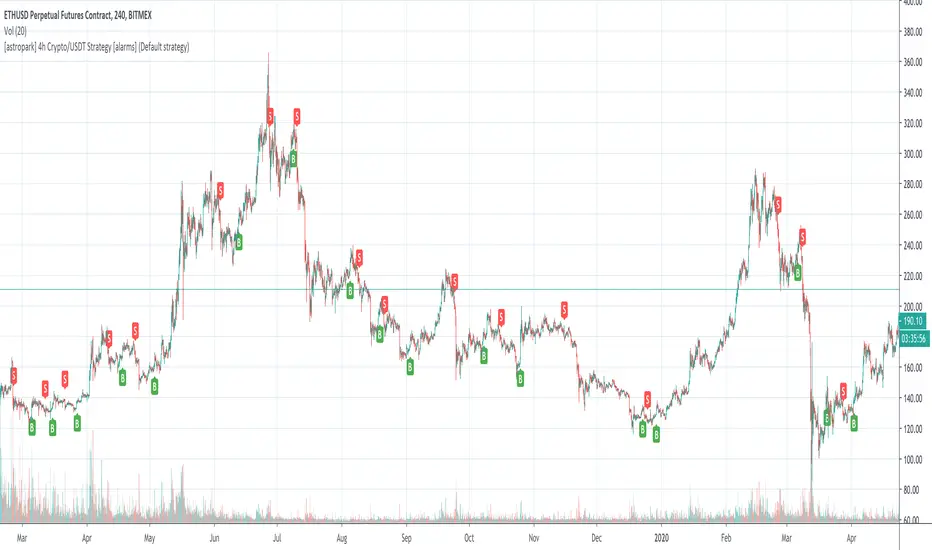
[astropark] 4h Crypto/USDT Strategy [alarms]Dear Followers,
today a new Swing and Scalper Tool , which works great for Cryptocurrencies on the USDT market on 4h timeframe .
This tool has some cool features:
it works on many timeframes, but best one is 4H timeframe : so you can enjoy both manual and bot trading by using a 24/7 running bot;
it comes in three working mode : default, alternative and high frequency ;
auto-stoploss: you can enable an stoploss in trade, bot will follow
It's always suggested to use a proper money and risk management in trades. This is not the "Holy Grail", it does not exist.
Strategy results are calculated from the beginning of 2018 till now, so more than 2 years, using 10000$ as initial capital and working at 1x leverage (no leverage at all!) and 0.1% trading fee already applied.
You can always DM me if you need any help to configure it on your preferred chart or if you want a customization of this bot for a specific pair.
This script will let you set all notification alerts you may need in order to be alerted on each triggered signals.
The one for backtesting purpose can be found by searching for the astropark's "4h Crypto/USDT Strategy" and then choosing the indicator with "strategy" suffix in the name, or you can find here below
This is a premium indicator , so send me a private message in order to get access to this script.
Altcoins capitalization histogram [peregringlk]This script superseeds "Other altcoins BTC capitalization histogram". The previous versions was a bit confusing in my opinion and lacked some generalization, so I'm now publishing this improved version.
It shows 6 pieces of info:
- Green columns: BTC price change for that day.
- Red bars: Altcoins capitalization change for that day, measured in bitcoins (altcoins_USD_capitalization / BTCUSD)
- Green/red background: green if that day the USD capitalization change was a gain, and red if it was a loss.
- Green line: accum BTC price change for the selected last days.
- Red line: accum altcoin capitalization change measured in BTC for the selected days.
- Dotted blue sequence: accum altcoin USD capitalization change for the selected days.
The base line of the histogram is 1 instead of 0, because I'm showing the price changes as multipliers (price change rates), so if there have been a +20% market movement, the calculated value will be 1.2, and if there have been a -20% market movement, then the value will be 0.8. 1 means no movement (preserved price/capitalization). Price and capitalization changes will be calculated using candle closes.
About the accumulated price changes, it will calculate the accumulated multiplication of the corresponding price change multipliers. For example, if you have set you want 3 days for the accumulation rates, and the last three days saw a -20%, +10% and +15% price/capitalization changes, the current value for the line will be 0.8*1.1*1.15 = 1.0120, or a +1.2% price change respect to the day before yesterday.
By default, if you are looking any ALTBTC market (for example, ETHBTC), instead of showing the USD and BTC capitalization of all alts, it will take the BTC and USD prices of the current market (the USD price will be calculated as ALTBTC * BTCUSD; and the BTCUSD price will be taken from BITSTAMP, the one with the longest BTC history I know in tradingview). If you are looking any other markets that is not paired with BTC, then it will take the USD capitalization of all altcoins, and the BTC capitalization will be calculated as altcoins_USD_capitalization / BTCUSD (from BITSTAMP as well).
Also, remember that, in both cases (alts capitalization or price), the graph will consistently respect the following rule:
- btc_usd_price_change * alt/capitalization_btc_price_change = alt_usd_price_change.
That applies for both the green/red bars respect to the background, and the green/red line respect to the blue dotted sequence.
Lastly, you may want to know if, in case btc price and altbtc price or capitalization go in opposite directions, who gain the battle? For example, if BTCUSD moved +20%, and an ALTBTC price moved -20%, the result is a loss, because 1.2*0.8 = 0.96, so the ALTUSD price or capitalization moved -4% (remember that, for preserving the USD value, if today's bitcoin change rate is x, the altbtc change rate must be 1/x; so for a -20% BTCUSD price movement, there must be at least a +25% ALTBTC price change to don't loss USD value, because 1/0.8 = 1.25). The background is what shows you that: if the background is green, it means that for that day there was a total USD gain of value, and when it's red, then it was a loss of USD value.
You can customize the following things:
- Accum change rate interval: the "selected days". By default 7.
- Take alts-capitalization?: By default unmarked. The effect when is unmarked is what I have explained in the previous paragraph. If you mark it, then it will use the USD_capitalization of all alts no matter what market you are looking right now.
- Which capitalization do you want? There are three options, that applies when "Take alts-capitalization?" is marked, or otherwise, when you are not looking a BTC-paired market.
- - - All-alts (default option): take CRYPTOCAP:TOTAL2 security as reference Alts-capitalization, which represents all altcoins.
- - - Other-alts: take CRYPTOCAP:OTHERS security as reference Alts-capitalization, which represents all altcoin except the 9 most capitalized alts.
- - - Big-alts: take CRYPTOCAP:TOTAL2 - CRYPTOCAP:OTHERS as reference Alts-capitalization, which represenst only the 9 most capitalized alts.
The idea of this script is:
A) Figuring out what is causing a USD value gain or loss, the alts market movements, or the BTC price change. So you can spot if some altcoin, or all altcoins combined, are gaining or loosing value by themselves or because of bitcoin.
B) Trying to spot or discover some patterns that allows you to identify altseasons. Once an altseason has been developed, the chart will show it in a pretty obvious way (massive red line bells and dotted blue lines with very high values during a period of various weeks). The hard problem is to spot it in advance, and maybe this graph can help.

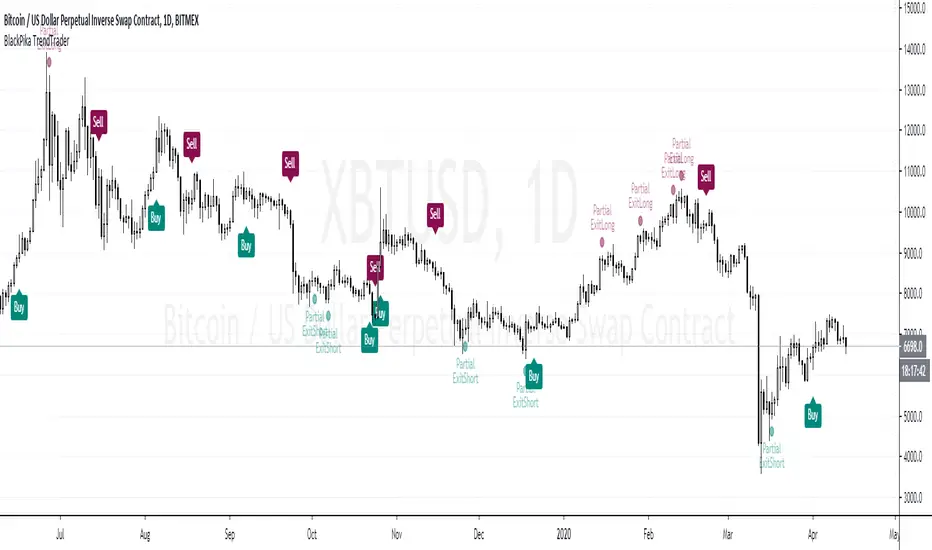
BlackPika TrendTraderIntroducing BlackPika TrendTrader (TT)
This indicator use moving averages and RSI (Default settings) for Entry Signals and Partial Exits.
It is recommended to use this for Spot market trading for swing trades, ideally on higher timeframes (4H to D)
It can be used to gauge the trend of underlying asset on Daily timeframe.
Trailing signals are also available such as Trailing take profits and Trailing stop losses.
There are two modes available for entry signals
- Normal mode (default)
- Sensitive mode (which can give better entries but also can lead to higher noise)
Hope you find this indicator useful.
Do comment if you have any questions.
Good luck in your trading.
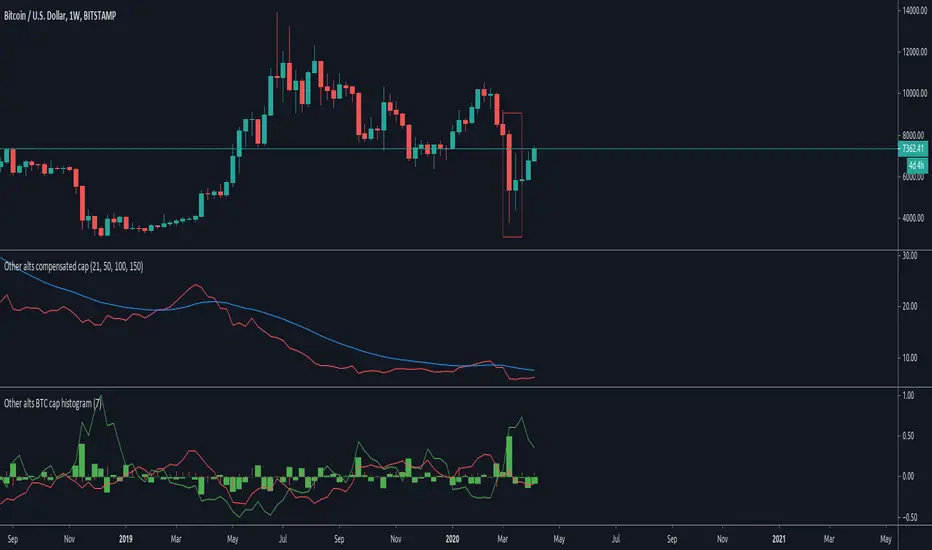
Other altcoins BTC capitalization histogram [peregringlk]Introduction
==========
This study is intented to be used in combination with my other study "Other alts compensated cap". Read its description, in particular, it's rationale, to understand why I have removed the big capitalized altcoins from these studies.
The middle indicator in the image is that other study, while the indicator in the buttom of the image is that one.
It shows, in form of histogram, the BTC capitalization change rate (per candle, using closes) of the "OTHERS" altcoins together with the inverse of the BTCUSD price change rate per candle.
NOTE: I call the change rate to the multiplier factor of price from bar to bar. For example, a change rate of 1.20 means +20% respect to "yesterday", and a change rate of 0.80 means -20%.
The idea is to know what are altcoin markets (against BTC) doing after each BTC price change.
Definitions
=========
I will use ALT from now one as the name of an index or fictional coin that represents the average price of all other altcoins combined. I'll use then ALTUSD to represent the price against USD of such fictional coin (= the OTHERS capitalization, as if the USD capitalization of altcoins were the USD price of ALT), and ALTBTC to represent the same price but against BTC (calculated by taking ALTUSD/BITSTAMP:BTCUSD; the choosing of BITSTAMP is because it's the market with a longer history in tradingview).
Since I use the "OTHERS" security, I cannot know the real altcoin index so I can only estimate by using the capitalization. CIX100 could be a solution, but it is too recent in time as to inspect past price actions.
Description
=========
For example, let's assume BTCUSD decreases by 20% today. It would cause a fall in ALTUSD of 20% (just maths). So, what should it happen in ALTBTC to preserve the original ALTUSD price? People should buy alts in BTC markets by a factor of 1/0.8 = 1.25. Or in other words, unless there are a +25% grow in ALTBTC, ALTUSD would see a decrease in value.
This is what the histogram shows. The red columns shows the ALTBTC change rate per candle, while each green column shows what is the required change rate in ALTBTC required to preserve its ALTUSD value (capitalization). In other words, the green columns are the "targets" to preserve USD capitalization in ALTBTC, while the red histogram shows the actual changes.
Also, it shows two curves. There are just the change rate accumulation during some customizable interval (the same for both lines, and 7 by default; or the "week" for daily candles).
The green line is the accumulated "target" change rate within that period of time (the accumulated product of the last `interval` change rates), and the red line is the actual change rate for the same `interval` candles.
Interpretation
============
If red column values are bigger than the green ones (green column is negative, and red column is positive; or both are positives but the red one "put outs", or both are negative but the red column doesn't "put out"), OTHERS USD capitalization has increased.
If red column values are lower than the green ones (green column is positive and red column is negative; or both are positives but the red one doesn't "put out"; or both are negative but the red column "put outs"), OTHERS USD capitalization has decreased.
The same for the continuous lines: if the red line is above the green one, OTHERS USD capitalization has increased during "the past week". Otherwise, it has decreased.
The added value of this indicator is that it allows you to know "why". For example, if a green column is positive, and its corresponding red column is positive as well, but below the green one, the capitalization has decreased but BECAUSE the btc price has fallen, not because there was a sellof in alts. Actually, there was some buys (the ALTBTC price increased); it just it was not enough to counteract the btc fall.
That can be clearly seen in the remarked candle in the plot, the "coronavirus" sellof. The BTCUSD fall was huge (the hugest in BTC history), and the green column is telling you that to preserve the capitalization a lot of buys were required. However, that didn't happen. Actually, the OTHER alts were pretty quiet (the red column is tiny), causing a massive indirect loss of capitalization.
Also, with the curves, you can know if there was a total gainning or loss of capitalization during the past few days or candles. Also you can try to spot the beginning of alts seasons by crosses between red and green lines: if the red lines crosses above the green one (because there was a continuous sequence of red columns above green ones), it means that, potentially, were are at the beginning of an alt season because people are accumulating.
Table of cases
===========
- if the green column is positive (BTCUSD is down)
- if the red column is positive (ALTBTC is up)
- bigger than the green column: ALTBTC buys are stronger than required by arbitrage and have counteracted and overcome the BTC fall.
- shorter than the green column: there have been some buys but not enough, so the BTCUSD fall has not been fully counteracted.
- if the red column is negative (ALTBTC is down): the loss is double: BTCUSD have lost value + ALTBTC is bleeding.
- If the green column is negative (BTCUSD is up)
- if the red column is negative (ALTBTC is down)
- bigger than the green column: ALTBTC sells are so strong that have counteracted the BTC increase in value, causing a loss of USD value.
- shorter than the green column: there have been sells but overall the ALTUSD price has increased.
- if the red column is positive (ALTBTC is up): the gain is double: BTCUSD has gain value + ALTBTC is also growing.
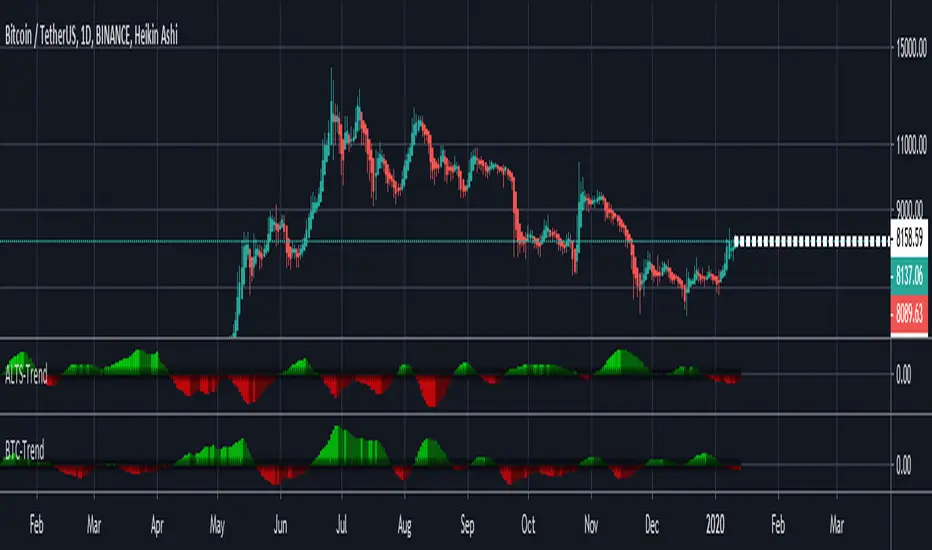
ALTS-Trend
ALTS-Trend
Altcoins-Trend is a technique that shows how much Altcoins is dominating the Marketcap and it's effect over the whole Crypto Market ,and that will show you alts season in each time frame because trend is relative .
*** Features
* Color grading to show you the Increase of domination effect (Green).
* Color grading to show you the Decrease of domination effect (Red) .
* Better understanding to the market ,and that will help you with a very good timed trades at the best trading times for altcoins .
/////////////////////////////////////////////
*Note
Special thanks for Lazybear for his momentum algorithm .
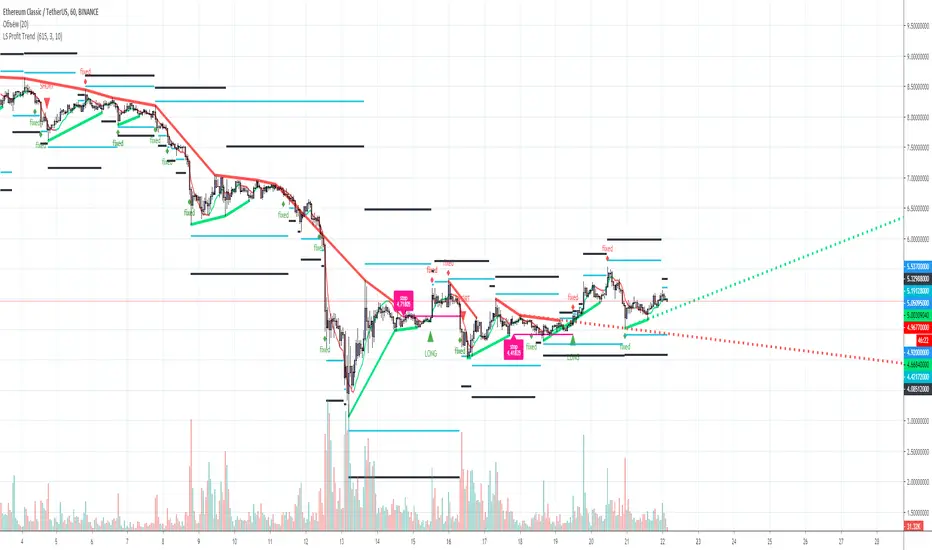
L&S PROFIT SCALP Indicator for scalp trades for TF 1-15 minutes. 1-4 signals per day depending on the currency pair. Suitable for all crypto exchanges, Forex, binary options. Signals+ take profit Levels.

L&S PROFIT TREND Trend indicator for TF from 1 hour and above, for any trading pair, any exchange, binary options. Signals+ Take profit levels. 90% good signal and take profit 1.