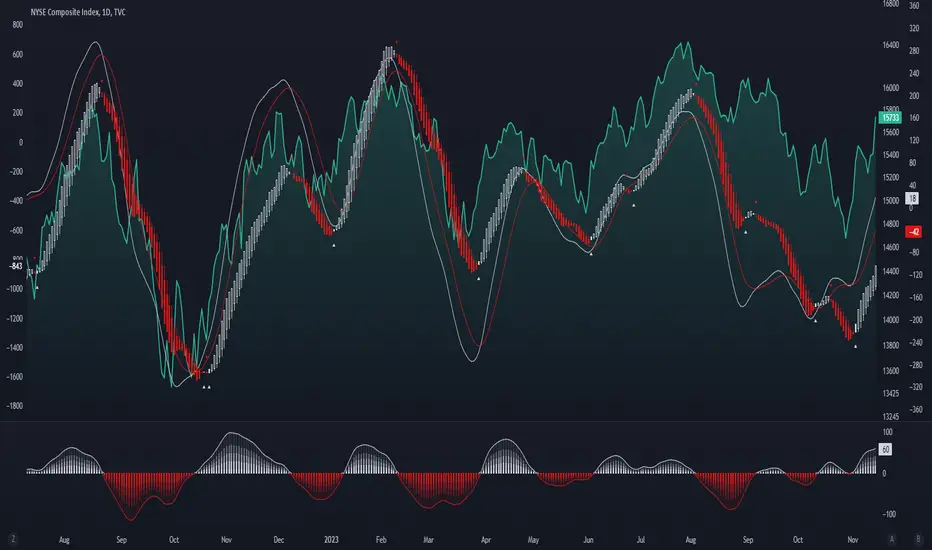
Enhanced McClellan Summation Index
The Enhanced McClellan Summation Index (MSI) is a comprehensive tool that transforms the MSI indicator with Heikin-Ashi visualization, offering improved trend analysis and momentum insights. This indicator includes MACD and it's histogram calculations to refine trend signals, minimize false positives and offer additional momentum analysis.
Methodology:
McClellan Summation Index (MSI) -
The MSI begins by calculating the ratio between advancing and declining issues in the specified index.
float decl = 𝘐𝘯𝘥𝘪𝘤𝘦 𝘥𝘦𝘤𝘭𝘪𝘯𝘪𝘯𝘨 𝘪𝘴𝘴𝘶𝘦𝘴
float adv = 𝘐𝘯𝘥𝘪𝘤𝘦 𝘢𝘥𝘷𝘢𝘯𝘤𝘪𝘯𝘨 𝘪𝘴𝘴𝘶𝘦𝘴
float ratio = (adv - decl) / (adv + decl)
It then computes a cumulative sum of the MACD (the difference between a 19-period EMA and a 39-period EMA) of this ratio. The result is a smoothed indicator reflecting market breadth and momentum.
macd(float r) =>
ta.ema(r, 19) - ta.ema(r, 39)
float msi = ta.cum(macd(ratio))
Heikin-Ashi Transformation -
Heikin-Ashi is a technique that uses a modified candlestick formula to create a smoother representation of price action. It averages the open, close, high, and low prices of the current and previous periods. This transformation reduces noise and provides a clearer view of trends.
type bar
float o = open
float h = high
float l = low
float c = close
bar b = bar.new()
float ha_close = math.avg(b.o, b.h, b.l, b.c)
MACD and Histogram -
The Enhanced MSI incorporates MACD and histogram calculations to provide additional momentum analysis and refine trend signals. The MACD represents the difference between the 12-period EMA and the 26-period EMA of the MSI. The histogram is the visual representation of the difference between the MACD and its signal line.
Options:
Index Selection - Choose from TVC:NYA , NASDAQ:NDX , or TVC:XAX to tailor the MSI-HA to the desired market index.
MACD Settings - Adjust the parameters for the MACD calculation to fine-tune the indicator's responsiveness.
Ratio Multiplier - Apply scaling to the MSI to suit different market conditions and indices.
Benefits of Heikin-Ashi -
Smoothed Trends - Heikin-Ashi reduces market noise, providing a more apparent and smoothed representation of trends.
Clearer Patterns - Candlestick patterns are more distinct, aiding in the identification of trend reversals and continuations.
Utility and Use Cases:
Trend & Momentum Analysis - Utilize the tool's Heikin-Ashi visualization for clearer trend identification in confluence with it's MACD and histogram to gain additional insights into the strength and direction of trends, while filtering out potential false positives.
Breadth Analysis - Explore market breadth through the MSI's cumulative breadth indicator, gauging the overall health and strength of the underlying market.
- Alerts Setup Guide -
The Enhanced MSI is a robust indicator that combines the breadth analysis of the McClellan Summation Index with the clarity of Heikin-Ashi visualization and additional momentum insights from MACD and histogram calculations. Its customization options make it adaptable to various indices and market conditions, offering traders a comprehensive tool for trend and momentum analysis.
Amex
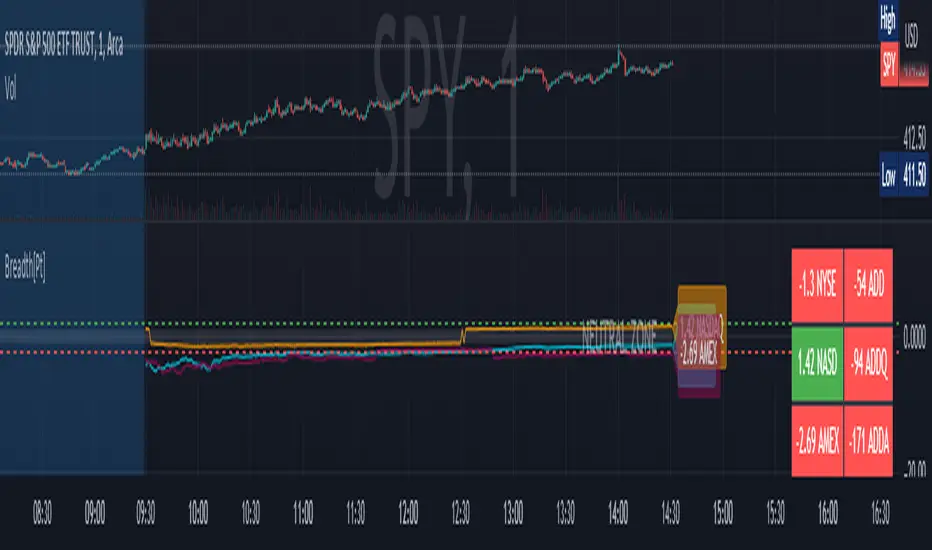
Market Breadth Ratio [Pt]The Market Breadth Indicator is a technical analysis tool that provides traders and investors with valuable insights into the overall health of the stock market. This particular version of the indicator plots the Up Volume vs Down Volume Ratios for three major U.S. stock exchanges - NYSE, NASDAQ and AMEX - on a single chart.
The Up Volume vs Down Volume Ratios measure the strength of buying versus selling pressure in the market. A ratio greater than 1 indicates that there is more buying pressure, while a ratio less than -1 indicates more selling pressure. The ratio is calculated by dividing the total volume of stocks that closed up on the day by the total volume of stocks that closed down.
By plotting the Up Volume vs Down Volume Ratios for all three exchanges, the Market Breadth Indicator provides a comprehensive view of the overall market sentiment. If all three ratios are above 1, it indicates that the market is in a bullish trend, while if all three ratios are below -1, it indicates a bearish trend. A divergence between the ratios can also signal potential shifts in market sentiment.
Traders can use the Market Breadth Indicator to confirm the direction of the market and identify potential buying or selling opportunities. For example, if the market is in a bullish trend and the NYSE ratio is consistently higher than the other two ratios, it may indicate that the NYSE is leading the market and traders may want to focus on buying stocks listed on the NYSE.
Overall, the Market Breadth Indicator is a valuable tool for traders and investors to assess the overall market health and make informed trading decisions based on market sentiment.
Bonus feature: there is an option to display data for ADD for the three exchanges as well on the data table.
Advance/Decline Line [IQ]Advance/Decline Line is a Market Breath indicator.
A/D line calculates a ratio between total number stocks advancing and total number of stocks in one day, providing another way to grasp the market breath at any moment.
We think the indicator covers the whole market, as we use data from the three main exchanges: NYSE, NASDAQ and AMEX.
The New York Stock Exchange (NYSE), nicknamed "The Big Board") is by far the world's largest stock exchange by market capitalization of its listed companies.
The Nasdaq Stock Market (NASDAQ) is ranked second on the list of stock exchanges by market capitalization of shares traded, behind the New York Stock Exchange.
The American Stock Exchange (AMEX) is the third largest stock exchange in the U.S. after the NYSE and the NASDAQ, and handles approximately 10% of all American trades.
How to interpret it:
Green columns mean more than 50% of NASDAQ stocks are advancing, red columns mean more than 50% of NASDAQ stocks are declining.
Green values above the top band mean correlation to the upside, red values bellow the low band mean correlation to the downside.
Correlation means rising probability of capitulation (to the upside or to the downside) and is market by a white bar (as signal).
Important:
For a better interpretation, the Advance/Decline Line indicator should be used in conjunction with other indicators (volatility, volume, etc.).

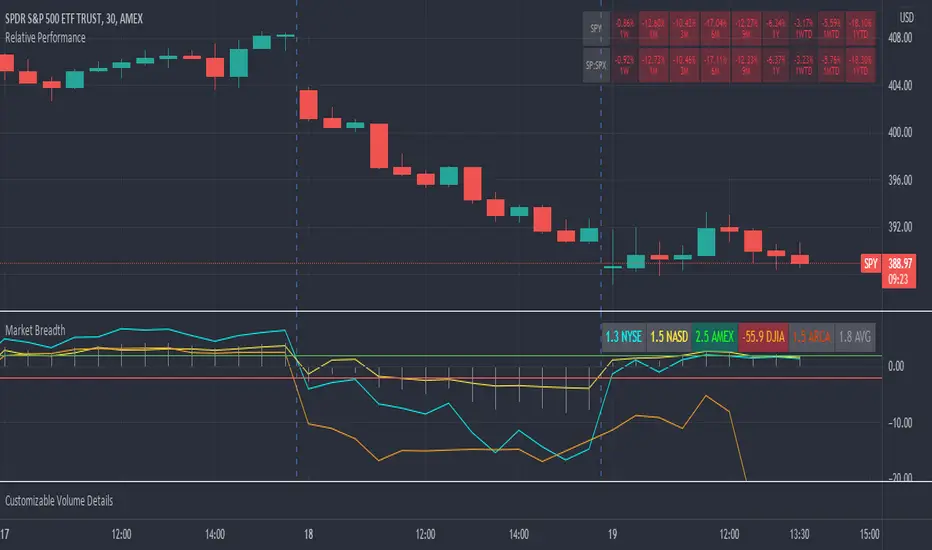
Market Breadth RatiosThis indicator provides breadth ratios for various indices/exchanges based on the up/down volume.
Breadth ratios included for NYSE, NASDAQ, AMEX, DJIA, ARCA, and and average.
Very straight forward to use, if the ratios is above 2, stocks should be in uptrend, below -2 stocks should trend down. In between 2 and -2 is going to be a choppy market.
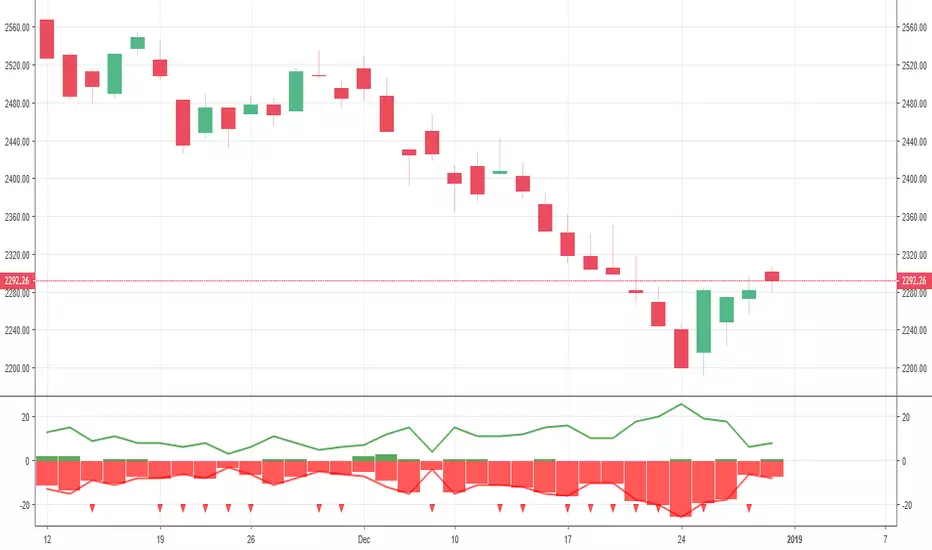
New Highs-Lows AMEX-Buschi
English:
This indicator shows the AMEX's up volume (green) and down volume (red).
Extreme trading days with more than 90 % up or down volume are marked via lines (theoretically values) and triangles (breaches).
Deutsch:
Dieser Indikator zeigt das Aufwärts- (grün) und Abwärts-Volumen (rot) der AMEX.
Extreme Handelstage mit mehr als 90 % Aufwärts- oder Abwärts-Volumen ist gekennzeichnet über Linien (theoretische Werte) und Dreiecke (Überschreitungen).
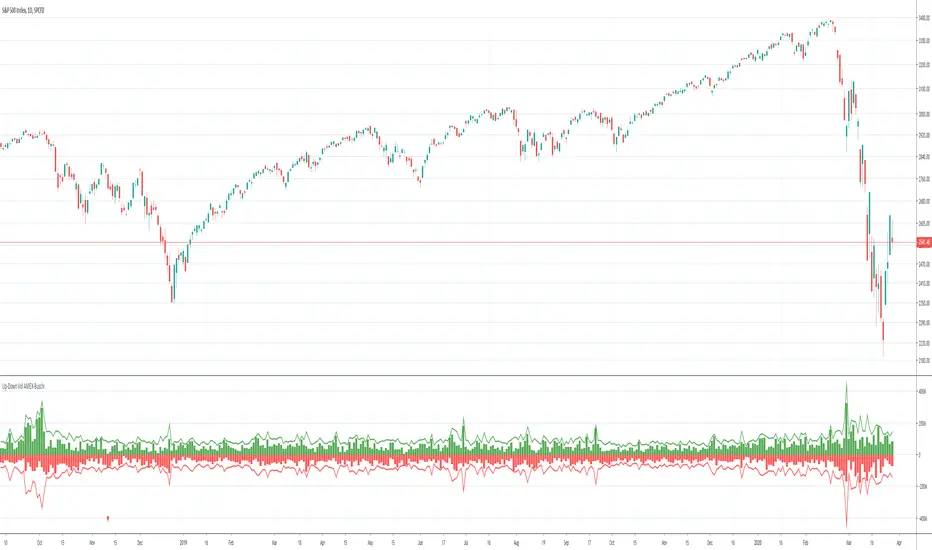
Up-Down Volume AMEX-Buschi
English:
This indicator shows the AMEX's up volume (green) and down volume (red).
Extreme trading days with more than 90 % up or down volume are marked via lines (theoretically values) and triangles (breaches).
Deutsch:
Dieser Indikator zeigt das Aufwärts- (grün) und Abwärts-Volumen (rot) der AMEX.
Extreme Handelstage mit mehr als 90 % Aufwärts- oder Abwärts-Volumen ist gekennzeichnet über Linien (theoretische Werte) und Dreiecke (Überschreitungen).