Aroon Single Line This indicator converts double lined Aroon indicator into a single line oscillator.
It is simply obtained by subtracting Aroon down from Aroon Up.
*If Oscillator points 100 value, it means there is a Strong Uptrend.
*If Oscillator points values between 100 and 40, it means there is an uptrend.
*If Oscillator points values between 20 and -20, it means no trend, it is sideways.But, when it is sideways; generally, oscillator makes FLAT LINES
between 20 and -20 values. 0 value is pointed out when the trend is downward as well, which means aroon up=aroon down.
*If Oscillator points values between -40 and -100, it means there is a downtrend.
*If Oscillator points -100 value, it means there is a Strong downtrend.
(20, 40) and (-20, -40) intervals are not mentioned, because; generally these are transition values and hard to comment, it will be more certain to
wait till values are between or at the reference values given.
Aroon

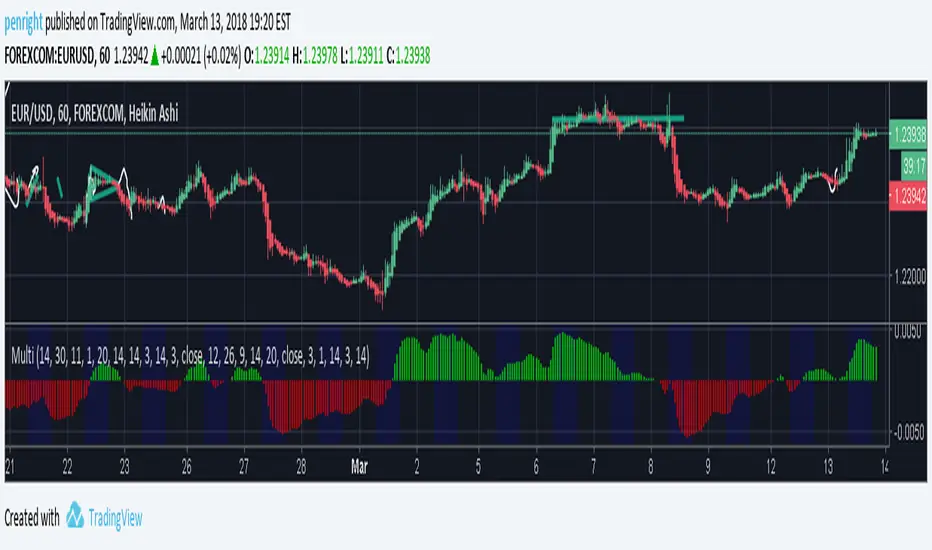
A Multi 10 indicatorREAD NOTE BEFORE APPLYING or you may think indicator doesnt work.
This indicator is a revise of another i made and contains 10 Optional Indicators allowing you to load more then 3 indicators at once if you so choose and dont pay for the platform!
Hopefully someone will find use for this script besides me :) I dont suggest turning all on at once because it
will not look right. Alot will overlap if you wish but i only use the Session and trend bar at once in
conjuction with a Oscillator setting like MacD , RSI , Stoch , Aroon or CCI .
In the chart you see i only have a few indicators active ENJOY!!
---------- NOTE ----------- ( Everything is OFF by default and indicator SHOULD show up BLANK when loaded) ------------ NOTE -------------
(Can turn EVERYTHING on AND change any values in the format tab once indicator loads)
Indicators included are listed below
Sessions, including, NY session, Aussie session, Asian session, and Europe market sessions.
MacD Split Colored , aroon oscillator
CCI Oscillator , classic aroon
RSI Oscillator , Elliot wave
Stoch RSI Oscillator , ATR%
My own Trend bar
---------- NOTE ----------- ( Everything is OFF by default and indicator SHOULD show up BLANK when loaded) ------------ NOTE -------------
(Can turn EVERYTHING on AND change any values in the format tab once indicator loads) CODE probably looks messey but this is something i made for me so i didnt really care lol
A Multi 10 indicatorREAD NOTE BEFORE APPLYING or you may think indicator doesnt work.
This indicator is a revise of another i made and contains 10 Optional Indicators allowing you to load more then 3 indicators at once if you so choose and dont pay for the platform!
Hopefully someone will find use for this script besides me :) I dont suggest turning all on at once because it
will not look right. Alot will overlap if you wish but i only use the Session and trend bar at once in
conjuction with a Oscillator setting like MacD , RSI , Stoch , Aroon or CCI .
In the chart you see i only have a few indicators active ENJOY!!
---------- NOTE ----------- ( Everything is OFF by default and indicator SHOULD show up BLANK when loaded) ------------ NOTE -------------
(Can turn EVERYTHING on AND change any values in the format tab once indicator loads)
NY session, Aussie session, Asian session, and Europe market sessions.
MacD Split Colored , aroon oscillator
CCI Oscillator , classic aroon
RSI Oscillator , Elliot wave
Stoch RSI Oscillator
Aroon Oscillator
My own Trend bar
---------- NOTE ----------- ( Everything is OFF by default and indicator SHOULD show up BLANK when loaded) ------------ NOTE -------------
(Can turn EVERYTHING on AND change any values in the format tab once indicator loads) CODE probably looks messey but this is something i made for me so i didnt really care lol

Aroon OscillatorAroon Oscillator for the Aroon indicator. This creates an oscillator out of the upper and lower aroon plots.
