SMC Sessions NYThis script plots vertical session markers on the chart to highlight session opens and closes based on New York time.
Key characteristics:
The indicator is plotted on the price chart (overlay).
It draws thin, dotted vertical lines at specific session times.
Sessions are calculated using the America/New_York timezone to ensure correct alignment.
Only weekdays (Monday to Friday) are considered.
The script draws sessions for today and up to one week back (maximum 7 calendar days).
All drawings are created once on the last bar to avoid duplicates and performance issues.
Each session has its own color for clear visual distinction:
Asia session (open)
London session (open and close)
New York / Kill Zone Morning (open and close)
Lunch session (open and close)
New York / Kill Zone Afternoon (open and close)
The Asia session open at 20:00 NY is intentionally excluded on Fridays, as there is no valid Asia session start on Friday evening.
The vertical lines extend across the entire visible price range of the chart.
The script is optimized to stay well within TradingView object limits.
Purpose:
The indicator is designed to give traders a clean, non-intrusive visual reference for key session transitions, helping to analyze price behavior around session opens and closes without cluttering the chart.
This approach is suitable for intraday and session-based trading models, including SMC-style workflows.
ASIA

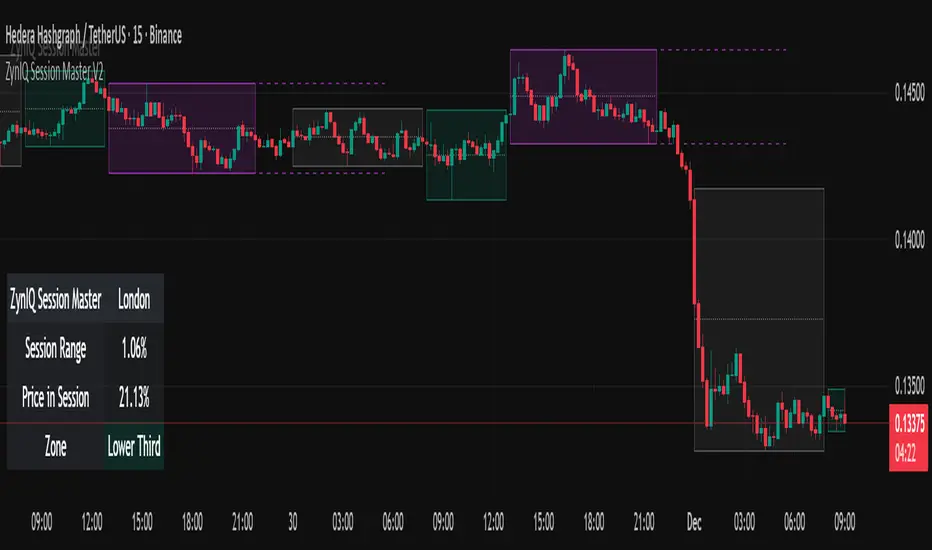
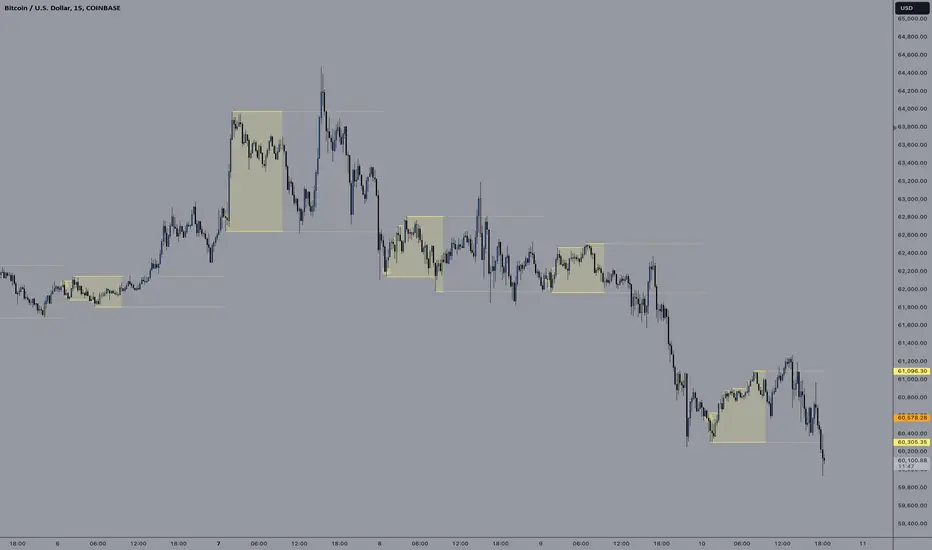
ZynIQ Session Master v2 - (Lite Pack)Overview
ZynIQ Session Master v2 (Lite) highlights key market sessions and their associated ranges, helping traders understand when volatility tends to shift between Asian, London and New York sessions. It provides clean visual context for intraday trading without overwhelming the chart.
Key Features
• Automatic detection and shading of major trading sessions
• Configurable session highlighting
• Optional range markers for Asia, London and New York
• Lightweight visuals suitable for fast intraday charting
• Simple session-based structure for context around volatility shifts
• Optional labels marking session transitions
Use Cases
• Seeing where session volatility typically increases
• Identifying when price is leaving a session range
• Timing trades around session opens
• Combining session structure with breakout, trend or momentum tools
Notes
This script provides session structure and volatility context. It is not a standalone trading system. Use alongside your preferred confirmation and risk management.
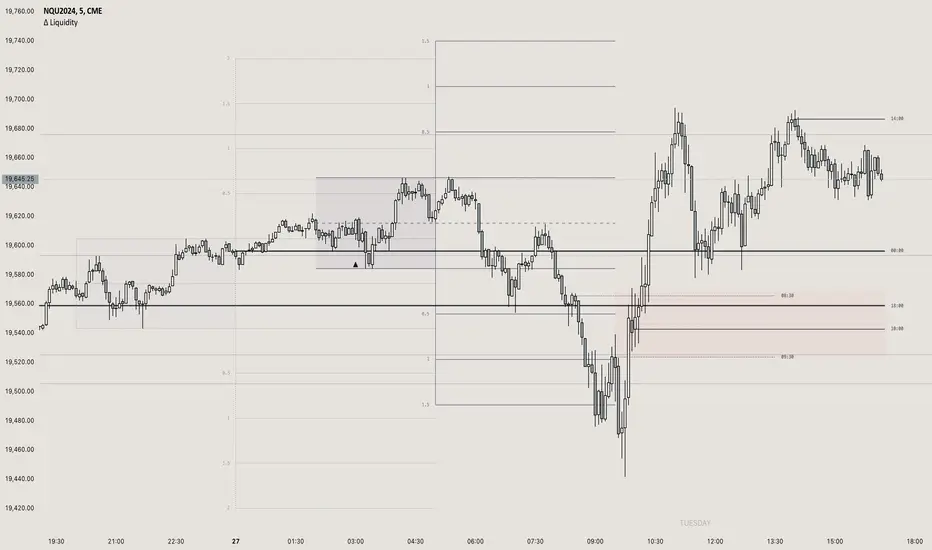
A+ Model - Cave EducationHere is a comprehensive and detailed explanation of the "A+ Model - Cave Education" Pine Script code.
This script is a sophisticated technical analysis tool designed for TradingView. It assists traders in identifying specific institutional time windows, price ranges (sessions), and "Macro" volatility periods based on the ICT (Inner Circle Trader) or similar time-based trading concepts.
Below is the breakdown of how the code functions, organized by its logic sections.
1. General Overview
The script is an overlay indicator (it sits directly on the price chart). Its primary purpose is to:
Highlight a specific trading session (The "A+ Box") and mark its High/Low.
Mark key institutional times (07:00 NY and 09:30 NY Open).
Identify "Macro" windows (specific 20-minute periods where algorithms are active) and draw dynamic ranges around them based on volatility (ATR).
Project future times onto the chart to help the trader prepare for the next day.
2. Settings & Inputs (User Configuration)
The code begins by defining a vast array of user inputs, grouped for better usability:
General Time & Box: Allows the user to define the "A+ Session" time (default 20:00-00:00) and the Time Zone (UTC-5/New York). It also handles the visual style (colors) of the session box.
Visibility: A crucial performance and visual clutter setting. boxDays limits how far back the A+ boxes and time lines are drawn (default 14 days). Macros are strictly limited to the current week to prevent chart lagging.
Line & Text Controls: Every visual element (A+ lines, NY markers, Macros) has toggles (input.bool) to show/hide the lines or the text labels separately.
Macro Settings: Defines the time windows for three separate macros and an ATR Multiplier. The ATR multiplier determines how wide the channel lines are drawn around the macro price action.
3. Logic Breakdown by Section
Section 1: The "A+ Draw" Box (Session Range)
This is the core of the A+ Model.
Logic: The script checks if the current bar is within the user-defined sessionTime.
Box Creation:
When the session starts, it initializes a new Box (box.new).
Throughout the session, it continuously updates the Box's Top (Highest High) and Bottom (Lowest Low) to encompass the full range of that time period.
Extension Lines (Support/Resistance):
Once the session ends, the script draws two horizontal lines: one from the Session High and one from the Session Low.
Smart Break Logic: These lines are active (highActive, lowActive). They extend to the right until the price breaks them (High line is broken by a higher price, Low line by a lower price). This helps traders see if the session range is being respected or broken later in the day.
Section 2: Time Lines (NY Midnight & Open)
This section marks vertical reference points.
It checks for specific times: 07:00 and 09:30 (in the user's timezone).
If the current bar matches these times, it draws a vertical line (line.new) covering the High/Low of that bar and places a label (e.g., "NY." or "09:30") above it.
This helps the trader orient themselves regarding the New York session Open and the "Killzone" start.
Section 3: Macros (Volatility Windows)
This is the most complex calculation in the script.
Definition: Macros are specific time windows (e.g., 09:50–10:10) where price delivery is often accelerated.
Visibility Rule: To keep the script fast, this only runs if isCurrentWeek is true.
ATR Offset: The script calculates the Average True Range (ATR). It uses this to create a "channel" around the price.
Drawing Logic:
When a Macro time starts, the script tracks the Highest High and Lowest Low inside that specific 20-minute window.
It draws parallel horizontal lines above and below these prices.
The Twist: The lines are not drawn at the High/Low. They are offset by ATR * Multiplier. This creates a wider "zone" around the macro price action, visually indicating a volatility range.
Section 4: Future Projection (Tomorrow)
This feature is for planning ahead.
It runs only on the last bar of the chart (barstate.islast).
It calculates the timestamps for the next occurrence of the key times (07:00, 09:30, and all three Macros).
It draws vertical lines into the future (empty space on the right of the chart).
Benefit: The trader can see exactly where 09:30 or the next Macro will occur on the timeline before the candles even print.
4. Helper Functions
The code uses custom functions to keep the logic clean:
f_drawFuture(...): A standardized function to draw the future vertical lines and labels so the code doesn't have to repeat itself for every single time marker.
isStartTime(...) & isInTime(...): Shorthand functions to check if the current candle belongs to a specific session string (like "0950-1010").
Summary of Improvements in this Version
Compared to a standard indicator, this script is highly optimized:
Text Control: You can turn off text labels while keeping the lines (or vice versa).
Performance: It limits historical drawing (only 14 days back for boxes, only this week for macros) to prevent "Maximum Line Count" errors in Pine Script.
Visual Clarity: It uses different colors for different Macros (Blue, Red, Orange) to make them instantly distinguishable.

[iQ]PRO Market Sessions+🌐 PRO Market Sessions+: The Architecture of Market Time
Elevate your market analysis with the PRO v1 Time Cycles indicator—a sophisticated, proprietary framework engineered to meticulously map and visualize critical, high-probability time segments across global trading sessions. This tool transcends conventional session highlighting by providing a multi-layered, time-boxed view of market behavior, offering unparalleled clarity on structural shifts and key price levels.
This tool is optimized for professional traders, providing an edge by focusing on the fractal nature of market timing.
⏳ Precision Time Segmentation
The core functionality revolves around the hyper-precise segmentation of the trading day, anchored to the New York (EST) timezone to capture institutional flow.
Global Overlap Coverage: Integrates key Asia and London sessions with the comprehensive New York trading day, allowing for the analysis of transitional volatility and overlap strategies.
Structured Cycles: Deploys a unique system of 270-minute cycles, nested with 90-minute and 30-minute subdivisions. This hierarchical structure reveals how market structure evolves from macro-sessions down to critical, granular pivots.
New York Focus: Features distinct AM and PM 270-minute cycles, further broken down into 90-minute tranches (AM1, AM2, AM3 / PM1, PM2, PM3) and fine-tuned with 30-minute and even 10-minute boxes for exceptional high-resolution analysis.
London Depth: The London session is captured as a 270-minute block, with its own nested 90/30-minute structures, providing a complete view of the European market's structural integrity before the US open.
✨ Dynamic Structural Analysis
Beyond mere visualization, the indicator computes and projects critical structural levels within each time box, acting as dynamic reference points for price action.
Dynamic Price Anchors: Each time-cycle box is calculated to reveal key price metrics, including the Open Price and the Equilibrium (EQ) Level (Mid-Range). These lines serve as potent technical levels, often representing institutional reference points for deviation and reversion.
High/Low Capture: The extreme High and Low of each significant time segment are captured and marked, forming the boundaries of the structural range and identifying potential areas of liquidity draw.
Persistent Levels: Projects Previous Day, Week, and Month High/Low levels. These crucial historical benchmarks act as magnets or barriers to current price movement, providing essential macro-context to intra-day analysis.
🎨 Customizable & Non-Intrusive
The PRO v1 Time Cycles is designed for seamless integration into any chart setup, offering extensive customization without cluttering the price action.
Control over Granularity: Users maintain complete control over which time cycles (270, 90, 30, 10-minute) are displayed, ensuring the chart reflects the specific trading strategy and timeframe required.
Aesthetic Flexibility: Features highly detailed options for color, border styles, text alignment, and line thickness for every major session and nested cycle, allowing for a fully personalized and professional workspace.
This tool is a fundamental component of the iQ PRO suite, providing the essential temporal context required to execute sophisticated, time-based trading strategies. Its robust architecture is built to empower the discerning trader with a clearer, more structured view of the market's inner workings.

Thiru-KillzonesThiru Killzones - Advanced Trading Session Indicator
Overview
Thiru Killzones is a comprehensive trading session indicator designed to help traders identify and analyze key market sessions throughout the trading day. It visualizes five major trading sessions (Asia, London, NY AM, Lunch, NY PM) with customizable opening range analysis, target levels, and statistical tracking.
Key Features
📊 Trading Sessions
5 Major Sessions: Asia, London, NY AM, Lunch, NY PM
Customizable Times: Configure each session's start and end time
Individual Colors: Each session can have its own color
Enable/Disable: Turn sessions on/off individually
Session Extension: Extend sessions beyond normal hours (especially useful for Asia session)
📈 Opening Range Analysis
Configurable Duration: Set opening range period (default: 60 minutes)
Breakout Flags: Visual indicators when price breaks target levels
Target Visualization: Optional boxes and lines at target levels
Performance Tracking: Statistics table showing hit rates for each target level
🎨 Visual Styles
Choose from 4 unique visual styles:
Frame: Full box with borders (default)
Shade: Background fill only (no borders)
Horizon: Horizontal lines marking session boundaries
Rails: Horizontal lines with vertical orientation option
🏷️ Labels & Display
Customizable Labels: Show session name, day, price range, or pips
Flexible Positioning: Top/Bottom/Center, Inside/Outside, Left/Center/Right
Auto-hide on Daily+: Automatically hides labels on daily timeframe and higher
Multiple Sizes: Auto/Tiny/Small/Normal/Large/Huge
📊 Statistics & Analysis
Session Statistics Table: Compare current session range vs average
Value Format: Display as Price or Pips
⚙️ Advanced Settings
Timezone Support: 27 timezone options (GMT-11 to GMT+12)
Timeframe Filtering: Hide indicator on higher timeframes
History Control: Control how many historical sessions to display
Unified Colors: Option to use same color for all sessions
Transparency Control: Separate transparency for boxes and borders
Border Customization: Solid/Dash/Dot styles with adjustable width
How to Use
Basic Setup
1. Add the indicator to your chart
2. Configure your timezone in Settings
3. Enable the sessions you want to track
4. Customize colors and visual style
Opening Range Analysis
1. Enable "Opening Range" for desired sessions
2. Set the duration (default: 60 minutes)
3. Enable target lines/boxes to see R1/R2/S1/S2 levels
4. Enable breakout flags to see when price breaks levels
5. Enable data table to track statistics
Session Extension
1. Enable "Extended Range" for sessions that cross midnight (like Asia)
2. The indicator automatically calculates the session end time
3. Opening range lines will stop exactly at session end time
Customization
- Use "Visual Style" section to change box appearance
- Use "Labels" section to customize label display
- Use "Unified Colors" to apply same color scheme to all sessions
- Adjust transparency for cleaner chart appearance
Default Session Times
- Asia: 18:00-00:00 (crosses midnight)
- London: 02:00-05:00
- NY AM: 08:30-10:00
- Lunch: 12:00-13:00
- NY PM: 13:30-16:00
*Note: Times are in your selected timezone*
Tips
- Use "History Periods" to control how many past sessions are displayed
- Enable "Hide on Daily+" for labels to keep daily charts clean
- Use "Current Only" in opening range to show only active session
- Enable statistics tables to track session performance over time
- Use session extension for Asia session to properly handle midnight crossover
Attribution
This indicator uses the following community libraries:
- boitoki/AwesomeColor/9 (color utilities)
- boitoki/Utilities/11 (utility functions)
All enhancements and features are original implementations.
Support
For questions or issues, please contact me @thirudinesh through TradingView.
---
© 2025 thirudinesh

Vault FX Time + Price Indicator v1Collection of tools for analysis:
- Midnight Open Horizontal Price Line
- 09:30 Open Horizontal Price Line
- Midnight and 09:30 Vertical Price Lines
- NWOG painter
- Asia Range Box
- Asia Range H/L lines (Lines extend until purged or 10:00 AM NY, whichever occurs first)
- Asia Range Standard Deviation Levels (Customizable)
- Day Separators
- PDH/PDL | PWH/PWL | PMH/PML Lines w/ Alerts
- First Presented FVG for NY-AM Session (1min Chart)
- Timeframe Specific Swing High/Low Sweeps w/ Alerts (Requires user setup)
Some features are still being tested, let me know if you find any bugs!

SW's Asia/London H/L'sAccurate Asia and London (with other session) High's and Low's. As well as NY Pre-market and opening bell, and end of day vertical lines. Also created 4 slots in UI to be able to set specific vertical lines with custom label options.
Sessions Highs/LowsThis indicator plots the High and Low of the three main trading sessions:
Asia (20:00–03:00) – green lines
London (03:00–08:00) – blue lines
New York (08:00–13:00) – red lines
Features:
Levels update in real time during each session.
When a new session starts, the previous lines are deleted – only the latest active sessions remain visible.
Default session times are set to Asia (20:00–03:00), London (03:00–08:00), and New York (08:00–13:00), but you can adjust them to your own custom hours in the settings.
Colors can also be customized.
Use cases:
Quickly visualize session ranges.
Track session highs/lows for breakouts, fakeouts, and reactions around liquidity zones.

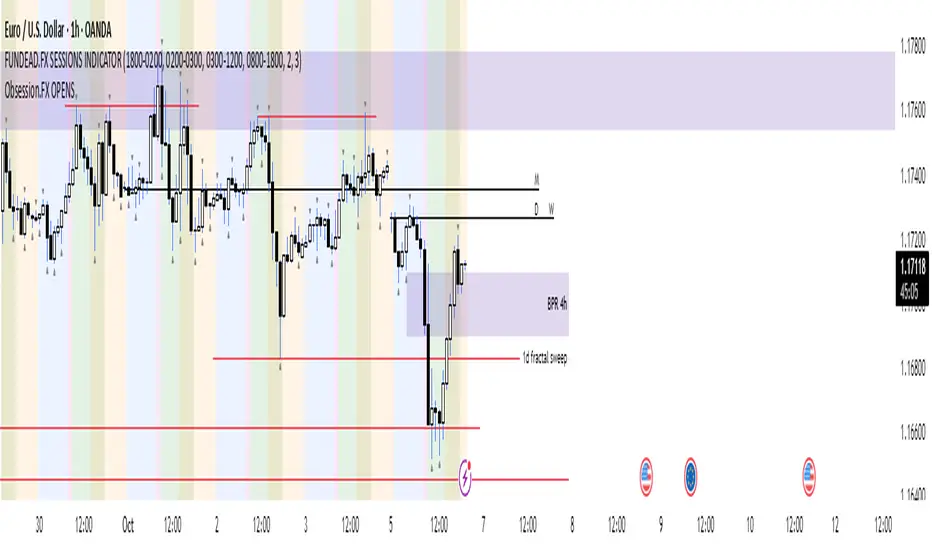
Obsession.FX Sessions IndicatorSession & Fractal Structure Tool — for Market Phases and Microstructure Analysis
This script combines session timeframes with local fractal identification to help traders analyze market context and structural shifts. It is designed for those applying Smart Money Concepts, where precise session boundaries and reactions to key levels are critical.
Session Zones
The script visualizes the three main trading sessions: Asia, London, and New York. It helps to:
– identify active phases of market participation;
– track each session’s Highs and Lows;
– interpret price behavior in relation to intraday liquidity shifts.
Each session is fully customizable — including start/end time, background and border colors, and display style (box, high/low lines, filled zones).
Fractal Structure
Fractals are shown as local highs and lows, supporting:
– detection of BOS/CHOCH on lower timeframes;
– building A→B ranges for structural flow;
– confirming short-term directional changes.
The fractal algorithm is optimized for responsiveness and clarity, with no repainting and minimal delay.
Purpose and Usage
This tool is intended for contextual reading of price action: determining the active session and monitoring price behavior within its boundaries, with a focus on microstructural reactions. It supports building precise entry logic based on the interaction between session ranges and fractal structure.
Closed Source Justification
The script is closed-source due to its use of proprietary logic for fractal detection and session integration, developed as part of a private trading methodology not available in public libraries.
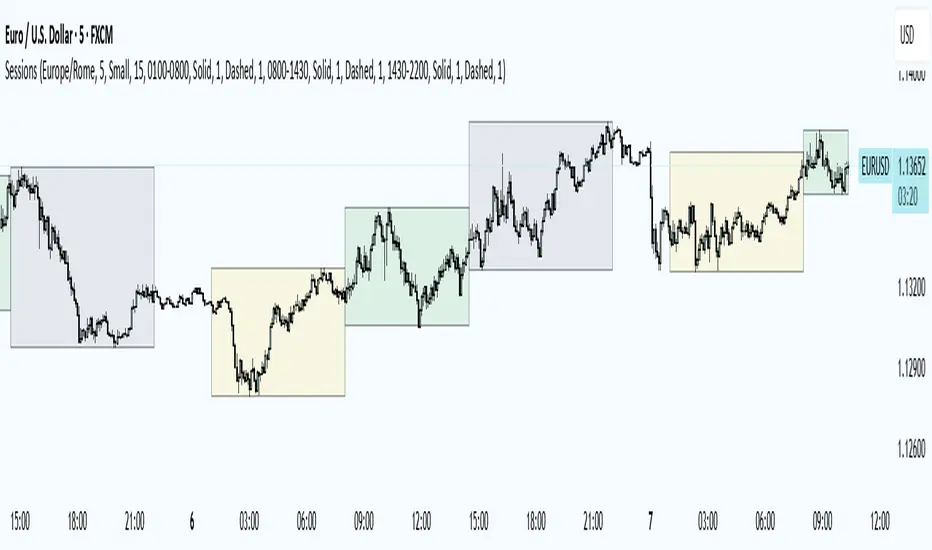
Trading Sessions
Trading Sessions
Highlights the Asia, London, and New York trading sessions with dynamic High-Low boxes.
General
Timezone : select your reference zone (e.g. Exchange, UTC, Europe/Rome, America/New_York).
Extend Session High/Low : extend the High/Low lines to the last candle.
Extend Lines (bars) : number of bars to extend lines beyond the last candle (0–100, default 15).
Show High/Low Labels : display labels for the High/Low levels.
Show Mitigated Levels : also show mitigated (broken) levels.
Show Only Recent Levels : filter levels from the last N days.
Number of Recent Days : sets how many days are considered “recent” (1–30).
Show Debug Info : enable a panel with current time, session status, and active filters.
Sessions
Asia , London , New York : enable or disable each session.
Session Time : set the start/end times with the time picker.
Box Color : choose a semi-transparent highlight color for each session.
Line Style & Width : customize style (Solid, Dotted, Dashed) and width of current and past High/Low lines.
Text Size : select the label text size (Tiny, Small, Normal, Large).
Show Only Recent Levels – filters High/Low lines to show only those from the last Number of Recent Days .
Number of Recent Days – sets how many days are considered “recent” for the filter.
Show Mitigated Levels – enables display of broken levels; otherwise only active levels remain visible.
Show High/Low Labels – toggles text labels at the ends of lines on or off.
Show Debug Info – displays a floating panel showing:
Current time in the selected timezone
On/Off status of Asia, London, NY sessions
Active filters (recent days, mitigated levels)
Line style settings for each session
Key Benefits
Visualize session-specific volatility and potential breakouts.
No historical limit: scroll back through any past sessions.
Filter and extend High/Low levels for precise price context.
Fully customize to fit any chart layout.
Ideal For
Intraday traders who need clear session boundaries and price level context.
London Judas Swing Indicator by PoorTomTradingThis indicator is designed to help people identify and trade the London Judas Swing by Inner Circle Trader (ICT).
UPDATES IN V2:
This is a v2 update with automatic timezone settings, there is no longer any need to adjust the time or offset for DST.
It will now also work on any chart that trades during the Asia and London sessions (20:00 - 05:00 NY Time), including crypto.
It is recommended to use this indicator on the 5 minute timeframe.
INTRODUCTION OF KEY CONCEPTS:
Swing Points are a candle patterns defining highs and lows, these are explained further down in the description in more detail. They are shown on the indicator by arrows above and below candles. They can be removed if you wish by turning their opacity to 0% in settings. Swing points are automatically removed when price trades beyond them (above swing highs, below swing lows).
The Asia Session can be set by the user, but is defined by default as 20:00 - 00:00 NY time. Lines are drawn at the high and low of the Asia Session and the Asian Range is set at midnight.
The London Session is defined as 02:00 - 05:00 NY time.
The user can also include the pre-London session (00:00 - 02:00) for detection of breakouts and Market Structure Breaks (MSBs - explained lower down in the description with examples). This is selected by default.
EXPLANATION OF INDICATOR:
During the London Session, the indicator will wait for a break of either the high or low of the Asian Range.
When this is detected, it will draw a dashed line where the breakout occurred and trigger an alert.
After the break of the Asian Range, the indicator will look for an MSB in the opposite direction, which is when price closes beyond a swing point opposing current price direction. The indicator will draw a line indicating the MSB point and trigger an alert.
Finally, the indicator will also trigger an alert when price returns to this MSB level, which is the most simple Judas Swing entry method.
The Judas swing
Example with chart for Judas Swing short setups -
Price breaks above the Asia High, no candle close is required, the indicator will then wait for price to close a candle below the last swing low.
A swing low is defined as a 3 candle pattern, with two candles on either side of the middle one having higher lows. When a candle closes below the middle candle's low, that is an MSB.
When price returns to the MSB point, the Take Profit and Stop Loss levels will appear.
When price goes to either the Stop Loss or Take Profit level, the MSB, TP and SL, lines will be removed.
After this, if price creates a new setup in the opposite direction, the indicator will also work for this, as shown in this example that occurred right after the first example
SETTINGS:
- The "Swing Point strength" can be adjusted in the settings.
Example:
For a swing low:
The default setting is 1 (one candle on each side of a middle candle has a higher low).
You can change this setting to 2, for a 5 candle pattern (two candles on each side of the middle candle have higher lows).
This can be changed to a maximum of 10. But only 1 or 2 is recommended especially on the 5 minute chart.
- ATR Length and Triangle Distance Multiplier settings are for adjusting how the swing point symbols appear on the chart.
This is to ensure triangles are not drawn over candles when price gets volatile.
The default setting is ideal for almost all market conditions, but you can play around with it to adjust to your liking.
- Alerts.
For alerts to be triggered, they must first be selected in settings.
Then you need to go on to the chart and right-click on an element of the indicator (such as the swing point symbols) and select "add alert on PTT-LJS-v2".
If after this, you change any settings on the indicator such as session times or pre-London session, you must add the alert again, and delete the old one if you wish.

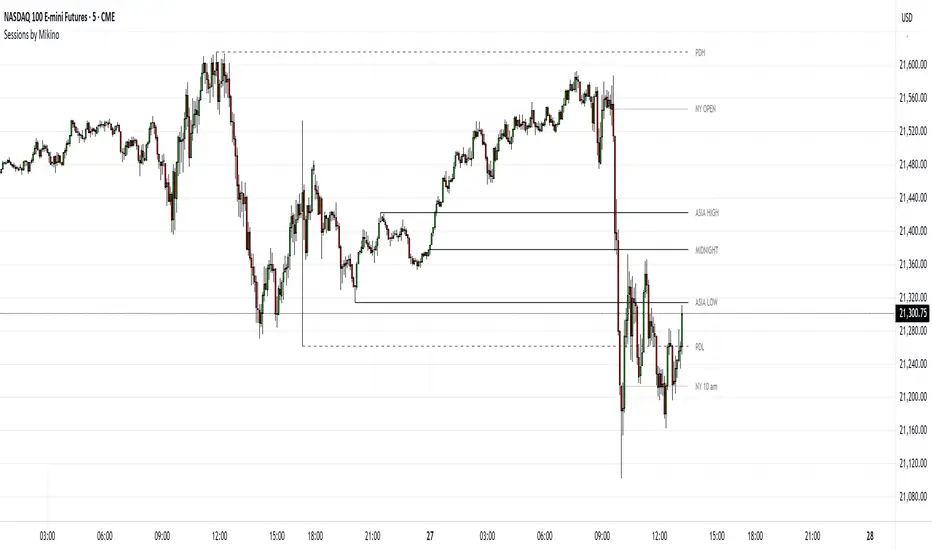
Sessions by MikinoAn indicator that draws lines from major price levels, made especially for NQ, ES and YM futures.
Features
• Show and hide any lines you want and don't need individually
• Customize how far the lines and labels are drawn (in bar length)
• Change label text, color, width and line type of any line drawn
Price levels (in NY time)
• "Show session open" - price at the beginning of the session at 6:00 PM
• "Show Asia open" - price at 8:00 PM
• "Show Asia high" - highest price during Asia session from 8 PM - midnight
• "Show Asia low" - lowest price during Asia session from 8 PM - midnight
• "Show London open" - price at 3:00/4:00 AM (depending on daylight savings time), at the start of London session
• "Show London high" - highest price during London session from 3:00/4:00 AM - 5:00/6:00 AM
• "Show Asia low" - lowest price during London session from 3:00/4:00 AM - 5:00/6:00 AM
• "Show midnight open" - price at midnight
• "Show New York open" - price at 9:30 AM
• "Show New York 10 am" - price at 10:00 AM (10 AM reversal)
• "Show previous day high" - highest price during yesterdays session (from 6:00 PM until 6:00 PM)
• "Show previous day low" - lowest price during yesterdays session (from 6:00 PM until 6:00 PM)
Limitations
All of the lines/labels will be drawn on the chart on up to hourly chart, with the exemption of PDH/PDL that can be drawn on up to 4 hour chart. PDH/PDL tracks each trading day from from 6:00 PM until 6:00 PM, Asia range from 8:00 PM until midnight, London from 3:00 AM until 05:00 AM. The indicator will work on different indices other than NQ, ES and YM, but some of the features might not work correctly due to what is considered a trading day.
Overnight Positioning w EMA - Strategy [presentTrading]I've recently started researching Market Timing strategies, and it’s proving to be quite an interesting area of study. The idea of predicting optimal times to enter and exit the market, based on historical data and various indicators, brings a dynamic edge to trading. Additionally, it is integrated with the 3commas bot for automated trade execution.
I'm still working on it. Welcome to share your point of view.
█ Introduction and How it is Different
The "Overnight Positioning with EMA " is designed to capitalize on market inefficiencies during the overnight trading period. This strategy takes a position shortly before the market closes and exits shortly after it opens the following day. What sets this strategy apart is the integration of an optional Exponential Moving Average (EMA) filter, which ensures that trades are aligned with the underlying trend. The strategy provides flexibility by allowing users to select between different global market sessions, such as the US, Asia, and Europe.
It is integrated with the 3commas bot for automated trade execution and has a built-in mechanism to avoid holding positions over the weekend by force-closing positions on Fridays before the market closes.
BTCUSD 20 mins Performance
█ Strategy, How it Works: Detailed Explanation
The core logic of this strategy is simple: enter trades before market close and exit them after market open, taking advantage of potential price movements during the overnight period. Here’s how it works in more detail:
🔶 Market Timing
The strategy determines the local market open and close times based on the selected market (US, Asia, Europe) and adjusts entry and exit points accordingly. The entry is triggered a specific number of minutes before market close, and the exit is triggered a specific number of minutes after market open.
🔶 EMA Filter
The strategy includes an optional EMA filter to help ensure that trades are taken in the direction of the prevailing trend. The EMA is calculated over a user-defined timeframe and length. The entry is only allowed if the closing price is above the EMA (for long positions), which helps to filter out trades that might go against the trend.
The EMA formula:
```
EMA(t) = +
```
Where:
- EMA(t) is the current EMA value
- Close(t) is the current closing price
- n is the length of the EMA
- EMA(t-1) is the previous period's EMA value
🔶 Entry Logic
The strategy monitors the market time in the selected timezone. Once the current time reaches the defined entry period (e.g., 20 minutes before market close), and the EMA condition is satisfied, a long position is entered.
- Entry time calculation:
```
entryTime = marketCloseTime - entryMinutesBeforeClose * 60 * 1000
```
🔶 Exit Logic
Exits are triggered based on a specified time after the market opens. The strategy checks if the current time is within the defined exit period (e.g., 20 minutes after market open) and closes any open long positions.
- Exit time calculation:
exitTime = marketOpenTime + exitMinutesAfterOpen * 60 * 1000
🔶 Force Close on Fridays
To avoid the risk of holding positions over the weekend, the strategy force-closes any open positions 5 minutes before the market close on Fridays.
- Force close logic:
isFriday = (dayofweek(currentTime, marketTimezone) == dayofweek.friday)
█ Trade Direction
This strategy is designed exclusively for long trades. It enters a long position before market close and exits the position after market open. There is no shorting involved in this strategy, and it focuses on capturing upward momentum during the overnight session.
█ Usage
This strategy is suitable for traders who want to take advantage of price movements that occur during the overnight period without holding positions for extended periods. It automates entry and exit times, ensuring that trades are placed at the appropriate times based on the market session selected by the user. The 3commas bot integration also allows for automated execution, making it ideal for traders who wish to set it and forget it. The strategy is flexible enough to work across various global markets, depending on the trader's preference.
█ Default Settings
1. entryMinutesBeforeClose (Default = 20 minutes):
This setting determines how many minutes before the market close the strategy will enter a long position. A shorter duration could mean missing out on potential movements, while a longer duration could expose the position to greater price fluctuations before the market closes.
2. exitMinutesAfterOpen (Default = 20 minutes):
This setting controls how many minutes after the market opens the position will be exited. A shorter exit time minimizes exposure to market volatility at the open, while a longer exit time could capture more of the overnight price movement.
3. emaLength (Default = 100):
The length of the EMA affects how the strategy filters trades. A shorter EMA (e.g., 50) reacts more quickly to price changes, allowing more frequent entries, while a longer EMA (e.g., 200) smooths out price action and only allows entries when there is a stronger underlying trend.
The effect of using a longer EMA (e.g., 200) would be:
```
EMA(t) = +
```
4. emaTimeframe (Default = 240):
This is the timeframe used for calculating the EMA. A higher timeframe (e.g., 360) would base entries on longer-term trends, while a shorter timeframe (e.g., 60) would respond more quickly to price movements, potentially allowing more frequent trades.
5. useEMA (Default = true):
This toggle enables or disables the EMA filter. When enabled, trades are only taken when the price is above the EMA. Disabling the EMA allows the strategy to enter trades without any trend validation, which could increase the number of trades but also increase risk.
6. Market Selection (Default = US):
This setting determines which global market's open and close times the strategy will use. The selection of the market affects the timing of entries and exits and should be chosen based on the user's preference or geographic focus.

E9 ASIA Session
*note: Upon updating the script the conversion from V4 to v5 has lost the weekend extended lines and now prints an asia session for each day. It is recommended (esp for crypto) to extend these lines across the weekend like in the chart example above.
The E9 Asia Session Indicator is a valuable tool for traders aiming to track and analyze the Asia trading session on financial charts. This indicator provides insights into price behavior during the Asia session, which is crucial for making informed trading decisions. Here's an overview of its key functionalities and uses:
1. Session Highs and Lows
Purpose:
The indicator calculates and plots the high and low of the Asia session.
It helps identify key levels of support and resistance established during this trading period.
Importance:
These levels can act as significant reference points for future price movements.
Price action that occurs near these levels often provides clues about potential breakouts or reversals.
2. Session Background Color
Purpose:
The indicator can shade the background of the chart during the Asia session.
Importance:
This visual cue helps quickly identify the session's timeframe, enhancing the trader’s ability to observe price behavior within this specific period.
It aids in distinguishing between different trading sessions and understanding their influence on price action.
3. Start of Session Marker
Purpose:
A visual marker (such as a circle) is plotted at the beginning of each Asia session.
Importance:
This marker helps traders visually pinpoint the start of the session, making it easier to analyze how the price reacts from the session's opening.
4. End of Session Marker
Purpose:
A marker is plotted at the end of the Asia session, indicating where the session closes.
Importance:
This marker is useful for tracking the end of the session and observing price behavior around this critical juncture.
It helps in analyzing whether the session's high or low gets revisited or broken in subsequent sessions.
Practical Uses:
Strategic Planning: Traders can use the plotted high and low levels to set their trading strategies, stop-loss orders, and profit targets.
Market Analysis: Understanding how price interacts with the Asia session’s high and low levels can provide insights into market sentiment and potential price movements.
By incorporating the E9 Asia Session Indicator into your trading toolkit, you can gain a deeper understanding of the Asia session's impact on price dynamics, enhancing your overall trading strategy and decision-making process.
Disclaimer: The information contained in this article does not constitute financial advice or a solicitation to buy or sell any securities. All investments involve risk, and past performance does not guarantee future results. Always evaluate your financial circumstances and investment objectives before making trading decisions.
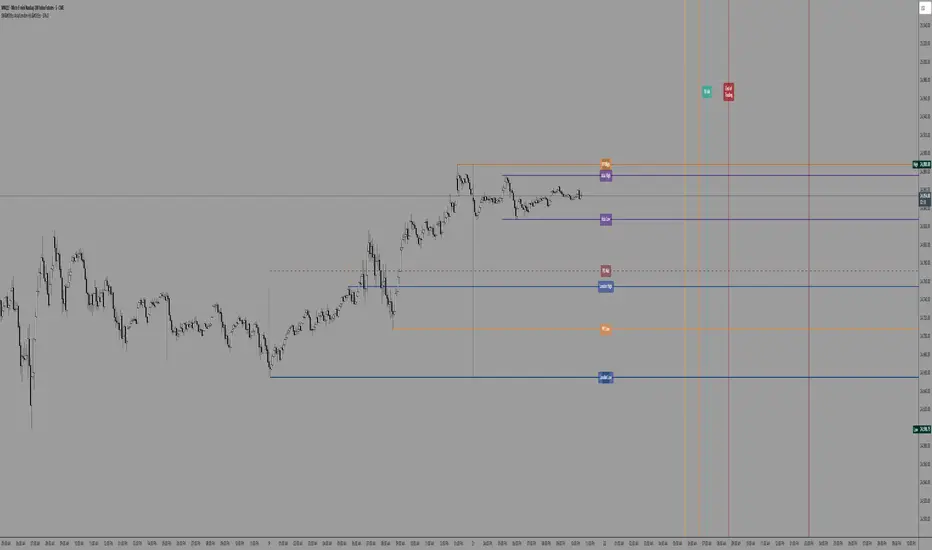
itradesize /\ Previous Liquidity x ICTI’d like to introduce a clean and simple RTH gap and liquidity levels indicator with additional Asian and London ranges, along with standard deviation levels and many customizable options.
Previous D/W/M highs and lows are areas where liquidity tends to accumulate. This is because many traders place stop-loss orders around these levels, creating a concentration of buy stops above the previous day's high and sell stops below the previous day's low. High-frequency trading algorithms and institutional traders often target these areas to capture liquidity.
What the indicator could show in summary?
- Regular trading hours gap with deviations
- Asia with deviations (lines or boxes)
- London with deviations (lines or boxes)
- Weekdays on chart
- 3 AM candle marker
- Previous D/W/M levels
- Important opening times (08:00, 09:30, 10:00, 14:00, 00:00, 18:00)
- Daily separators
By marking out the previous day's highs and lows, traders can create a framework for their trading day. This helps in identifying potential setups and understanding where significant price action might occur. It also aids in filtering out noise and focusing on the most relevant price levels.
These levels can also act as potential reversal points. When the market reaches a previous high or low, it might reverse direction, especially if it has raided the liquidity resting there. This concept is part of a strategy where traders look for the market to raid these levels and then reverse, providing trading opportunities
The indicator shows previous liquidity levels on a daily, weekly, and monthly basis. It also displays opening times at 8:30, 9:30-10:00, 14:00-00:00, and 18:00. Opening times are crucial in trading because they help define specific periods when market activity is expected to be higher, which can lead to better trading opportunities. The script has been made mostly for indices.
You can create various entry and exit strategies based on the indicator. Please remember, that adequate knowledge of ICT is necessary for this to be beneficial.
You might wonder why only these times are shown. This is because these are the times when the futures market is active or should be active. It's important to note that opening times can vary between different asset classes.
18:00 A new daily candle open
00:00 Midnight open
02:00 New 4-hour candle open
08:30 High-impact news
09:30 NY Equities open
10:00 New 4-hour candle open
The concept of "Asian Killzone Standard Deviations" involves using the Asian trading session's price range to project potential price movements during subsequent trading sessions, such as the London or New York sessions. This is done by calculating standard deviations from the Asian range, which can help traders identify potential support and resistance levels.
You can create a complete model by exclusively focusing on the Asian time zone. Deviations within this zone may have varying impacts on future price movements, and the Interbank Price Delivery Agreement (IPDA) often reflects Asia's high, close, and low prices.
A similar approach can be taken with the London time zone. The standard deviation levels within each zone could potentially serve as support or indicate reversals, including liquidity hunts. It's important to backtest these ideas to gain reliable insights into when and where to apply them.
* Asian Range: This is the price range established during the Asian trading session. It serves as a reference point for calculating standard deviations.
* London Range: The same applies to the London range as well. Combine standard deviation projections with other technical analysis tools, such as order blocks or fair value gaps, to enhance accuracy.
* Standard Deviations: These are statistical measures that indicate the amount of variation or dispersion from the average. In trading, they are used to project potential price levels beyond the current range.
You can also use regular trading hours gap as a standalone model. The 4 STDV and 2.5 STDV levels are important for determining the high or low of the current price action.
The RTH gap is created when there is a difference between the closing price of a market at the end of one trading day and the opening price at the start of the next trading day. This gap can be upward (gap higher), downward (gap lower), or unchanged. It is significant because it often indicates market sentiment and can create inefficiencies that traders look to exploit.
Alternatively, you can combine these elements to create a complete strategy for different scenarios.
B A N K $ - Advanced Session RangesThis is a simple indicator that has been designed to aid intraday trading and has a few components;
Key Features
Session Ranges + Optimal Exit Time
Asia Pip Range
New York Midnight Open Line
Session Ranges + Optimal Exit Time
Information ℹ️
This is a visual depiction of the 3 main sessions in the markets. Asia, London & New York. The default timings are set to perfectly align with each session however the Start & End times for each session can be changed in the settings. (I've added a website on the tooltip to easily convert timezones)
I have also added a 4th session range called "Optimal Exit Time". This is statistically the most probable time window for the opposite High / Low of Day to form is within this window. It helps the trader understand when they should look to take profit.
How It Works 🔑
The indicator automatically maps on two lines for the High & Low of the range between the selected Start & End time, it also colours the background.
The individual lines & background can be toggled & customised to the traders preference.
Asia Pip Range
Information ℹ️
This displays the Asia Range in pips beneath the Asia Session Low.
How It Works 🔑
This calculates the distance between the Asia High - Asia Low in pips. It will automatically recalibrate to the timings the trader sets in the settings if they change the Start / End.
New York Midnight Open Line
Information ℹ️
This helps look for Buys beneath the line for a Bullish Expansion day 📈 & Sells above the line for a Bearish Expansion day 📉
How It Works 🔑
This adds a horizontal line to the chart that is anchored to New York Midnight Open (00:00) by default. It can be changed in the settings in required. You can also toggle on the time being shown above the line.

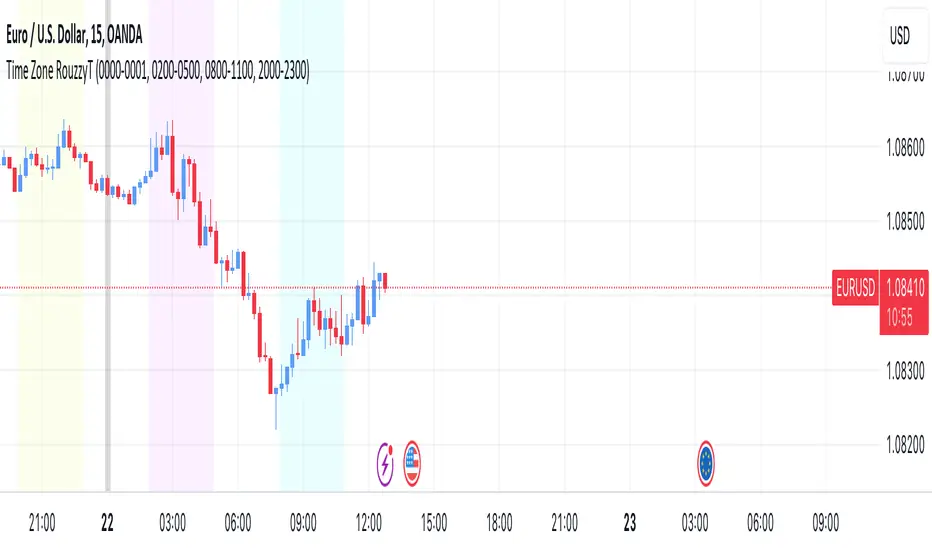
Time Zone RouzzyTNYC , London & Asia section
Each time-zone has a different color to be able to distinguish which section we are in at the moment.
These sessions have been identified to operate the EURUSD, apart from that it also works with the DXY.
London is identified with the color light purple.
NYC is identified with the color turquoise blue.
Asia is identified with the color yellow.
The beginnings of each Day are identified with the color gray.
London is from 2am to 5am
NYC from 8am to 11am
Asia from 8pm to 11pm
OANDA:EURUSD
FX:EURUSD
TVC:DXY
Range Deviations @joshuuuThis indicator is able to show ranges, the equlibrium (50%) and range deviations.
It has four pre-defined options and one custom version.
Asia (2000-0000) ny time
CBDR(1400-2000) ny time
Flout(1400-0000) ny time
ONS (OverNightSession)(0400-0800) chicago time
Custom (you can choose the times)
ICT (Inner Circle Traders) teaches, that those range deviations of asia,cbdr,flout can be used to find the daily high/low.
TCM (The Currency Merchant) teaches, that a move out of the range often is a false move to trap traders into the wrong direction.

BTC Europe-America-Asia market backgrounds - 1h max frameMarket indicator - Europe - America - Asia.
Based on my trading experience. Therefore, time zones are of different sizes.
Hotch SessionSimple Session timer with separate session for Asia, Europe, and the Americas plus an extra custom session timer. each can be turned on and off separately.
The indicator also plots the highs and lows of each session.
This code was modified from the Session timer code found in the original "The Arty" by PheonixBinary but expanded to better include all trading sessions.
The code was written in a manner to be as compact as possible. I had looked at many other Session timers and found entire input sections that were longer than the entirety of this indicator.
Please feel free to use this code in any manner you choose permission not required.

ICT Session Killzone Boxes & DeviationsICT Killzone Sessions Boxes & Deviations is a convenience indicator that marks out past and future ICT killzones for Asia, London, and New York, London Close and CBDR.
The boxes highlights the highest and lowest candle opens of that session/killzone, which is what the deviations are based on. Two lines mark out the highest high and lowest low of that session.
This indicator also includes New York midnight opening price and a vertical divider showing you that time.
Future killzones are also marked out.
All times are set to GMT-4 so these boxes should work across most exchanges. Times and code can be changed if a few don't match up.
Included are week of day labels for your convenience.
For those who are unfamiliar, ICT Killzones are optimal times to look for trades during or before a session, often providing entry for trades with orderblock tests, FVG fills or stophunts.
Please note: This indicator only works well on 1HR timeframe and below. The default max timeframe setting is set to 15min, which can be changed in the menu.
There may be some bugs so please highlight anything you find in the comments below :)
Shout out to @Ryazn for all the ideas!
AltSessionHello World
It’s no secret that trading sessions play a massive role in market movement and liquidity. We can clearly see in the image about how important identifying international trading hours are for a trader.
The Asian session starts around 1am GMT and often has a bearish bias through this session lasting for a few hours, after which Frankfurt and London traders start to come online and can often reverse the Asian sentiment.
The London session is the best session to trade traditionally starting around 7am GMT before the American traders come online and reverse market once again.
We have designed this indicator to help identify different trading hours easily with a background shade on the chart and also high/lows of the training session, as these levels can often be revisited.
We hope you find this indicator useful and please feel free to drop a comment if you have any updates you wish to be made or any future indicator script ideas, thank you.

[astropark] Kill ZonesDear Followers,
today I'm glad to present you an indicator which highlights for you the most important market Kill Zones .
This indicator will color background of the time sessions when Asia, London and New York sessions are going to be most active .
This way you can understand easier what istitutions and big hedge funds made during the session.
You can change colors and transparency in the indicator options, default colors are yellow for Asia, blue for London and red for New York sessions.
You can enable the indicator to show background also during the weekend (disabled by default).
This indicator works on all markets, I suggest not to use it above 1h timeframe, 5m-15m is great.
This is a premium indicator , so send me a private message in order to get access to this script.
