UK Asian Range (00:00-06:00) [TZ]UK Asian Range (00:00–06:00) is a session-range overlay indicator built for traders who use the Asian session range as a key liquidity reference for the Frankfurt and London opens. It automatically measures the highest high and lowest low formed during a user-defined “Asia session” window (default 00:00–06:00) and draws that range on the chart as a clean, persistent shaded area.
The goal is simple: make it easy to see where overnight liquidity formed, so you can judge whether price is:
Breaking cleanly out of the Asian range,
Sweeping above/below the range to grab liquidity and reversing,
Respecting the range boundaries as support/resistance as Europe comes online.
What it does
For each trading day, the script:
Detects the start of the selected Asia session window (default 00:00).
Tracks price throughout that window and continuously updates:
Asia High = highest price printed during the session
Asia Low = lowest price printed during the session
At the moment the session ends (default 06:00), it finalizes the range and draws:
A shaded Asia range area that remains on the chart,
An “Asian Range” label placed above the area,
A clean “session area” border style with no right-side edge (so it looks open and unobtrusive rather than like a fully closed box).
Repeats the process daily and keeps a configurable number of past ranges visible for context.
How it works (concept and calculation method)
The script uses session-time detection to determine whether each bar belongs to the Asia session. While the bar is inside the session window, the range is updated using simple, transparent logic:
AsiaHigh = max(AsiaHigh, bar high)
AsiaLow = min(AsiaLow, bar low)
Once the first bar outside the session appears, the session is considered complete and the script “prints” the finalized range objects. Each day’s completed range is stored and preserved so you can compare how later price action interacts with prior Asian ranges over time.
Why the Time zone input matters
Different instruments and brokers can display different “day” boundaries and session timestamps (especially when comparing indices, metals, and FX). This script includes an explicit Time zone input (default Europe/London) so your Asia range window means the same thing across symbols.
In practical terms, it reduces the common frustration where a session box aligns perfectly on one market (e.g., Gold or DAX) but appears shifted on another (e.g., GBPJPY). With the Time zone setting, 00:00–06:00 is always evaluated in the time zone you choose, rather than drifting based on symbol/exchange time settings.
How to use it
Add the indicator to your chart.
Set Time zone to your preferred reference time zone (commonly Europe/London for UK-based traders).
Keep the session at 00:00–06:00 or adjust it to your own Asia definition.
Use the Asia range as a structure tool:
Watch for sweeps above the Asia high or below the Asia low into Frankfurt/London.
Treat the boundaries as potential liquidity targets and support/resistance zones.
Compare current reactions to prior days’ ranges to build pattern recognition.
Inputs included
Time zone: the time zone used to interpret the session times.
Asia Session (HHMM–HHMM): session window (default 00:00–06:00).
Show range area (filled) and styling controls (fill and border width/colour).
Optional Mid line.
Keep last N days: how many historical Asia ranges to keep on screen.
Acknowledgment / Inspiration
This indicator was inspired by the widely used “Asian range box” session concept on Trading View, with a nod to nico948 for popularizing that workflow for many traders. This script is an original implementation built to solve a practical usability issue: adding an explicit time zone selector so the same 00:00–06:00 Asia range aligns consistently across different symbols (indices, metals, and FX) without the need to manually realign session timing.
Notes
This is a visual framework tool. It does not place trades or provide buy/sell signals by itself; it provides a consistent session reference so you can apply your own sweep, reversal, or breakout approach with clear context.
Asian

Kairos AR EdgeEN
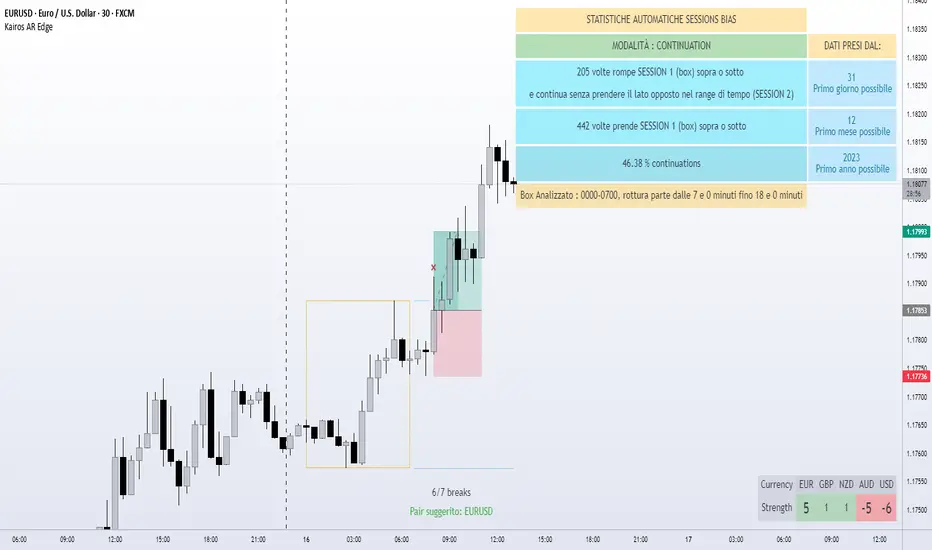
Kairos AR Edge is a closed-source (invite-only) Forex indicator providing statistical analysis of Asian session box breakouts and relative currency strength across 28 major pairs. Unlike standard breakout or trend-following tools, it consolidates breakout behavior into a single overview, helping traders quickly identify directional bias and strong/weak currencies. This aggregation provides unique insight not easily obtained from separate pair analysis.
Important Clarification:
Reversal and Continuation percentages are calculated for the pair on which the indicator is applied , showing how often a breakout returns (Reversal) or continues (Continuation) within the selected session window.
The Currency Strength Table is independent of these percentages. It scores each currency from -7 to +7 based on participation in Asian box breakouts across all 28 pairs, providing a relative strength overview regardless of the active pair.
The -7/+7 scale is derived from historical breakout occurrences and provides a quick reference for currency strength ranking
Indicator operates on two levels:
Session Bias Statistics: Builds an Asian session box for the active pair and analyzes breakout behavior. Users can select:
Reversal Mode : Percentage of breakouts that return to the opposite side within the selected timeframe
Continuation Mode : Percentage of breakouts that continue in the same direction within the timeframe
Currency Strength Table: Aggregates breakout behavior across all 28 pairs to provide a relative currency strength score (-7 to +7)
Visual Tools: Optional pivot-based bullish/bearish triggers and automatic session box visualization provide additional informational support.
Main Features:
Customizable Asian session box (start/end times and timezone)
Reversal or Continuation statistical mode
Automatic update of high/low levels
Currency Strength Table (-7 to +7)
Statistical table with historical breakout percentages
Optional visual triggers (pivot-based patterns)
Light/Dark theme support
Originality and Value:
Consolidates 28 pairs into a single view for immediate identification of market bias
Provides statistical insight into breakout behavior, not just trend-following or generic breakout alerts
Offers a quick-reference Currency Strength Table to identify strong/weak currencies without tracking multiple pairs individually
Important Notes:
Statistics are based on historical data only – no guarantee of future results
Educational and informational purposes only; not financial or trading advice
Closed-source indicator with invite-only access. Access requests can be made by contacting the author or following the link in the Author’s Instructions field
IT
Kairos AR Edge è un indicatore closed-source (invite-only) che fornisce analisi statistica sulle rotture del box della sessione asiatica e forza relativa delle valute su 28 coppie principali. A differenza dei normali strumenti di breakout o trend-following, consolida il comportamento dei breakout in un’unica panoramica, aiutando i trader a identificare rapidamente bias direzionali e valute forti/deboli. Questa aggregazione offre insight unici non facilmente ottenibili analizzando coppie singole.
Chiarimento importante:
Le percentuali di Reversal e Continuation si riferiscono solo alla coppia su cui l’indicatore è applicato , calcolando quante volte una rottura ritorna (Reversal) o continua (Continuation) entro la finestra di sessione selezionata.
La Tabella di Forza Valute è indipendente da queste percentuali. Assegna a ciascuna valuta un punteggio da -7 a +7 in base alla partecipazione ai breakout del box asiatico su tutte le 28 coppie, fornendo un quadro della forza relativa indipendentemente dalla coppia attiva.
Il punteggio -7/+7 deriva dai breakout storici e fornisce un riferimento rapido per la forza delle valute.
Lo script opera su due livelli:
Statistiche Bias di Sessione: Costruisce il box della sessione asiatica per la coppia attiva e analizza i breakout. Modalità selezionabili:
Reversal : Percentuale di breakout che tornano verso il lato opposto entro la finestra temporale
Continuation : Percentuale di breakout che proseguono nella stessa direzione entro la finestra
Tabella di Forza Valute: Aggrega il comportamento dei breakout su tutte le 28 coppie, assegnando un punteggio da -7 a +7 per ciascuna valuta in base alla sua forza relativa
Strumenti Visivi: Box della sessione asiatica aggiornato automaticamente e trigger opzionali basati su pattern pivot, fornendo supporto informativo aggiuntivo.
Funzionalità principali:
Box della sessione asiatica personalizzabile (orari e timezone)
Modalità statistica: Reversal o Continuation
Aggiornamento automatico dei livelli high/low
Tabella di Forza Valute (-7 a +7)
Tabella statistica con percentuali di rottura storiche
Trigger visivi opzionali (pattern pivot)
Supporto tema chiaro/scuro
Originalità e Valore:
Consolida 28 coppie in un’unica panoramica per identificare immediatamente bias di mercato
Fornisce insight statistico sui breakout, non solo trend-following o alert generici
Tabella di Forza Valute rapida per identificare valute forti/deboli senza controllare molteplici coppie
Nota importante:
Le statistiche si basano solo su dati storici – nessuna garanzia di risultati futuri
Strumento educativo e informativo; non costituisce consiglio finanziario o di trading
Indicatore closed-source con accesso su invito. Le richieste di accesso possono essere fatte contattando l’autore o seguendo il link nelle istruzioni dell’autore
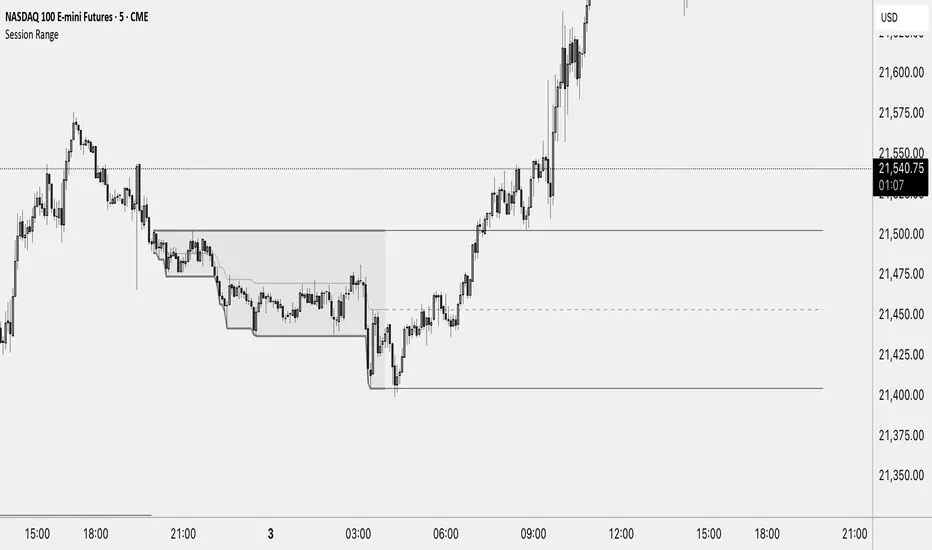
Session RangeThis Indicator Shows you the high, low and the midpoint for a chosen session and displays them on the chart.
You can make the following inputs:
Timezone: Choose your time zone (in UTC) to display the session correctly
Session Time: Choose the start time and end time of the session you want to have displayed.
Show Session Midpoint: Choose between displaying or not displaying the midpoint of the sessions high and low.
Extend Session Values until next Session: Choose this option if you want to display the sessions range until the next session starts. The midpoint will only be displayed if you chose "yes" at "Show Session Midpoint?"
Maximum number of bars between sessions: This is needed to ensure the correct display of the extended lines. Also this will affect the running speed of the script.
Limitations:
A higher number between bars slows down the script. What does that mean practically? If you choose to not have the sessions values displayed until the next session you can set this to 1 and the script will run as fast as it can. If you choose to display all the values until the next session you have to make sure that the number you put in is higher than the number of bars between the sessions. Otherwise the lines will be displayed backwards. As this affects the calculation speed you want to keep the number as low as possible. The default setting is 300 which is fine for 5 minute charts. On a 1 minute chart you will have to use something around 5000 depending on how long your session is.
Also the script will only run correctly if the start time of your session can be divided by the timeframe you are using. Example: you can use a 1min, 3min, 5min, or 15min chart on all sessions as they can only start every 15 minutes and 15 can be divided by all these numbers. A 2 minute timeframe will only work on sessions that start at minute 00 or 30, as 15 and 45 can not be divided by 2.
Customization and Alerts:
You can change the color of the sessions high, low, midpoint and background filling. The line style can also be changed but this might lead to a faulty display of the session.
The style of the extension lines can not be altered.
Alerts can be added for crossing the sessions high or low (after the session is finished). You do not have to display the extension lines in order to set an alert.
credit: The inspiration (especially for the look of this indicator) comes from the Asian Range by Nico948 indicator.
London ORB + Session High/Low + FVGLondon ORB + Session High/Low + FVG
📘 Script Description: London ORB + Session High/Low + Fair Value Gap
This script is designed to assist intraday traders during the London session open by combining:
🕒 1. Opening Range Breakout (ORB)
Captures the high and low of the first 15-minute candle after the London open (08:00–08:15 GMT).
Draws lines and labels for the ORB High and Low levels.
Detects breakouts above or below the ORB and plots a triangle signal at the breakout bar.
🌐 2. Asian & US Session Levels
Automatically marks the highs and lows of the Asian (00:00–06:00 GMT) and US (13:30–20:00 GMT) sessions.
Useful for identifying prior session liquidity zones, key support/resistance levels, and potential reaction areas.
📉 3. Fair Value Gaps (FVG)
Highlights imbalances in price action between non-overlapping candles (also known as FVGs or inefficiencies).
Draws a shaded box between candles where gaps exist:
Green for bullish FVGs
Red for bearish FVGs
🔔 4. Alert Support
Optional alerts are built in for:
Long breakout (price breaks above ORB)
Short breakout (price breaks below ORB)
🎯 Use Case
Perfect for:
Day traders looking to capitalize on early volatility at the London open
Traders using liquidity-based strategies, retests, or gap-fills
Visualizing and aligning with prior session highs/lows for structure and context

ICT Asian Range and KillzonesThis TradingView indicator highlights key trading sessions and their price ranges on a chart. It identifies the Asian Range and the Killzones for both the London Open and New York Open sessions. Here’s a brief breakdown:
Asian Range:
Defines the high and low price levels during the Asian trading session (between the specified start and end hours, default 00:00 to 04:00 UTC).
Plots horizontal lines to mark the highest and lowest prices reached during the Asian session.
Adds labels showing the values of these high and low points after the session ends.
London and New York Killzones:
Identifies the “Killzones” or key trading windows for the London Open (default 06:00 to 09:00 UTC) and the New York Open (default 11:00 to 14:00 UTC).
Tracks the high and low price levels within these windows and plots rectangles ("boxes") on the chart to visualize these ranges.
The boxes are color-coded and customizable, indicating potential areas of high market activity or volatility.
Customizable Visuals:
Users can adjust the colors, border widths, and other visual properties for better clarity and chart integration.

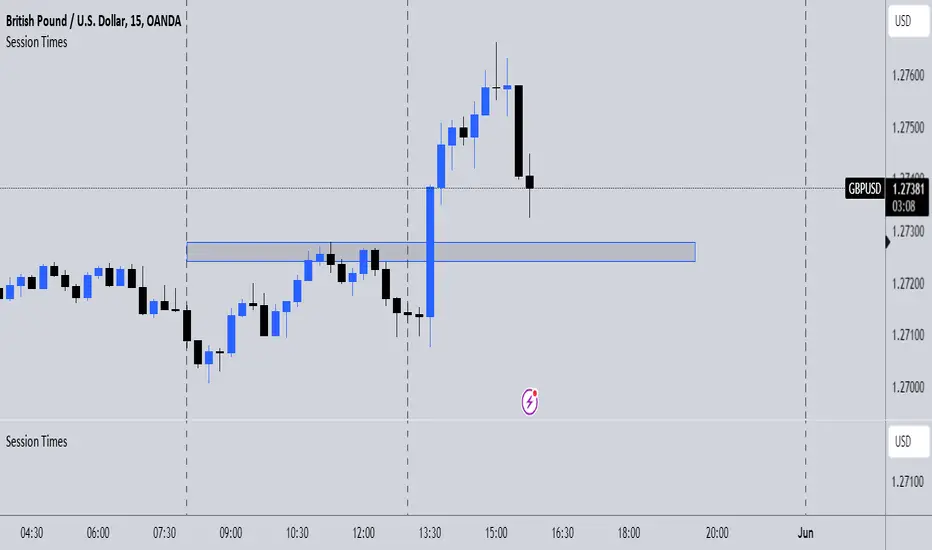
Session TimesDescription:
This indicator simply when enabled will draw dashed lines at each of the session openings. This is based on UTC+1 Time. There will be lines at 00:00 & 08:00 (Asian Session), lines at 08:00 & 13:00 (London Session) and finally lines at 13:00 & 00:00 (New York Session).
Potential Use:
There are many ways you could use this indicator to benefit your trading, but the best way I find is that it makes it clear where the previous highs and lows are of a session, which are potential areas you could trade off. Obviously, there are many other ways you can use this to help you.
How The Script Works:
The way the script works isn't too complicated as it is only a short script. Simply it firstly calculates what are the weekdays (Whenever it isn't Saturday or Sunday). Then from there simply finds the times which I mentioned above, and adds a vertical dashed line there.
Future Updates:
In the future I will mainly be looking to make the indicator more customisable. Firstly, I will look to make it so that the user can adjust the times that the lines are drawn at so it still works wherever you are in the world. I would also like to make it so the user can choose the colour of the lines. If you have any other additions you would like added to this, then feel free to message me.
All Forex Sessions in One Script OnlyDraws all Forex Sessions:
*it works only with forex*
These Sessions can show Daily Highs and Lows:
- Pre-London / London
- Pre-New York / New York
It's possible to hide Highs and Lows having full background for these sessions
Daily Session Breaks
- Mondays use a different color
- Asian Boxes every day
- All Sessions Ranges/Colors are editable
-All elements (pre-London/London/Pre-New York/New York/Asian Boxes/Session Breaks) can be switched off independently

Range Box (Nephew_Sam_)Version 1
Creates a box around a specified time range with the ability to extend the lines to a later time.
Next update:
- Background in box
- Remove historical boxes
- Extend lines in future instead of only till current price
There's similar but complex indicators out there, I'll leave this code as open source and you have permission to reuse and not credit me.

Levels (Nephew_Sam_)Initial Commit.
1. Plots Asian Range based on time provided
- option to extend line to end of day
- option to fill range with background
2. Plots significant highs/low using fractals
3. Plot Daily/Weekly/Monthly OHLC

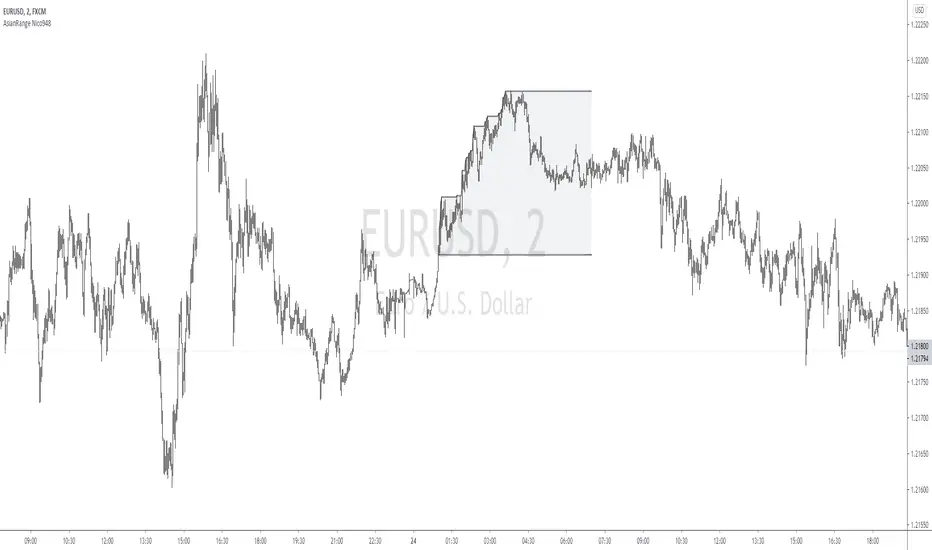
Asian Range by Nico948Displays the Asian session range on your graph.
Masked for timeframes higher than 15 minutes.
However, it can be displayed on 1 hour timeframe by filling in the relevant box in the parameters.
Black-Scholes Options Pricing ModelThis is an updated version of my "Black-Scholes Model and Greeks for European Options" indicator, that i previously published. I decided to make this updated version open-source, so people can tweak and improve it.
The Black-Scholes model is a mathematical model used for pricing options. From this model you can derive the theoretical fair value of an options contract. Additionally, you can derive various risk parameters called Greeks. This indicator includes three types of data: Theoretical Option Price (blue), the Greeks (green), and implied volatility (red); their values are presented in that order.
1) Theoretical Option Price:
This first value gives only the theoretical fair value of an option with a given strike based on the Black-Scholes framework. Remember this is a model and does not reflect actual option prices, just the theoretical price based on the Black-Scholes model and its parameters and assumptions.
2)Greeks (all of the Greeks included in this indicator are listed below):
a)Delta is the rate of change of the theoretical option price with respect to the change in the underlying's price. This can also be used to approximate the probability of your option expiring in the money. For example, if you have an option with a delta of 0.62, then it has about a 62% chance of expiring in-the-money. This number runs from 0 to 1 for Calls, and 0 to -1 for Puts.
b)Gamma is the rate of change of delta with respect to the change in the underlying's price.
c)Theta, aka "time decay", is the rate of change in the theoretical option price with respect to the change in time. Theta tells you how much an option will lose its value day by day.
d) Vega is the rate of change in the theoretical option price with respect to change in implied volatility .
e)Rho is the rate of change in the theoretical option price with respect to change in the risk-free rate. Rho is rarely used because it is the parameter that options are least effected by, it is more useful for longer term options, like LEAPs.
f)Vanna is the sensitivity of delta to changes in implied volatility . Vanna is useful for checking the effectiveness of delta-hedged and vega-hedged portfolios.
g)Charm, aka "delta decay", is the instantaneous rate of change of delta over time. Charm is useful for monitoring delta-hedged positions.
h)Vomma measures the sensitivity of vega to changes in implied volatility .
i)Veta measures the rate of change in vega with respect to time.
j)Vera measures the rate of change of rho with respect to implied volatility .
k)Speed measures the rate of change in gamma with respect to changes in the underlying's price. Speed can be used when evaluating delta-hedged and gamma hedged portfolios.
l)Zomma measures the rate of change in gamma with respect to changes in implied volatility . Zomma can be used to evaluate the effectiveness of a gamma-hedged portfolio.
m)Color, aka "gamma decay", measures the rate of change of gamma over time. This can also be used to evaluate the effectiveness of a gamma-hedged portfolio.
n)Ultima measures the rate of change in vomma with respect to implied volatility .
o)Probability of Touch, is not a Greek, but a metric that I included, which tells you the probability of price touching your strike price before expiry.
3) Implied Volatility:
This is the market's forecast of future volatility . Implied volatility is directionless, it cannot be used to forecast future direction. All it tells you is the forecast for future volatility.
How to use this indicator:
1st. Input the strike price of your option. If you input a strike that is more than 3 standard deviations away from the current price, the model will return a value of n/a.
2nd. Input the current risk-free rate.(Including this is optional, because the risk-free rate is so small, you can just leave this number at zero.)
3rd. Input the time until expiry. You can enter this in terms of days, hours, and minutes.
4th.Input the chart time frame you are using in terms of minutes. For example if you're using the 1min time frame input 1, 4 hr time frame input 480, daily time frame input 1440, etc.
5th. Pick what style of option you want data for, European Vanilla or Binary.
6th. Pick what type of option you want data for, Long Call or Long Put.
7th . Finally, pick which Greek you want displayed from the drop-down list.
*Remember the Option price presented, and the Greeks presented, are theoretical in nature, and not based upon actual option prices. Also, remember the Black-Scholes model is just a model based upon various parameters, it is not an actual representation of reality, only a theoretical one.
*Note 1. If you choose binary, only data for Long Binary Calls will be presented. All of the Greeks for Long Binary Calls are available, except for rho and vera because they are negligible.
*Note 2. Unlike vanilla european options, the delta of a binary option cannot be used to approximate the probability of the option expiring in-the-money. For binary options, if you want to approximate the probability of the binary option expiring in-the-money, use the price. The price of a binary option can be used to approximate its probability of expiring in-the-money. So if a binary option has a price of $40, then it has approximately a 40% chance of expiring in-the-money.
*Note 3. As time goes on you will have to update the expiry, this model does not do that automatically. So for example, if you originally have an option with 30 days to expiry, tomorrow you would have to manually update that to 29 days, then the next day manually update the expiry to 28, and so on and so forth.
There are various formulas that you can use to calculate the Greeks. I specifically chose the formulations included in this indicator because the Greeks that it presents are the closest to actual options data. I compared the Greeks given by this indicator to brokerage option data on a variety of asset classes from equity index future options to FX options and more. Because the indicator does not use actual option prices, its Greeks do not match the brokerage data exactly, but are close enough.
I may try to make future updates that include data for Long Binary Puts, American Options, Asian Options, etc.
