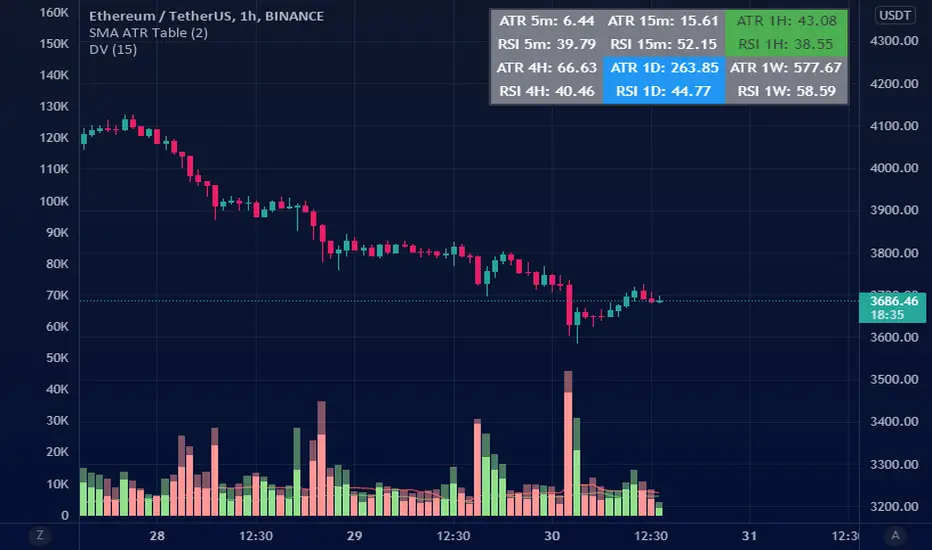
ATR BandsThis script shows the upper and lower bounds based on the open price. You can specify the ATR multiple to create the bands. The default multiple is 1. Similarly you can also specify the length to calculate the ATR value.
ATR
ATRPricePercentThis script builds on top of the ATR Price Ratio script. In this script I am representing the ratio as a percentage for getting the volatility up to the second decimal.
ATR TRex [SHK]To appreciate dear Mr.Khakestar efforts i have converted his mt4 ATR formula to pine script. All credits goes to him.
Plots
You can enable plots from the settings tab and then disable five first plots from the style tabs (finally save as default). Then you can view the ATR result of each candle in the past:
Green number is the HL range of the candle.
Red number is the ATR of the candle.
First black number is the ATR of the 4H chart.
Second black number is the ATR of the 1D chart.
Third black number is the ATR of the 1W chart.
What makes this ATR formula so different?
This formula invented by Mr.Khakestar and it shows the power of the price to move in each cycle of the chart. We can use it in RTM strategy and Price Action trading. To learn how to use it you need to learn TRex strategy (Presented by Mr.Khakestart for free in Persian).
ATR Trailing Stop Indicator [Chart]I rely on this script for both my live trading and my backtesting process. I couldn’t live without it. It’s extremely simple – all it does is calculate your trailing stop price.
How It Works
The first number in blue is the current ATR (pips). The second number in green is your trailing stop loss price for Long trades, and the third number in red is your trailing stop loss price for Short trades.
For short trades, the stop loss price is calculated by adding the current ATR value to the highest-high of the given lookback period.
For long trades, the stop loss price is calculated by subtracting the current ATR value from the lowest-low of the given lookback period.
Settings
ATR Length:
ATR period (how many candles to include in the calculation).
Use Structure?
If set to true, the script will use swing lows and highs in its calculation. If set to false, the script will ignore swing lows and highs and give you the distance of the ATR from the current candle close instead.
How Far To Look Back For High/Lows:
Candle lookback period for swing high/lows.
ATR X ?:
This controls your ATR multiplier. For example, if you want to use a 2x ATR stop, set this to 2.
Tool Companion:
Here is the tool companion script for this indicator:
Source Code:
Go to zenandtheartoftrading.com for the source code – it’s free!
ATR Trailing Stop Loss IndicatorI rely on this script for both my live trading and my backtesting process. I couldn’t live without it. It’s extremely simple – all it does is calculate your trailing stop price.
How It Works
The first number in blue is the current ATR (pips). The second number in green is your trailing stop loss price for Long trades, and the third number in red is your trailing stop loss price for Short trades.
For short trades, the stop loss price is calculated by adding the current ATR value to the highest-high of the given lookback period.
For long trades, the stop loss price is calculated by subtracting the current ATR value from the lowest-low of the given lookback period.
Settings
ATR Length:
ATR period (how many candles to include in the calculation).
Use Structure?
If set to true, the script will use swing lows and highs in its calculation. If set to false, the script will ignore swing lows and highs and give you the distance of the ATR from the current candle close instead.
How Far To Look Back For High/Lows:
Candle lookback period for swing high/lows.
ATR X ?:
This controls your ATR multiplier. For example, if you want to use a 2x ATR stop, set this to 2.
Chart Companion:
Here is the chart companion script for this indicator:
Source Code:
Go to zenandtheartoftrading.com for the source code – it’s free!
Average True Range Take profit (ATR)Average True Range Take Profit
An objective method of determining an initial Take Profit and Stop Loss, based on true market volatility and not arbitrary price levels.
Take Profit Levels and Stop Loss Levels are calculated based on multiples of Average True Range
Features & Functions
Option to switch between long or short
Default Value
Take Profit 1 = 1x ATR.
Take Profit 3 = 2x ATR.
Take Profit 5 = 3x ATR.
Stop Loss 2 = 1.5x ATR.
Basline 13 exponential moving average (EMA) (2)
Extra options ATR
Take Profit 2 = 1,5x ATR.
Take Profit 4 = 2,5x ATR.
Take Profit 6 = 3,5x ATR.
Take Profit 7 = 4x ATR.
Take Profit 8 = 4,5x ATR.
Take Profit 9 = 5x ATR.
Stop Loss 1 = 1x ATR.
Stop Loss 3 = 2x ATR.
Extra options MA
Simple moving average (SMA) (1)
Weighted Moving Average (WMA) (3)
Hull moving average (HMA) (4)
Volume Weighted Moving Average (VWMA) (5)
R moving average (RMA) (6)
Triple exponential moving average (TEMA) (7)
ATR Channel Multi-Timeframe / EMA / SMAFeatures:
Select alternate resolution
Select type of moving average
Select custom multiplicator
Traded Range & True ATRBlack line = Trade Range from the last X periods.
Red Line = 61.8% of black line value.
Green bar = The current trade period range.
Default Value = 21 (21 days = I business month)
Generally speaking, a stock moves approximately the same value daily. Knowing the approximate value it likes to stay within calms the nerves when you see retracement of price occuring.
IE. Price average = 1.00 in a day. It move .75 within first hour then retraces in the opposite direction. There are still hours left in the trade day, so it is trading in its value range in order to not over extend itself.
This differs in calculation from the Wells Wilder version as it smooths out jumps and only examines the ranges between high and low.
A good rule of thumb is.
Stop Loss = Entry Price +/- (ATR * 1.5)
Take Profit = (1) Entry Price +/- ATR - 50% exit (Set Trailing Stop @ Entry Value), (2) Entry Price +/- ATR * 2 (50% of remaining).
Lancelot Band - ATR Reversal+Trending IndicatorThis is an indicator I created recently, with the mind of spotting where price might reverse and where the price is trending. You can see this as the primary indicator for your system, however, it is recommended you use this in conjunction with other confirmation indicators.
This script focus solely on ATR or Average True Range.
This indicator is the combination of the baseline from the Ichimoku cloud and the concept of the Keltner channel.
Baseline period = 14
ATR period = 14
ATR Mult = 1.5
For reversal
Long when price crossover Lower band & Stop loss at xLower band
Sell when price crossunder Upper band & Stop loss at xUpper band
For Trend Following
Long when price crossover xUpper band and Stop loss at Upper band
Short when price crossunder xLower band and Stop loss at Upper band
Again, you will need other indicators to help you to succeed in this system. This indicator will not generate the best exit for your position but will generate a good entry signal when you use it with both volume indicator and exit indicator.
Works well on BTCUSD XBTUSD, as well as other major liquid Pair.
Feel free to follow me on Twitter @Lancelot_Auger for more free Alpha.
Please acknowledge my effort by like and follow.
And lastly,
Save Hong Kong, the revolution of our times.
ATR (Average True Range) By TimeWhat is ATR By Time?
This premium indicator was inspired by my RVOL By Time indicator . It works on Stocks, Forex, Crypto and most Futures markets. Instead of calculating the ATR by recent price data, it calculates an ATR value for each candle based on that candle’s time of day.
For example, if you set the Lookback setting on this indicator to 14, then instead of calculating the ATR based on the past 14 candles, it will calculate an ATR value based on the past 14 trading sessions for each candle.
This is extremely useful for day traders in particular as it allows you to gauge the average range of candles during certain times of day instead of only by the most recent price action.
It also draws a regular ATR (optional) – so this is essentially an enhanced ATR script that gives you multiple readings on price volatility.
If you are interested, you can purchase access to the script or register for a free trial on my website: ATR By Time Feature Page .
Why Does It Cost Money?
The reason why this is a premium script that requires payment to access is because it took a lot of time, research and development in order to create. The other advantage of charging for it is that it retains exclusivity to only a select few dedicated traders.
By paying the yearly fee you get access to ALL of my premium indicators including lifetime updates and technical support.
If you don’t want to pay for this script then I completely understand and I have plenty of other free indicators and scripts that you might be interested in!
Free Trial
I am a trader myself and so I know how skeptical you might be that this indicator is worth your time and money. That is why I am offering a free trial of this indicator.
All you need to do to initiate your trial is Join My Mailing List/ on my website: zenandtheartoftrading.com
How It Works
This script uses a complex formula to calculate ATR values across distant historical bars.
Depending on the timeframe you select it will skip through historical bars to find previous bars from the same time of day. It collects these values then applies the traditional ATR formula to them.
The ATR value is determined by the maximum result of the following three calculations:
- Current high minus the current low
- The absolute value of the current high minus the previous close
- The absolute value of the current low minus the previous close
- Whichever of these three calculations comes out highest, that is your ATR for the given candle.
Once this value is calculated for historical bars the ATR indicator’s reading is typically determined by a 14-period moving average of these individual ATR values. So the ATR reading you see on your screen is an average of the past 14 ATR values.
This means that as markets expand and contract this volatility reading will adapt to the change in candle price ranges.
The difference with the ATR By Time indicator’s calculation formula is that rather than referencing recent bars it references bars based on their time of day.
For example, if you are on the 1-Hour chart and you check the ATR By Time value at 9:00AM with a Lookback period of 14, then the value you see will be the result of the ATR calculation of every 9:00AM 1-Hour candle over the past 14 trading sessions.
You can also choose to enable the ATR moving average in the settings menu if you wish. This will give you a smoothed ATR reading by averaging the current session’s ATR value with previous sessions.
This versatility gives you a sophisticated reading on price volatility which is particularly helpful for day trade setups based around market opens or market closes when volatility tends to spike.
The regular ATR indicator will not account for this on the lower timeframes, but this indicator will!
Examples
Stocks - Heatmap Scheme with regular ATR
Stocks - Price Scheme - No ATR
Stocks - Traffic Scheme - Session Average Line RMA
Stocks - Trigger Scheme - 10 sessions
Forex - RMA
Forex - No RMA
Forex - Normal ATR Stop
Forex - Session ATR Stop
Alert-QuarryLake Indicator Map - ATR Trend Following Strategy A lot of times I don't like my chart crowding with indicators, thus the reason for creating this script for my strategy QuarryLake.
This script also comes with alert.
Below is the explanation for QuarryLake
I have also updated the script in version 4.
This strategy consists of 3 indicators that I found works quite well together.
Keltner Channel, Waddah Attah Explosion, and Volatility Stop.
You can find WAE here
KC Period = 200
KCATR = 5
Vstop Period = 3
Vstop Mult = 1.5
Long when close > KC, close > Vstop, WAE trendUp
Short when close < KC, close < Vstop, WAE trendDown
Works well on BTCUSD XBTUSD, as well as other major liquid Pair.
Feel free to follow me on Twitter @Lancelot_Auger for more free Alpha.
Please acknowledge my effort by like and follow.
And lastly,
Save Hong Kong, the revolution of our times.
CloudRest ATR based cloudThis is an indicator I have been working on for the past 2 years, developed specifically for cryptocurrency.
It is primarily a trend following indicator with great success and it performs the best in 4hrs to the weekly chart.
There are two components of this indicator.
The baseline from Ichimoku cloud and volatility stop .
baseline period = 26
volatility stop = 1.5ATR, 3
You can view this as the main component of a trend following system but you will need other confirmation indicators to confirm your entry.
Feel free to modify the script for your own system.
Feel free to follow me on twitter @Lancelot_Auger
I will be posting more content in the future, stay tuned.
And lastly,
Free hong kong, the revolution of our time!
Moar MAsJust a bunch of things I like, to determine trend direction.
This script uses faster EMAs and slower SMAs. Also ATR for stops and trend reversals.
Acmillions Double ATR BandsDouble ATR Bands
ATR can be used to calculate stop loss and take profit
Recommended to take action one candle after the current candle
hits the support or resistance.
Long position
Inner green line - take profit for long position
Outer red line - stop loss for long position
Short position
Inner red line - take profit for short position
Outer green line - stop loss for short position
Cheers and happy trading. ^_^
Average True Range Trailing Stops TFAverage True Range for trailing stops, can be set to any timeframe independently of currently-displayed timeframe
This indicator is derived from
but more customizable.
Many thanks to HPotter for the original version
ATR ChannelsATR Channels help you to identify where to place your stop-loss or trailing stop-loss based on price volatility, according to the Average True Range (ATR).
No Nonsense NNFX VP Strategy for Back Testing Baseline | jhStrategy for the NNFX Baseline Script - Moving Averages
Does not enter when price is > 1 ATR away.
Adapted the "Many Moving Averages" script to VP's NNFX No Nonsense Forex method.
Includes:
- ATR bands and labels
- Price is > 1 ATR away from baseline indication
Available MAs
"ALMA", "EMA", "DEMA", "TEMA", "WMA", "VWMA", "SMA", "SMMA", "HMA", "Kijun", "McGinley"