Monday_Weekly_Range/ErkOzi/Deviation Level/V1"Hello, first of all, I believe that the most important levels to look at are the weekly Fibonacci levels. I have planned an indicator that automatically calculates this. It models a range based on the weekly opening, high, and low prices, which is well-detailed and clear in my scans. I hope it will be beneficial for everyone.
***The logic of the Monday_Weekly_Range indicator is to analyze the weekly price movement based on the trading range formed on Mondays. Here are the detailed logic, calculation, strategy, and components of the indicator:
***Calculation of Monday Range:
The indicator calculates the highest (mondayHigh) and lowest (mondayLow) price levels formed on Mondays.
If the current bar corresponds to Monday, the values of the Monday range are updated. Otherwise, the values are assigned as "na" (undefined).
***Calculation of Monday Range Midpoint:
The midpoint of the Monday range (mondayMidRange) is calculated using the highest and lowest price levels of the Monday range.
***Fibonacci Levels:
// Calculate Fibonacci levels
fib272 = nextMondayHigh + 0.272 * (nextMondayHigh - nextMondayLow)
fib414 = nextMondayHigh + 0.414 * (nextMondayHigh - nextMondayLow)
fib500 = nextMondayHigh + 0.5 * (nextMondayHigh - nextMondayLow)
fib618 = nextMondayHigh + 0.618 * (nextMondayHigh - nextMondayLow)
fibNegative272 = nextMondayLow - 0.272 * (nextMondayHigh - nextMondayLow)
fibNegative414 = nextMondayLow - 0.414 * (nextMondayHigh - nextMondayLow)
fibNegative500 = nextMondayLow - 0.5 * (nextMondayHigh - nextMondayLow)
fibNegative618 = nextMondayLow - 0.618 * (nextMondayHigh - nextMondayLow)
fibNegative1 = nextMondayLow - 1 * (nextMondayHigh - nextMondayLow)
fib2 = nextMondayHigh + 1 * (nextMondayHigh - nextMondayLow)
***Fibonacci levels are calculated using the highest and lowest price levels of the Monday range.
Common Fibonacci ratios such as 0.272, 0.414, 0.50, and 0.618 represent deviation levels of the Monday range.
Additionally, the levels are completed with -1 and +1 to determine at which level the price is within the weekly swing.
***Visualization on the Chart:
The Monday range, midpoint, Fibonacci levels, and other components are displayed on the chart using appropriate shapes and colors.
The indicator provides a visual representation of the Monday range and Fibonacci levels using lines, circles, and other graphical elements.
***Strategy and Usage:
The Monday range represents the starting point of the weekly price movement. This range plays an important role in determining weekly support and resistance levels.
Fibonacci levels are used to identify potential reaction zones and trend reversals. These levels indicate where the price may encounter support or resistance.
You can use the indicator in conjunction with other technical analysis tools and indicators to conduct a more comprehensive analysis. For example, combining it with trendlines, moving averages, or oscillators can enhance the accuracy.
When making investment decisions, it is important to combine the information provided by the indicator with other analysis methods and use risk management strategies.
Thank you in advance for your likes, follows, and comments. If you have any questions, feel free to ask."
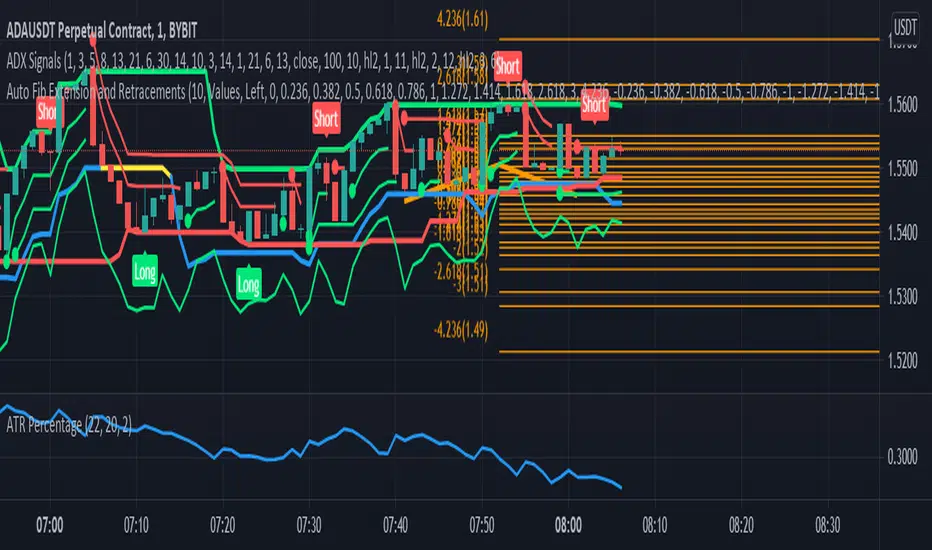
Autofibo

Auto Fib Extension and RetracementsThis script is used for plotting the Fibonacci support and resistance levels. Compared to other ones, the changes to this script are that you can choose what color should all the lines be and that it doesn't change the chart's size, meaning that it won't shrink the chart so that all the levels can be seen. If you have any suggestions, I'm open to anything.
Also, if you could give a like/comment or if you could follow me, that would do my day. Thank you all and enjoy!
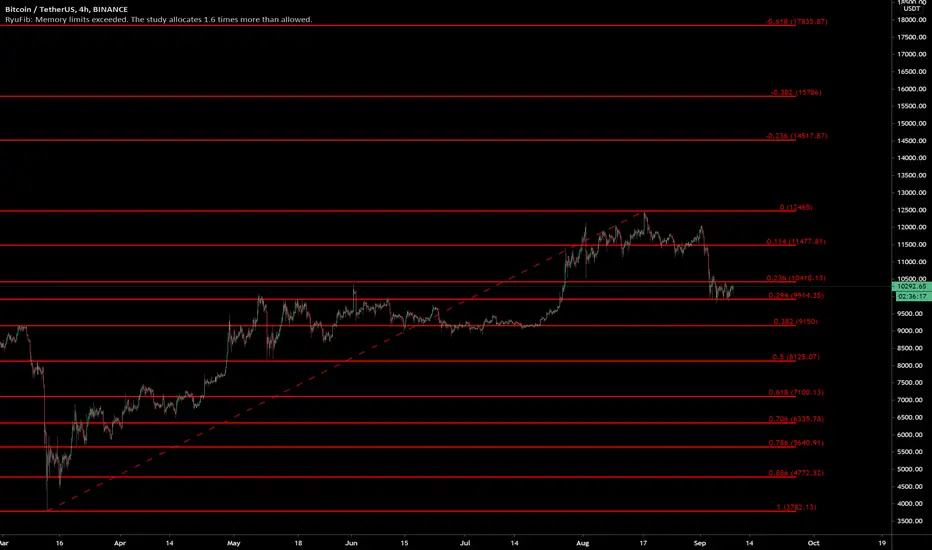
RyuFib🔰 Auto Fibonacci Retracement
New look, features, and improvements from the previous auto Fibonacci indicator. Now looks like the Fib Retracement Tool that you can draw and with all of it's settings options. This indicator will automatically draw all the Fibonacci levels onto the chart and update for each timeframe and adjust saving you time. By default the length is long so it will show the major levels, however, can be adjusted to any custom length or shorter length to select various retracements. An improvement to the indicator in the update is that now it will auto update and adjust to fit the history length. The previous custom timeframe option has been removed, since you can select any length for retracement anyways and is not needed. Lines that go further back in history that are not shown in the chart view are not loaded to prevent loading lines not in view, this done by TradingView. So if the length is long the lines do not appear unless you scroll back further in history to the start point in time of the retracement history. To prevent this, by default the lines are extended to the left so you don't have to scroll back for them to show, but you can still turn off the extend if you choose. Another update improvement is that it will now auto detect and adjust the Fibonacci retracement type, i.e, from high to low or low to high with the appropriate levels, with the option to reverse like the tool gives. Now also shows the trend line which shows the points used from the retracement from the high and low, which can also be turned on/off. Additionally, another improvement now the Fibonacci price levels are shown along with the levels.
This indicator shows all of the common default Fibonacci levels as well as my own added fib levels for the default levels, with the default extension levels, and added custom levels. By default there 9 of the common and my added Fibonacci levels displayed, plus the 2 for the high and low, so 11 levels, plus default 3 extension levels and 3 reverse extension levels, and 18 additional custom Fibonacci levels that are hidden and can be turned on and adjusted. So there are 35 total Fibonacci levels with the levels and price labels. All of the Fibonacci levels can be customized and adjusted in the settings with an input and can be turned on/off to be shown or hidden.
You don't need to do anything, simply load the indicator and it will auto adjust the appropriate length if needed, retracement type, and display the Fibonacci levels for each timeframe and update. However, you can still change the custom Fibonacci settings and style settings as you choose.
📌 Note: New update and redesign updated to new version pine script v4. This is published as a new indicator since it is now completely different redesigned with updates and improvements, and since the description was too long to fit in an update. This older Auto Fibonacci indicator is no longer used and updated by this one.
📌The following are the custom settings options of the user interface:
📌 For the plots display options:
Can show/hide all Fibonacci levels with a single master control switch
Can turn on/off the default Fibonacci extension levels
Can turn on/off the default Fibonacci reverse extension levels
Can show/hide all Fibonacci levels labels
Can show/hide all Fibonacci price labels
Can show/hide the Fibonacci trend line
📌 Fibonacci retracement settings:
Can adjust each Fibonacci level custom input
Reverse option to reverse the levels retracement type and levels
Can select the Fibonacci length max bars back, which will also auto adjust if needed if too long
Option to select the candle type for the retracement to use wick or candle close, default uses wick
📌 Fibonacci custom style settings:
The style settings updates for all 35 Fibonacci levels so you don't have to do individually
Can adjust all of the colors to your preference, default red since works for both black/white backgrounds
Adjusting the color will adjust all of the colors for the levels line, levels label, and price label
Can adjust the lines to solid, dashed, or dotted as preferred
Can extend lines to the left, right, or both, or turn off, default extended left
Can change the levels labels to display as levels or percents, i.e, 0.618 or 61.8%
Can adjust the width of the Fibonacci lines
Can adjust the size of the Fibonacci levels and price text labels
Can adjust the offset to shift the levels and price text labels
📌 Example on Bitcoin currently on the 1h showning Fibonacci levels being respected.
📌 Another example with BTC on the 15m showing price ping pong between Fibonacci levels; and with different settings with white color and levels shown as percents option.
📌 Here is Bitcoin again on the 1D timeframe with just default settings. Based on the history the indicator automatically selected the appropriate length and shows the high and low point and drew the levels. We can see the major Fibonacci levels being respected and with the extension levels can see the further future potential resistances.
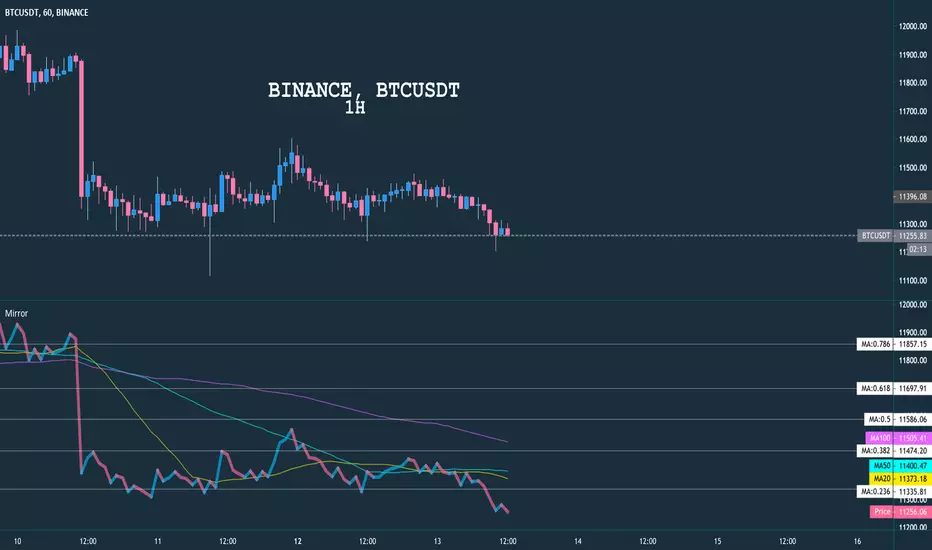
Mirror Chart MultitimeframeDescription
Allow user to display any chart from any timeframe with indicator Moving Average and Auto Fibonacci
Setting
Chart From , please enter your index symbol, example: BINANCE:BTCUSDT or ETHBTC
Timeframe , which time frame to show the chart (no impact with main chart)
MA 20, MA 50, MA 100 , check any MA that you want to display
Fibo Range , enter total candle that will be used for fibo
Show Fibo 0-1 , show fibo line from 0, 0.236 and so on to 1
Example
It shows many charts with different timeframes
Auto Fibonacci Retracement by Atilla YurtsevenAuto Fibonacci Retracement is simply the best Fibonacci retracement indicator ever. Everything is done automatically. Just try it yourself!
Trend Lines and Targets are experimental.
Disclaimer: Past performance is not an indication of future performance. All the information in this article, including the algorithm & indicator, was provided and published for informational purposes only and should not be considered legal or financial advice. Use at your own risk!
Remember to follow me if you like to get notified when i publish new indicators or analysis. You will enjoy it!
Trade safe
Atilla Yurtseven
Twitter: @atillayurtseven

Auto Fibonacci Retracement Levels MTFMulti Time Frame version of Auto Fibonacci Retracement Levels Indicator
Now you can see daily Fibo Retracement levels on any time frame
This indicator/tool (Auto Fibo) draws Fibonacci Retracement Levels automatically on any chart.
The algorithm of the Indicator Plots the extreme points and puts the retracement levels in order by itself with 100% sensitivity.
The key point is that to arrange the length of the "lookback bars" to arrange the correct extreme points.
Like the other auto plotting tools, the levels can change when the time frame of the chart changes, in contrast with manually drawn Fibo levels.
In technical analysis , a Fibonacci retracement is created by taking two extreme points (usually a major peak and trough) on a stock chart and dividing the vertical distance by the key Fibonacci ratios of 23.6%, 38.2%, 50%, 61.8% and 100%.
