Kolya Signals IntegrateScript en fase de prueba. ADX DMI, Stoch RSI, Fisher Transform, EMA, BB, VWAPPenunjuk Pine Script®oleh kolyacrypto29
Zero Lag ADX [jwammo12]This uses Zero lag principles to ADX. The cyan line is the zero lag line and the grey line is the traditional ADXPenunjuk Pine Script®oleh jwammo12Telah dikemas kini 128
Momentum and Trend Strength Entry Exit Pivot StudyUpdated version of previous Momentum Strength Entry Exit Pivot Study: //************************ // @TheGeeBee - Credit where used // //Notes: // // Use 1,2,3,5 minute timeframes // EMA Cross line and offset allows user to alter the sell characteristics where the candle low is above the EMA line and indicates a possible pre-pivot reversal // Adjust Min and Max pivots based on risk profile // Single Candle drawdown value represents the maximum size of a single red candle before an Exit Pivot is generated // ADX Threshold inhibits Pivots when trending signal is below the threshold value // Percentage Max drawdown since Entry Pivot allows the system to generate an Exit Pivot if the security has dropped X percent from the most recent Entry Pivot point // Use Bars, Candles (preferred) or Heikin-Ashi // Multiple Green Bars = BTFD // Multiple Red bars = If you didn't already get out, do it now! // //************************ Allows for Alerts to be set for Entry and Exit Pivots.Penunjuk Pine Script®oleh TheGeeBeeTelah dikemas kini 88486
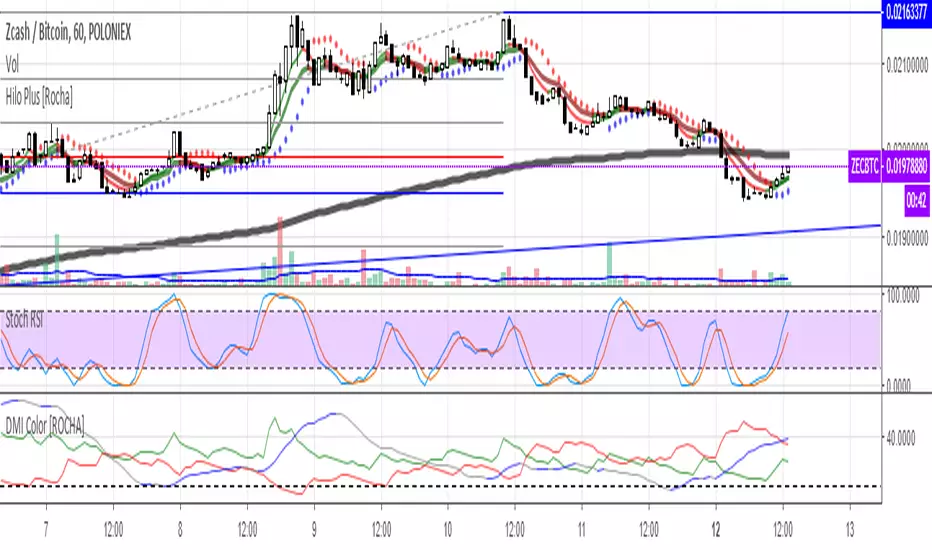
[Delphi][CryptoNews Plus] RSI + DMI ADXRSI + DMI ADX Inner Version 1.0 07/02/2019 Developer: iDelphi 07/02/2019 Added RSI 07/02/2019 Added ADX Penunjuk Pine Script®oleh iDelphi50
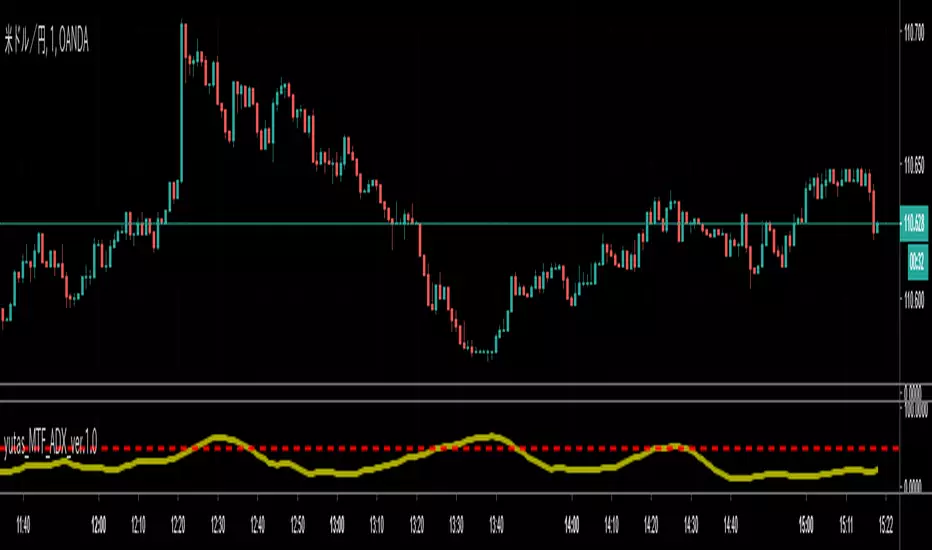
yutas_MTF_ADXVer .1.0 ADX indicator for multi time frame support. マルチタイムフレーム対応のADXインジケーター。Penunjuk Pine Script®oleh yutas118
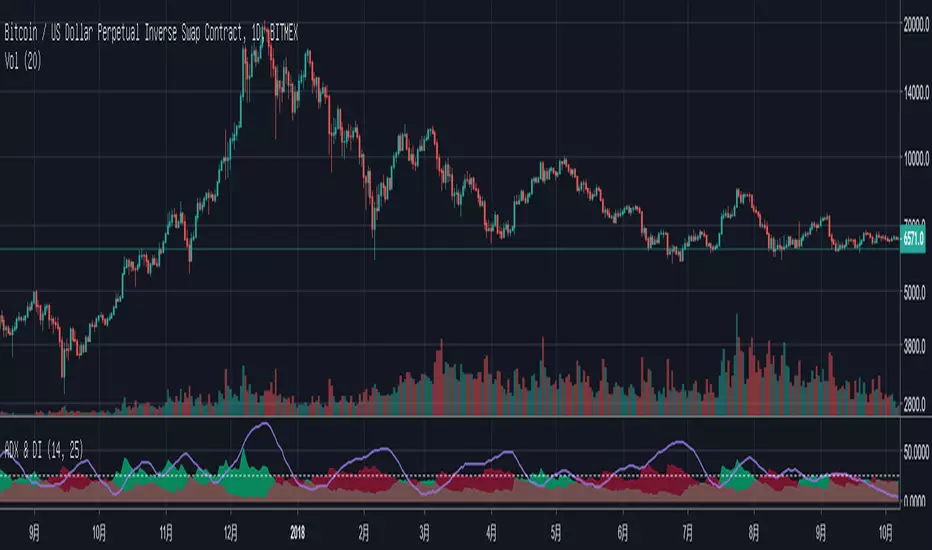
ADX & DI in one lineThis is the standard ADX & DI indicator, but combined in a single line, changing color when a trend changes and changing value when the trend is strong.Penunjuk Pine Script®oleh laptevmaxim92Telah dikemas kini 331
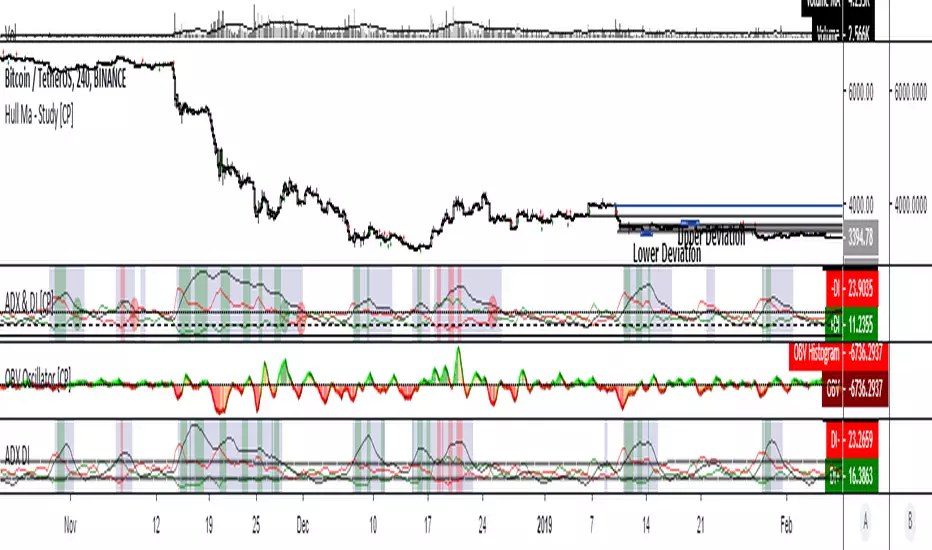
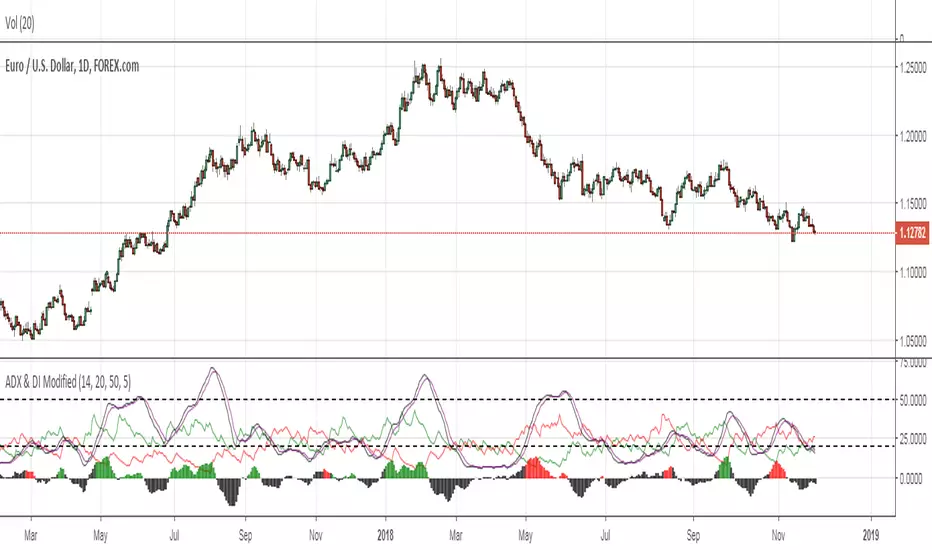
Strength & Directional Movement [CP]This my version of the ADX & DI indicator, fixed the code, ported to Pine Script v3 and loaded up with filters for your smoothing pleasure. I have some info below on how to read this indicator, be sure to take a look! Wilder’s DMI (ADX) consists of three indicators that measure a trend’s strength and direction. Three lines compose the Direction Movement Index (DMI): ADX (black line), DI+ (green line) and DI- (red line). The Average Directional Index (ADX) line shows the strength of the trend. The higher the ADX value, the stronger the trend. According to Wilder, a trend is present when the ADX is above 25. DMI values range between zero and 100. The Positive Directional Indicator (+DI) and Negative Directional Indicator (-DI) show the current price direction. When the DI+ is above DI-, current price momentum is up. When the DI- is above DI+, current price momentum is down. DI Crossovers: Traders could enter a long position when the DI+ line crosses above the DI- line and set a stop-loss order under the current day’s low. When the DI- line crosses above the DI+ line, traders could place a short position with a stop above the high of the current day. Irrespective of whether the trader takes a long or short position, the ADX should be over 25 when the crossover occurs to confirm the trend’s strength. When the ADX is below 20, traders should use trading strategies that exploit range bound conditions DI Contractions and Expansions: The DI+ and DI- line move away from each other when price volatility increases and converge toward each other when volatility decreases. Short-term traders could enter trades when the two lines move apart to take advantage of increasing volatility. Swing traders might accumulate into a position when the lines contact in anticipation of a breakout. The +DI generally moves in sync with price, which means the +DI rises when price rises, and it falls when price falls. It is important to note that the -DI behaves in the opposite manner and moves counter-directional to price. The -DI rises when price falls, and it falls when the price rises. This takes a little getting used to. Just remember that the strength of a price move up or down is always recorded by a peak in the respective DMI line. Reading directional signals is easy. When the +DI is dominant and rising, price direction is up. When the -DI is dominant and rising, price direction is down. But the strength of price must also be considered. DI strength ranges from a low of 0 to a high of 100. The higher the DI value, the stronger the prices swing. DI values over 25 mean price is directionally strong. DI values under 25 mean price is directionally weak.Penunjuk Pine Script®oleh Coinpocalypse11249
ADX Suavizado + DMI com Periodo RDNAdicione rafdourado para maiores informações de uso ou dicas para aprimoramentoPenunjuk Pine Script®oleh rafdourado4440
ADX +- DiThis Adx +-Di is just a complete version of what the ADX is supposed to signal. So you have: 15 (contraction), 20 (threshold), 30 (expansion), 40 (resistance) levels. Below 20 the price is not trending Above 30 the price is trending Below 15 price has been in contraction for too long Between 20 and 30 price is in a "transition zone". I finally added a "Resistance" level (40), which has to be adapted to best represent the historical levels where price usually encounters resistance, and where the price can be declared "overtrending", which means a return to lower levels is likely to happen. I've chosen mild colors, and set the Adx Color to White, because I use black background, you can easily change that. Enjoy -Maurice Penunjuk Pine Script®oleh MauriceEverthin103
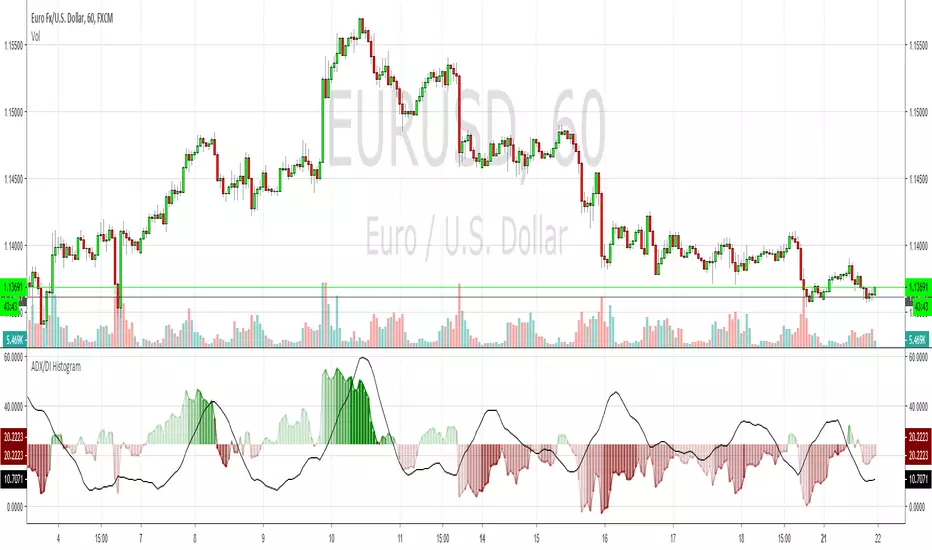
ADX & DI HistogramThis bad boy shows the same info as a normal ADX & DI but I've endeavoured to remove a lot of the confusion. I also added red/green colour gradients to show how much ADX is trending, the darker the colour, the stronger the trend. This should help to avoid the upsidedowniness and confusion I've always found with the original. I made this a while ago and have made a few changes recently but I can't remember where I go the basic ADX code from, so credit to whoever that was. EnjoyPenunjuk Pine Script®oleh scarf3636 1.8 K
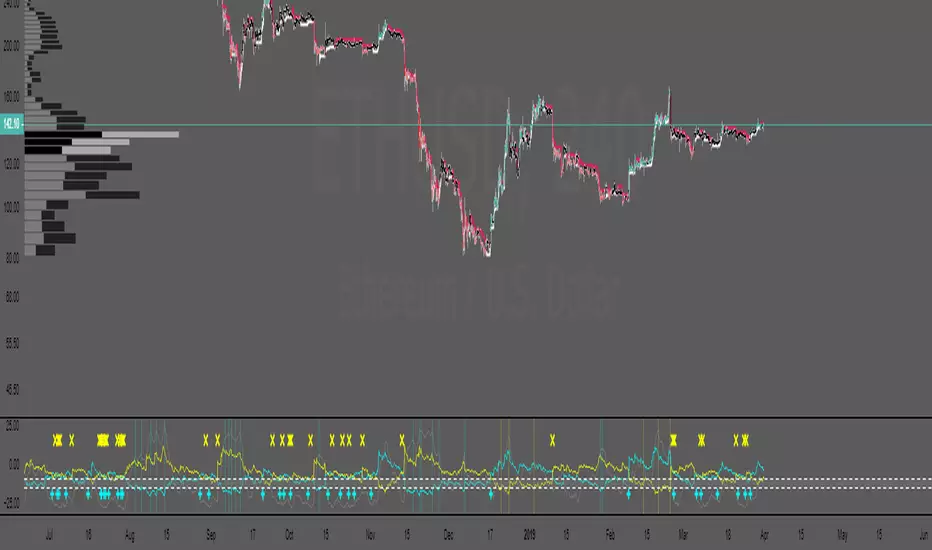
ADX Crossover + BarColor v0.1Цвет бара показывает текущий тренд. Красный - падающий, зеленый - растущий. Желтый знак показывает начало или усиление тренда, флаг - завершение тренда, начало консолидации или следующего трендаPenunjuk Pine Script®oleh short_squeeze6
ADX & DI with Long + Short ConditionsMy version of the ADX & DI Indicator with an extra theshold and adjustable long and short conditions. A green background (long) will appear when the ADX is rising, the DI+ is falling and the DI+ is below the (new) lower threshold. A red background (short) will appear when the ADX is rising, the DI- is falling and the DI- is below the (new) lower treshold. You can adjust the tolerance for the lower threshold in the settings of the indicator. Penunjuk Pine Script®oleh CoinpocalypseTelah dikemas kini 109
ZR1DMI/ADX blue is Bull momentum yellow is Bear momentum gray line is trending line dotted is TREND LINE idea: look for two lines to be above the dotted TREND LINE bullish = Bull momentum + Trending Line bearish = Bear Momentum + Trending Line when all three are converged or when Tending Line is below dotted its CHOP Blue flashes when BULL momentum is growing Yellow flashes when BEAR momentum is growing NOTE: FOR PA TO MOVE WE DONT ALWAYS NEED 2 LINES ABOVE 1 BELOW a secondary trade idea is simply on cross over . when Trending line + one of the momentum lines crosses over the 3rd line (secondary momentum) this can also be seem as trend confirmation. with that said the strongest and safest set ups are still when 2 is above the TRENDING LINE and 1 belowPenunjuk Pine Script®oleh SatoshiHeavyTelah dikemas kini 63
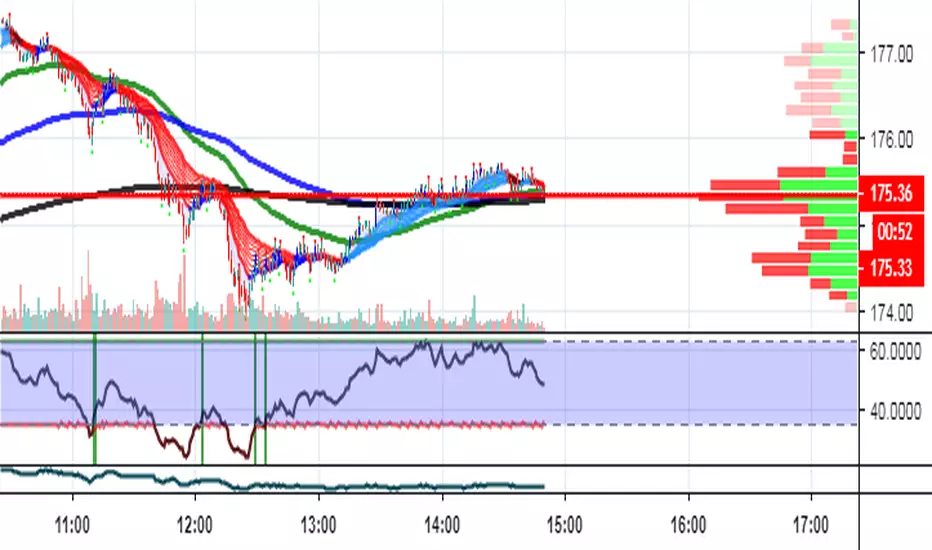
ADX & DI trend exhaustionAn EMA is applied to the ADX in order to catch the exhaustion of a trend (i.e. ADX line crossunder EMAADX line) or the possible formation of a new one. In the first case, we would wait a confirmation signal, which happens when the crossunder has a value greater then 50. A new trend is created when the difference between the ADX and the EMAADX is positive, with ADX greater then 20. As confirmation, we would have the DI+ greater then 20 e the DI- smaller then 20 (this would trigger a bullish sentiment, bearish for the opposite), consequently the histogram will be display in green (red in the bearish case).Penunjuk Pine Script®oleh SimoneNovo44223
ADX Indicator testADX 14 is below 20 and 20 period EMA cross 90 periodPenunjuk Pine Script®oleh MikhailAntropov26
ADX & DIDeclaration: This is a tradingview script written by feibilanceon of Agg.one . This indicator is not public and for invitation only. Features: ADX and DI+ and DI- all in one indicator with a beautiful design! Usage: Just simply add this indicator to your chart! Contributing: You can report bugs or issues under this page. Any advice would be helpful for improving this indicator's accuracy.Penunjuk Pine Script®oleh discountry212187
Gunbot Deluxe Tuners BE [Alerts]Revision 18 Gunbot Deluxe Tuners BE Alerts is part of the official Gunthy version of Gunbot Deluxe Tuners. It is the companion Alerts script for the Gunbot Deluxe Tuners BE (Black Edition) backtesting and optimizing script. This Alerts script allows user to automatically send alerts directly to Gunbot through the Gunbot TradingView addon. Available only to verified Gunbot owners. No exceptions. Anyone interested in obtaining this script must contact either their official Gunbot reseller or me privately. No public requests or donations for access to this script will be granted. No exceptions. NOTICE: By requesting access to this script you acknowledge that you have read and understood that this is for research purposes only and neither I or Gunthy are responsible for any financial losses you may incur by using this script!Penunjuk Pine Script®oleh allansterTelah dikemas kini 6363803
Average Directional Index-BuschiA simple modification of the built-in "Average Directional Index": To identify wether there is an uptrend or a downtrend, the function color is conditional: no trend: black small uptrend (weak threshold): light green big uptrend (strong threshold): green small downtrend (weak threshold): light red big downtrend (strong threshold): red Penunjuk Pine Script®oleh MagicEinsTelah dikemas kini 33497
Ichi Trend Follow System v2This is an improvement upon a very popular trend following system that is currently selling for about $1k per year. I pull data from longer time frames to confirm trend, as well as use the ADX to minimize trading in sideways chop. I’ve backtested both the older $1k system and this newer one and can confirm improvements in every market and timeframe that I’ve tested. Here’s the gist of how to use it. Wait for a set up bar. The set up bar will be aqua to go long and yellow to go short. Open your trade on the open of the following bar. Close your trade when the trending bar color (lime for long/fuchsia for short) changes back to standard colors on completion of the bar (green or red). Please ask, and I’ll let you try it for free. Penunjuk Pine Script®oleh minorplanet2Telah dikemas kini 8834
DMI ADX TREND 2.0 (edit by GeertVD)Edit of the popular script by @TraderR0BERT New features: - horizontal colored areas, indication weak/medium/strong trend - vertical bars, signaling trend/momentum changes - DI+ vs DI- contraction/expansion histogram (to measure the DI volatility)Penunjuk Pine Script®oleh GeertVDTelah dikemas kini 1010 1.1 K
ADXRainbowColorEMAThis is an EMA that color changes based on ADX. When ADX is low, EMA color is in lime or aqua, if the value of ADX moves higher, It changes from aqua to yellow and then red. You can change the settings like EMA period and the color, etc in the dialog window. Usually, as the trend becomes stronger, the ADX values rises, so there is a possibility on a trend when it is yellow or red. Especially, when changing from aqua to yellow and red, it is a necessity check because it is a possibility of change from range to trend. これはADXに応じて色が変化するEMAです。 ADXが低いときは、EMAの色はライム(明るい緑)やアクア(水色)ですが、ADXの値が高くなると、アクアから黄色、そして赤に変化します。 EMAの期間や色などはダイアログウインドウで変更できます。 通常、トレンドが強いとき、ADXの値は上昇します。その為、ラインの色が黄色や赤の時は、トレンド状態の可能性があります。 特に、色が水色から黄色、そして赤に変化するときは、レンジ状態からトレンドへと移行した可能性があるので、要チェックです。 Penunjuk Pine Script®oleh fxmaruchanTelah dikemas kini 22451