Scalper's toolkit - ATR WidgetWidget specifically designed for scalping. Many settings to fit the instrument and view preferences to make it fit into your chart window how you like, even on mobile.
** I have 5 other features to add into this in the very near future, as I use this as my primary tool for Risk reward. This script will be updated in the near future as more features are coded into it. See bottom for notes on plans
Features:
Displays a quick view of the ATR value on the chart, in decimal PIPs or directly in Points - a key value for scalping using the DOM for point value settings and one click trading on fast time frames.
Automatic calculation of stop and target distance for a predetermined Risk Reward Ratio (Set with the settings panel), and then also displayed in PIPs or Points for easy use in quick trading.
Works on most all instruments/pairs/cryptos with multiple precision levels for correct values to be shown in the widget.
Fully customizable -
ATR period Base setting, just like a normal ATR indicator
Display in : PIPs or Points
ATR based stop distance, using a multiplier. 2 is the most common multiplier used, and the default setting.
Risk Reward Calculation using the Stop Loss value.
-Quickly helps with proper target and stop sizing for the volatility in the price on the current trade entry point.
-Set to any ratio you wish, from 1:0.1 all the way to 1:100 or more, unlimited R ratio settings to fit your strategy and risk tolerances.
Position anywhere on the chart window with 9 preset locations available (Pine script limitation)
Show as a column layout or a row layout
Customize the Size, with 5 preset widget sizes, from tiny to huge (Pine script limitation)
-Mobile Friendly - Tiny or Small may be too small on PC, but can be used for Mobile so the widget does not become too large over the chart.
Custom text, background, and boarder colors
Custom Boarder Size - 0 size is no boarder
Set up:
-Open the settings panel.
First section is the basic settings for the ATR - the length (Default is 14) and to use a PIP value display, or Point value display.
Here you also see a "Precision" Setting. **Because each instrument returns different precision ATR values, it is difficult to determine with code what those values will be ahead of time to do the math in the background. Even some 2 decimal instruments return 5 decimal ATR values, so this setting filters that** Just use the dropdown and choose how many decimal places the instrument has from 2 - 5 decimals
The second section is for risk and reward calculations, and can be disabled if you do not want to see these values.
The first value is the "ATR Multiplier" Typically, a 2x multiplier is used on the ATR to determine how far away to place your stop loss from the entry, placing it out of harm's way from normal market activity.
The second value is the Reward target distance, based from the stop loss size. This quickly calculates your target to match your intended reward ratio, saving some manual work to calculate this by hand every trade.
** Note: because of the math used in the code, you may see odd values on some instruments, like indexes. If you have the precision correct, try changing the "Show in Pips" to "Show in Points", as this may solve the issue.
The last two sections are purely for how the widget looks and how/where it shows on the screen. These can be set however you like. To have no boarder, just set the "Frame size" value to 0.
Additional Updates planned:
Pip value calculation (2 feature uses)
-This will serve 2 purposes. The widget will calculate the value of the trade based on the lot size. It will also have a risk limit, so if the ATR get's too high for the current risk settings, It will show red to warn you of a high risk situation before you trade.
Example, you have a set limit of 3 dollars per trade using .02 lot sizing. If the ATR get's too high, The Stop value will be more risk than you would like to use at that trade sizing. Reduce the trade size, or wait for ATR to come lower.
Purpose 2: lot size calculation, so if you wanted to maximize the use of risk available. If you wanted to risk 600 for example, it would use the ATR you have set for the risk, and determine the proper lot size for the amount of volatility in the market. This way, you Risk Exactly, or as close as possible to 600 for the the current trade conditions.
Extra use for this value: Show the Current trade amounts at risk and for gain in money values on the side of the pip/point value. Know what you're risking and also trading for in monetary value.
ATR candle Comparison- Early momentum Detection (2 feature uses)
Will show an additional section on the bottom of the widget to show how each candle compares to the one before, up to the last 5, and show if ATR went down, up, or stayed the same over the last 5 candles.
Show an additional symbol to indicate the current candle status in comparison to the close of the last candle. Real time of if the ATR is getting larger, smaller, or staying the same.
Average True Range (ATR)

GKD-V Weis Wave [Loxx]Giga Kaleidoscope GKD-V Weis Wave is a Volatility/Volume module included in Loxx's "Giga Kaleidoscope Modularized Trading System".
█ Giga Kaleidoscope Modularized Trading System
What is Loxx's "Giga Kaleidoscope Modularized Trading System"?
The Giga Kaleidoscope Modularized Trading System is a trading system built on the philosophy of the NNFX (No Nonsense Forex) algorithmic trading.
What is the NNFX algorithmic trading strategy?
The NNFX (No-Nonsense Forex) trading system is a comprehensive approach to Forex trading that is designed to simplify the process and remove the confusion and complexity that often surrounds trading. The system was developed by a Forex trader who goes by the pseudonym "VP" and has gained a significant following in the Forex community.
The NNFX trading system is based on a set of rules and guidelines that help traders make objective and informed decisions. These rules cover all aspects of trading, including market analysis, trade entry, stop loss placement, and trade management.
Here are the main components of the NNFX trading system:
1. Trading Philosophy: The NNFX trading system is based on the idea that successful trading requires a comprehensive understanding of the market, objective analysis, and strict risk management. The system aims to remove subjective elements from trading and focuses on objective rules and guidelines.
2. Technical Analysis: The NNFX trading system relies heavily on technical analysis and uses a range of indicators to identify high-probability trading opportunities. The system uses a combination of trend-following and mean-reverting strategies to identify trades.
3. Market Structure: The NNFX trading system emphasizes the importance of understanding the market structure, including price action, support and resistance levels, and market cycles. The system uses a range of tools to identify the market structure, including trend lines , channels, and moving averages.
4. Trade Entry: The NNFX trading system has strict rules for trade entry. The system uses a combination of technical indicators to identify high-probability trades, and traders must meet specific criteria to enter a trade.
5. Stop Loss Placement: The NNFX trading system places a significant emphasis on risk management and requires traders to place a stop loss order on every trade. The system uses a combination of technical analysis and market structure to determine the appropriate stop loss level.
6. Trade Management: The NNFX trading system has specific rules for managing open trades. The system aims to minimize risk and maximize profit by using a combination of trailing stops, take profit levels, and position sizing.
Overall, the NNFX trading system is designed to be a straightforward and easy-to-follow approach to Forex trading that can be applied by traders of all skill levels.
Core components of an NNFX algorithmic trading strategy
The NNFX algorithm is built on the principles of trend, momentum, and volatility . There are six core components in the NNFX trading algorithm:
1. Volatility - price volatility ; e.g., Average True Range , True Range Double, Close-to-Close, etc.
2. Baseline - a moving average to identify price trend
3. Confirmation 1 - a technical indicator used to identify trends
4. Confirmation 2 - a technical indicator used to identify trends
5. Continuation - a technical indicator used to identify trends
6. Volatility / Volume - a technical indicator used to identify volatility / volume breakouts/breakdown
7. Exit - a technical indicator used to determine when a trend is exhausted
What is Volatility in the NNFX trading system?
In the NNFX (No Nonsense Forex) trading system, ATR ( Average True Range ) is typically used to measure the volatility of an asset. It is used as a part of the system to help determine the appropriate stop loss and take profit levels for a trade. ATR is calculated by taking the average of the true range values over a specified period.
True range is calculated as the maximum of the following values:
-Current high minus the current low
-Absolute value of the current high minus the previous close
-Absolute value of the current low minus the previous close
ATR is a dynamic indicator that changes with changes in volatility . As volatility increases, the value of ATR increases, and as volatility decreases, the value of ATR decreases. By using ATR in NNFX system, traders can adjust their stop loss and take profit levels according to the volatility of the asset being traded. This helps to ensure that the trade is given enough room to move, while also minimizing potential losses.
Other types of volatility include True Range Double ( TRD ), Close-to-Close, and Garman-Klass
What is a Baseline indicator?
The baseline is essentially a moving average, and is used to determine the overall direction of the market.
The baseline in the NNFX system is used to filter out trades that are not in line with the long-term trend of the market. The baseline is plotted on the chart along with other indicators, such as the Moving Average (MA), the Relative Strength Index ( RSI ), and the Average True Range (ATR).
Trades are only taken when the price is in the same direction as the baseline. For example, if the baseline is sloping upwards, only long trades are taken, and if the baseline is sloping downwards, only short trades are taken. This approach helps to ensure that trades are in line with the overall trend of the market, and reduces the risk of entering trades that are likely to fail.
By using a baseline in the NNFX system, traders can have a clear reference point for determining the overall trend of the market, and can make more informed trading decisions. The baseline helps to filter out noise and false signals, and ensures that trades are taken in the direction of the long-term trend.
What is a Confirmation indicator?
Confirmation indicators are technical indicators that are used to confirm the signals generated by primary indicators. Primary indicators are the core indicators used in the NNFX system, such as the Average True Range (ATR), the Moving Average (MA), and the Relative Strength Index ( RSI ).
The purpose of the confirmation indicators is to reduce false signals and improve the accuracy of the trading system. They are designed to confirm the signals generated by the primary indicators by providing additional information about the strength and direction of the trend.
Some examples of confirmation indicators that may be used in the NNFX system include the Bollinger Bands , the MACD (Moving Average Convergence Divergence), and the Stochastic Oscillator. These indicators can provide information about the volatility , momentum, and trend strength of the market, and can be used to confirm the signals generated by the primary indicators.
In the NNFX system, confirmation indicators are used in combination with primary indicators and other filters to create a trading system that is robust and reliable. By using multiple indicators to confirm trading signals, the system aims to reduce the risk of false signals and improve the overall profitability of the trades.
What is a Continuation indicator?
In the NNFX (No Nonsense Forex) trading system, a continuation indicator is a technical indicator that is used to confirm a current trend and predict that the trend is likely to continue in the same direction. A continuation indicator is typically used in conjunction with other indicators in the system, such as a baseline indicator, to provide a comprehensive trading strategy.
What is a Volatility / Volume indicator?
Volume indicators, such as the On Balance Volume (OBV), the Chaikin Money Flow ( CMF ), or the Volume Price Trend ( VPT ), are used to measure the amount of buying and selling activity in a market. They are based on the trading volume of the market, and can provide information about the strength of the trend. In the NNFX system, volume indicators are used to confirm trading signals generated by the Moving Average and the Relative Strength Index . Volatility indicators include Average Direction Index, Waddah Attar, and Volatility Ratio. In the NNFX trading system, volatility is a proxy for volume and vice versa.
By using volume indicators as confirmation tools, the NNFX trading system aims to reduce the risk of false signals and improve the overall profitability of trades. These indicators can provide additional information about the market that is not captured by the primary indicators, and can help traders to make more informed trading decisions. In addition, volume indicators can be used to identify potential changes in market trends and to confirm the strength of price movements.
What is an Exit indicator?
The exit indicator is used in conjunction with other indicators in the system, such as the Moving Average (MA), the Relative Strength Index ( RSI ), and the Average True Range (ATR), to provide a comprehensive trading strategy.
The exit indicator in the NNFX system can be any technical indicator that is deemed effective at identifying optimal exit points. Examples of exit indicators that are commonly used include the Parabolic SAR , the Average Directional Index ( ADX ), and the Chandelier Exit .
The purpose of the exit indicator is to identify when a trend is likely to reverse or when the market conditions have changed, signaling the need to exit a trade. By using an exit indicator, traders can manage their risk and prevent significant losses.
In the NNFX system, the exit indicator is used in conjunction with a stop loss and a take profit order to maximize profits and minimize losses. The stop loss order is used to limit the amount of loss that can be incurred if the trade goes against the trader, while the take profit order is used to lock in profits when the trade is moving in the trader's favor.
Overall, the use of an exit indicator in the NNFX trading system is an important component of a comprehensive trading strategy. It allows traders to manage their risk effectively and improve the profitability of their trades by exiting at the right time.
How does Loxx's GKD (Giga Kaleidoscope Modularized Trading System) implement the NNFX algorithm outlined above?
Loxx's GKD v1.0 system has five types of modules (indicators/strategies). These modules are:
1. GKD-BT - Backtesting module ( Volatility , Number 1 in the NNFX algorithm)
2. GKD-B - Baseline module (Baseline and Volatility / Volume , Numbers 1 and 2 in the NNFX algorithm)
3. GKD-C - Confirmation 1/2 and Continuation module (Confirmation 1/2 and Continuation, Numbers 3, 4, and 5 in the NNFX algorithm)
4. GKD-V - Volatility / Volume module (Confirmation 1/2, Number 6 in the NNFX algorithm)
5. GKD-E - Exit module (Exit, Number 7 in the NNFX algorithm)
(additional module types will added in future releases)
Each module interacts with every module by passing data between modules. Data is passed between each module as described below:
GKD-B => GKD-V => GKD-C(1) => GKD-C(2) => GKD-C(Continuation) => GKD-E => GKD-BT
That is, the Baseline indicator passes its data to Volatility / Volume . The Volatility / Volume indicator passes its values to the Confirmation 1 indicator. The Confirmation 1 indicator passes its values to the Confirmation 2 indicator. The Confirmation 2 indicator passes its values to the Continuation indicator. The Continuation indicator passes its values to the Exit indicator, and finally, the Exit indicator passes its values to the Backtest strategy.
This chaining of indicators requires that each module conform to Loxx's GKD protocol, therefore allowing for the testing of every possible combination of technical indicators that make up the six components of the NNFX algorithm.
What does the application of the GKD trading system look like?
Example trading system:
Backtest: Strategy with 1-3 take profits, trailing stop loss, multiple types of PnL volatility , and 2 backtesting styles
Baseline: Hull Moving Average
Volatility/Volume: Weis Wave as shown on the chart above
Confirmation 1: Vortex
Confirmation 2: Williams Percent Range
Continuation: Fisher Transform
Exit: Rex Oscillator
Each GKD indicator is denoted with a module identifier of either: GKD-BT, GKD-B, GKD-C, GKD-V, or GKD-E. This allows traders to understand to which module each indicator belongs and where each indicator fits into the GKD protocol chain.
Giga Kaleidoscope Modularized Trading System Signals (based on the NNFX algorithm)
Standard Entry
1. GKD-C Confirmation 1 Signal
2. GKD-B Baseline agrees
3. Price is within a range of 0.2x Volatility and 1.0x Volatility of the Goldie Locks Mean
4. GKD-C Confirmation 2 agrees
5. GKD-V Volatility / Volume agrees
Baseline Entry
1. GKD-B Baseline signal
2. GKD-C Confirmation 1 agrees
3. Price is within a range of 0.2x Volatility and 1.0x Volatility of the Goldie Locks Mean
4. GKD-C Confirmation 2 agrees
5. GKD-V Volatility / Volume agrees
6. GKD-C Confirmation 1 signal was less than 7 candles prior
Continuation Entry
1. Standard Entry, Baseline Entry, or Pullback; entry triggered previously
2. GKD-B Baseline hasn't crossed since entry signal trigger
3. GKD-C Confirmation Continuation Indicator signals
4. GKD-C Confirmation 1 agrees
5. GKD-B Baseline agrees
6. GKD-C Confirmation 2 agrees
1-Candle Rule Standard Entry
1. GKD-C Confirmation 1 signal
2. GKD-B Baseline agrees
3. Price is within a range of 0.2x Volatility and 1.0x Volatility of the Goldie Locks Mean
Next Candle:
1. Price retraced (Long: close < close or Short: close > close)
2. GKD-B Baseline agrees
3. GKD-C Confirmation 1 agrees
4. GKD-C Confirmation 2 agrees
5. GKD-V Volatility / Volume agrees
1-Candle Rule Baseline Entry
1. GKD-B Baseline signal
2. GKD-C Confirmation 1 agrees
3. Price is within a range of 0.2x Volatility and 1.0x Volatility of the Goldie Locks Mean
4. GKD-C Confirmation 1 signal was less than 7 candles prior
Next Candle:
1. Price retraced (Long: close < close or Short: close > close)
2. GKD-B Baseline agrees
3. GKD-C Confirmation 1 agrees
4. GKD-C Confirmation 2 agrees
5. GKD-V Volatility / Volume Agrees
PullBack Entry
1. GKD-B Baseline signal
2. GKD-C Confirmation 1 agrees
3. Price is beyond 1.0x Volatility of Baseline
Next Candle:
1. Price is within a range of 0.2x Volatility and 1.0x Volatility of the Goldie Locks Mean
3. GKD-C Confirmation 1 agrees
4. GKD-C Confirmation 2 agrees
5. GKD-V Volatility / Volume Agrees
█ GKD-C Weis Wave
What is Weis Wave?
The Weis Wave Indicator is a technical analysis tool used by traders to analyze market trends and identify potential turning points in financial markets. It was developed by David Weis, a trader and market analyst with over 45 years of experience.
The Weis Wave Indicator is based on the principles of market waves, which are the repetitive patterns of market behavior that occur in financial markets. These waves are characterized by price movements that occur in a series of up and down trends, and they are used by traders to identify potential market reversals or breakouts.
The Weis Wave Indicator is a histogram that represents the difference between the cumulative sum of the bullish and bearish waves. The indicator is plotted on a chart as a series of bars that change color depending on the direction of the market trend. If the market is trending up, the bars will be green, while if the market is trending down, the bars will be red.
The formula for the Weis Wave Indicator is based on the accumulation and distribution of volume over time. It uses a cumulative delta volume calculation to determine the strength of market trends and identify potential turning points. The formula is as follows:
Weis Wave Volume = Net Buying Volume - Net Selling Volume
The Weis Wave Indicator is used by traders to identify potential market trends and turning points. It is particularly useful in identifying market breakouts and reversals, as well as in detecting divergences between price and volume. The indicator is commonly used in conjunction with other technical analysis tools, such as moving averages, trend lines, and support and resistance levels, to confirm market trends and generate trading signals.
Specifically, the Weis Wave Volume Indicator is an oscillator that measures the volume of price changes. It combines both momentum and volume to indicate buying and selling pressure. The indicator is designed to show a bull market when the volume is increasing and the price is rising, and a bear market when the volume is decreasing and the price is falling ¹.
The Weis Wave Plugin creates wave charts along with their corresponding wave volume. Wave charts were first created by Richard D. Wyckoff. In his famous course on stock market technique, he instructed students to “think in waves.” Wave analysis was an integral part of his trading method. The Weis Wave is an adaptation of Wyckoff’s method that handles today’s volatile markets ².
This indicator has the option of either ATR, volume, or partial close for source input.
(1) Weis Wave Volume Indicator - Trend Following System. www.trendfollowingsystem.com Accessed 4/7/2023.
(2) Weis Wave Plugin: A Modern Adaptation of the Wyckoff Wave & Volume. weisonwyckoff.com Accessed 4/7/2023.
(3) Weis Wave Volume Indicator: Simple But Extremely Effective. howtotradeblog.com Accessed 4/7/2023.
(4) How to use the Weis Waves indicator in ATAS. atas.net Accessed 4/7/2023.
Requirements
Inputs
Chained: GKD-B Baseline
Solo: NA, no inputs
Baseline + Volatility/Volume: GKD-B Baseline
Outputs
Chained: GKD-C indicators Confirmation 1 or Solo Confirmation Complex
Solo: GKD-BT Backtest
Baseline + Volatility/Volume: GKD-BT Backtest
Additional features will be added in future releases.

Andromeda Indicator [Loxx]Andromeda Indicator is a lower timeframe, high-leverage scalping indicator tuned to Cryptocurrency futures trading. It works by scanning for volatility spikes and then calculation the likelihood that those spikes will break market structure to the upside or downside. This indicator is to be paired with Andromeda strategy found here:
This indicator contains alerts that correspond to signals from the strategy. Both indicators should be used on the chart at the same time.
Notable Settings
Volatility Type: ATR or TRD , these types will be expanded in future releases.
Signal Speed: How quickly you'd like signals to flow in
Number of Take Profits: How many take profits levels. 1-5
Show dip buying levels: If you have a high risk appetite, these are levels where you could increase your investment size, this has no effect on the indicator but is included for if you wish to manually add to your position size
Activate Longs?: Toggles on/off Longs
Activate Longs?: Toggles on/off Shorts
UI components
Big green and red plus signs means an entry point. PTF with green and red arrows means "prepare for trend flip". Not every PTF will actually flip the trend. These are just warning shots to make you aware that a possible trend flip is coming. Labels nest to market structure breaks with numbers are the ideal entry level. You can set limit orders at these levels so as to incur less exchange fees on Binance or Bybit for example. The data window provides useful information about the current trade and targets and stoploss of the next upcoming trade giving the current price action of the asset.
Other things to note
this is an extremely high risk indicator depending on how you tune the settings. You can tune down the settings to make it less risky at the cost of profit and hit rate, but that's up to you and your trading style. This can be used all all timeframes, but is meant for timeframes below 4 hours.

Grid Range Volatility BasedThis TradingView Pine script implements a grid range volatility based indicator that displays dynamic horizontal lines on the chart. The lines are calculated based on the average true range (ATR) of the security being plotted, and the range can be adjusted using an input parameter. The distance between the top and bottom lines is displayed as a percentage in a dynamic label that updates with each new bar.
The script allows the user to choose whether to use red or black lines, and also provides options to set the number of days for range calculations, and the calculation type (either ATR(1) or ATR(x)). The script is designed to work with stocks, forex, and other securities that have price data.
To use this script, simply attach it to a chart and adjust the input parameters to suit your analysis needs. The dynamic lines and percentage label will be displayed on the chart, providing a visual representation of the range volatility of the security being plotted. The values of the highest and lowest lines can also be displayed as labels on the price axis, providing additional context for the range volatility.

Volatility Spike EstimatorPlots the Average True Range (ATR), its historical mean, the upper threshold for a volatility spike, and uses background color to show the likelihood of a volatility spike based on the current ATR value.
Green background indicates an increased likelihood of a volatility spike, while red background means a spike might have already occurred or be in progress.
Update: In this version, we added a short-term ATR calculation with an adjustable input parameter, shortTermATRLength. The likelihood of a volatility spike is now estimated based on the short-term ATR instead of the original ATR. This change makes the indicator more sensitive to recent market conditions and can help detect potential volatility spikes more quickly.

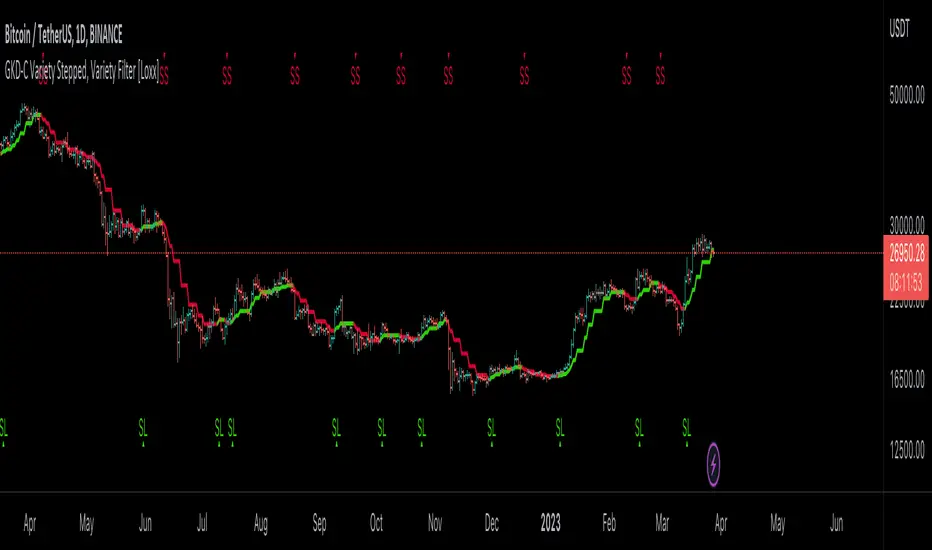
GKD-C Variety Stepped, Variety Filter [Loxx]Giga Kaleidoscope GKD-C Variety Stepped, Variety Filter is a Confirmation module included in Loxx's "Giga Kaleidoscope Modularized Trading System".
█ Giga Kaleidoscope Modularized Trading System
What is Loxx's "Giga Kaleidoscope Modularized Trading System"?
The Giga Kaleidoscope Modularized Trading System is a trading system built on the philosophy of the NNFX (No Nonsense Forex) algorithmic trading.
What is the NNFX algorithmic trading strategy?
The NNFX (No-Nonsense Forex) trading system is a comprehensive approach to Forex trading that is designed to simplify the process and remove the confusion and complexity that often surrounds trading. The system was developed by a Forex trader who goes by the pseudonym "VP" and has gained a significant following in the Forex community.
The NNFX trading system is based on a set of rules and guidelines that help traders make objective and informed decisions. These rules cover all aspects of trading, including market analysis, trade entry, stop loss placement, and trade management.
Here are the main components of the NNFX trading system:
1. Trading Philosophy: The NNFX trading system is based on the idea that successful trading requires a comprehensive understanding of the market, objective analysis, and strict risk management. The system aims to remove subjective elements from trading and focuses on objective rules and guidelines.
2. Technical Analysis: The NNFX trading system relies heavily on technical analysis and uses a range of indicators to identify high-probability trading opportunities. The system uses a combination of trend-following and mean-reverting strategies to identify trades.
3. Market Structure: The NNFX trading system emphasizes the importance of understanding the market structure, including price action, support and resistance levels, and market cycles. The system uses a range of tools to identify the market structure, including trend lines, channels, and moving averages.
4. Trade Entry: The NNFX trading system has strict rules for trade entry. The system uses a combination of technical indicators to identify high-probability trades, and traders must meet specific criteria to enter a trade.
5. Stop Loss Placement: The NNFX trading system places a significant emphasis on risk management and requires traders to place a stop loss order on every trade. The system uses a combination of technical analysis and market structure to determine the appropriate stop loss level.
6. Trade Management: The NNFX trading system has specific rules for managing open trades. The system aims to minimize risk and maximize profit by using a combination of trailing stops, take profit levels, and position sizing.
Overall, the NNFX trading system is designed to be a straightforward and easy-to-follow approach to Forex trading that can be applied by traders of all skill levels.
Core components of an NNFX algorithmic trading strategy
The NNFX algorithm is built on the principles of trend, momentum, and volatility. There are six core components in the NNFX trading algorithm:
1. Volatility - price volatility; e.g., Average True Range, True Range Double, Close-to-Close, etc.
2. Baseline - a moving average to identify price trend
3. Confirmation 1 - a technical indicator used to identify trends
4. Confirmation 2 - a technical indicator used to identify trends
5. Continuation - a technical indicator used to identify trends
6. Volatility/Volume - a technical indicator used to identify volatility/volume breakouts/breakdown
7. Exit - a technical indicator used to determine when a trend is exhausted
What is Volatility in the NNFX trading system?
In the NNFX (No Nonsense Forex) trading system, ATR (Average True Range) is typically used to measure the volatility of an asset. It is used as a part of the system to help determine the appropriate stop loss and take profit levels for a trade. ATR is calculated by taking the average of the true range values over a specified period.
True range is calculated as the maximum of the following values:
-Current high minus the current low
-Absolute value of the current high minus the previous close
-Absolute value of the current low minus the previous close
ATR is a dynamic indicator that changes with changes in volatility. As volatility increases, the value of ATR increases, and as volatility decreases, the value of ATR decreases. By using ATR in NNFX system, traders can adjust their stop loss and take profit levels according to the volatility of the asset being traded. This helps to ensure that the trade is given enough room to move, while also minimizing potential losses.
Other types of volatility include True Range Double (TRD), Close-to-Close, and Garman-Klass
What is a Baseline indicator?
The baseline is essentially a moving average, and is used to determine the overall direction of the market.
The baseline in the NNFX system is used to filter out trades that are not in line with the long-term trend of the market. The baseline is plotted on the chart along with other indicators, such as the Moving Average (MA), the Relative Strength Index (RSI), and the Average True Range (ATR).
Trades are only taken when the price is in the same direction as the baseline. For example, if the baseline is sloping upwards, only long trades are taken, and if the baseline is sloping downwards, only short trades are taken. This approach helps to ensure that trades are in line with the overall trend of the market, and reduces the risk of entering trades that are likely to fail.
By using a baseline in the NNFX system, traders can have a clear reference point for determining the overall trend of the market, and can make more informed trading decisions. The baseline helps to filter out noise and false signals, and ensures that trades are taken in the direction of the long-term trend.
What is a Confirmation indicator?
Confirmation indicators are technical indicators that are used to confirm the signals generated by primary indicators. Primary indicators are the core indicators used in the NNFX system, such as the Average True Range (ATR), the Moving Average (MA), and the Relative Strength Index (RSI).
The purpose of the confirmation indicators is to reduce false signals and improve the accuracy of the trading system. They are designed to confirm the signals generated by the primary indicators by providing additional information about the strength and direction of the trend.
Some examples of confirmation indicators that may be used in the NNFX system include the Bollinger Bands, the MACD (Moving Average Convergence Divergence), and the Stochastic Oscillator. These indicators can provide information about the volatility, momentum, and trend strength of the market, and can be used to confirm the signals generated by the primary indicators.
In the NNFX system, confirmation indicators are used in combination with primary indicators and other filters to create a trading system that is robust and reliable. By using multiple indicators to confirm trading signals, the system aims to reduce the risk of false signals and improve the overall profitability of the trades.
What is a Continuation indicator?
In the NNFX (No Nonsense Forex) trading system, a continuation indicator is a technical indicator that is used to confirm a current trend and predict that the trend is likely to continue in the same direction. A continuation indicator is typically used in conjunction with other indicators in the system, such as a baseline indicator, to provide a comprehensive trading strategy.
What is a Volatility/Volume indicator?
Volume indicators, such as the On Balance Volume (OBV), the Chaikin Money Flow (CMF), or the Volume Price Trend (VPT), are used to measure the amount of buying and selling activity in a market. They are based on the trading volume of the market, and can provide information about the strength of the trend. In the NNFX system, volume indicators are used to confirm trading signals generated by the Moving Average and the Relative Strength Index. Volatility indicators include Average Direction Index, Waddah Attar, and Volatility Ratio. In the NNFX trading system, volatility is a proxy for volume and vice versa.
By using volume indicators as confirmation tools, the NNFX trading system aims to reduce the risk of false signals and improve the overall profitability of trades. These indicators can provide additional information about the market that is not captured by the primary indicators, and can help traders to make more informed trading decisions. In addition, volume indicators can be used to identify potential changes in market trends and to confirm the strength of price movements.
What is an Exit indicator?
The exit indicator is used in conjunction with other indicators in the system, such as the Moving Average (MA), the Relative Strength Index (RSI), and the Average True Range (ATR), to provide a comprehensive trading strategy.
The exit indicator in the NNFX system can be any technical indicator that is deemed effective at identifying optimal exit points. Examples of exit indicators that are commonly used include the Parabolic SAR, the Average Directional Index (ADX), and the Chandelier Exit.
The purpose of the exit indicator is to identify when a trend is likely to reverse or when the market conditions have changed, signaling the need to exit a trade. By using an exit indicator, traders can manage their risk and prevent significant losses.
In the NNFX system, the exit indicator is used in conjunction with a stop loss and a take profit order to maximize profits and minimize losses. The stop loss order is used to limit the amount of loss that can be incurred if the trade goes against the trader, while the take profit order is used to lock in profits when the trade is moving in the trader's favor.
Overall, the use of an exit indicator in the NNFX trading system is an important component of a comprehensive trading strategy. It allows traders to manage their risk effectively and improve the profitability of their trades by exiting at the right time.
How does Loxx's GKD (Giga Kaleidoscope Modularized Trading System) implement the NNFX algorithm outlined above?
Loxx's GKD v1.0 system has five types of modules (indicators/strategies). These modules are:
1. GKD-BT - Backtesting module (Volatility, Number 1 in the NNFX algorithm)
2. GKD-B - Baseline module (Baseline and Volatility/Volume, Numbers 1 and 2 in the NNFX algorithm)
3. GKD-C - Confirmation 1/2 and Continuation module (Confirmation 1/2 and Continuation, Numbers 3, 4, and 5 in the NNFX algorithm)
4. GKD-V - Volatility/Volume module (Confirmation 1/2, Number 6 in the NNFX algorithm)
5. GKD-E - Exit module (Exit, Number 7 in the NNFX algorithm)
(additional module types will added in future releases)
Each module interacts with every module by passing data between modules. Data is passed between each module as described below:
GKD-B => GKD-V => GKD-C(1) => GKD-C(2) => GKD-C(Continuation) => GKD-E => GKD-BT
That is, the Baseline indicator passes its data to Volatility/Volume. The Volatility/Volume indicator passes its values to the Confirmation 1 indicator. The Confirmation 1 indicator passes its values to the Confirmation 2 indicator. The Confirmation 2 indicator passes its values to the Continuation indicator. The Continuation indicator passes its values to the Exit indicator, and finally, the Exit indicator passes its values to the Backtest strategy.
This chaining of indicators requires that each module conform to Loxx's GKD protocol, therefore allowing for the testing of every possible combination of technical indicators that make up the six components of the NNFX algorithm.
What does the application of the GKD trading system look like?
Example trading system:
Backtest: Strategy with 1-3 take profits, trailing stop loss, multiple types of PnL volatility, and 2 backtesting styles
Baseline: Hull Moving Average
Volatility/Volume: Hurst Exponent
Confirmation 1: Variety Stepped, Variety Filter as shown on the chart above
Confirmation 2: Williams Percent Range
Continuation: Fisher Transform
Exit: Rex Oscillator
Each GKD indicator is denoted with a module identifier of either: GKD-BT, GKD-B, GKD-C, GKD-V, or GKD-E. This allows traders to understand to which module each indicator belongs and where each indicator fits into the GKD protocol chain.
Giga Kaleidoscope Modularized Trading System Signals (based on the NNFX algorithm)
Standard Entry
1. GKD-C Confirmation 1 Signal
2. GKD-B Baseline agrees
3. Price is within a range of 0.2x Volatility and 1.0x Volatility of the Goldie Locks Mean
4. GKD-C Confirmation 2 agrees
5. GKD-V Volatility/Volume agrees
Baseline Entry
1. GKD-B Baseline signal
2. GKD-C Confirmation 1 agrees
3. Price is within a range of 0.2x Volatility and 1.0x Volatility of the Goldie Locks Mean
4. GKD-C Confirmation 2 agrees
5. GKD-V Volatility/Volume agrees
6. GKD-C Confirmation 1 signal was less than 7 candles prior
Continuation Entry
1. Standard Entry, Baseline Entry, or Pullback; entry triggered previously
2. GKD-B Baseline hasn't crossed since entry signal trigger
3. GKD-C Confirmation Continuation Indicator signals
4. GKD-C Confirmation 1 agrees
5. GKD-B Baseline agrees
6. GKD-C Confirmation 2 agrees
1-Candle Rule Standard Entry
1. GKD-C Confirmation 1 signal
2. GKD-B Baseline agrees
3. Price is within a range of 0.2x Volatility and 1.0x Volatility of the Goldie Locks Mean
Next Candle:
1. Price retraced (Long: close < close or Short: close > close )
2. GKD-B Baseline agrees
3. GKD-C Confirmation 1 agrees
4. GKD-C Confirmation 2 agrees
5. GKD-V Volatility/Volume agrees
1-Candle Rule Baseline Entry
1. GKD-B Baseline signal
2. GKD-C Confirmation 1 agrees
3. Price is within a range of 0.2x Volatility and 1.0x Volatility of the Goldie Locks Mean
4. GKD-C Confirmation 1 signal was less than 7 candles prior
Next Candle:
1. Price retraced (Long: close < close or Short: close > close )
2. GKD-B Baseline agrees
3. GKD-C Confirmation 1 agrees
4. GKD-C Confirmation 2 agrees
5. GKD-V Volatility/Volume Agrees
PullBack Entry
1. GKD-B Baseline signal
2. GKD-C Confirmation 1 agrees
3. Price is beyond 1.0x Volatility of Baseline
Next Candle:
1. Price is within a range of 0.2x Volatility and 1.0x Volatility of the Goldie Locks Mean
3. GKD-C Confirmation 1 agrees
4. GKD-C Confirmation 2 agrees
5. GKD-V Volatility/Volume Agrees
█ GKD-C Variety Stepped, Variety Filter
Variety Stepped, Variety Filter is an indicator that uses various types of stepping behavior to reduce false signals. This indicator includes 5+ volatility stepping types and 60+ moving averages.
Stepping calculations
First off, you can filter by both price and/or MA output. Both price and MA output can be filtered/stepped in their own way. You'll see two selectors in the input settings. Default is ATR ATR. Here's how stepping works in simple terms: if the price/MA output doesn't move by X deviations, then revert to the price/MA output one bar back.
ATR
The average true range (ATR) is a technical analysis indicator, introduced by market technician J. Welles Wilder Jr. in his book New Concepts in Technical Trading Systems, that measures market volatility by decomposing the entire range of an asset price for that period.
Standard Deviation
Standard deviation is a statistic that measures the dispersion of a dataset relative to its mean and is calculated as the square root of the variance. The standard deviation is calculated as the square root of variance by determining each data point's deviation relative to the mean. If the data points are further from the mean, there is a higher deviation within the data set; thus, the more spread out the data, the higher the standard deviation.
Adaptive Deviation
By definition, the Standard Deviation (STD, also represented by the Greek letter sigma σ or the Latin letter s) is a measure that is used to quantify the amount of variation or dispersion of a set of data values. In technical analysis we usually use it to measure the level of current volatility .
Standard Deviation is based on Simple Moving Average calculation for mean value. This version of standard deviation uses the properties of EMA to calculate what can be called a new type of deviation, and since it is based on EMA , we can call it EMA deviation. And added to that, Perry Kaufman's efficiency ratio is used to make it adaptive (since all EMA type calculations are nearly perfect for adapting).
The difference when compared to standard is significant--not just because of EMA usage, but the efficiency ratio makes it a "bit more logical" in very volatile market conditions.
See how this compares to Standard Devaition here:
Adaptive Deviation
Median Absolute Deviation
The median absolute deviation is a measure of statistical dispersion. Moreover, the MAD is a robust statistic, being more resilient to outliers in a data set than the standard deviation. In the standard deviation, the distances from the mean are squared, so large deviations are weighted more heavily, and thus outliers can heavily influence it. In the MAD, the deviations of a small number of outliers are irrelevant.
Because the MAD is a more robust estimator of scale than the sample variance or standard deviation, it works better with distributions without a mean or variance, such as the Cauchy distribution.
For this indicator, I used a manual recreation of the quantile function in Pine Script. This is so users have a full inside view into how this is calculated.
Efficiency-Ratio Adaptive ATR
Average True Range (ATR) is widely used indicator in many occasions for technical analysis . It is calculated as the RMA of true range. This version adds a "twist": it uses Perry Kaufman's Efficiency Ratio to calculate adaptive true range
See how this compares to ATR here:
ER-Adaptive ATR
Mean Absolute Deviation
The mean absolute deviation (MAD) is a measure of variability that indicates the average distance between observations and their mean. MAD uses the original units of the data, which simplifies interpretation. Larger values signify that the data points spread out further from the average. Conversely, lower values correspond to data points bunching closer to it. The mean absolute deviation is also known as the mean deviation and average absolute deviation.
This definition of the mean absolute deviation sounds similar to the standard deviation ( SD ). While both measure variability, they have different calculations. In recent years, some proponents of MAD have suggested that it replace the SD as the primary measure because it is a simpler concept that better fits real life.
For Pine Coders, this is equivalent of using ta.dev()
Included Filters
Adaptive Moving Average - AMA
ADXvma - Average Directional Volatility Moving Average
Ahrens Moving Average
Alexander Moving Average - ALXMA
Deviation Scaled Moving Average - DSMA
Donchian
Double Exponential Moving Average - DEMA
Double Smoothed Exponential Moving Average - DSEMA
Double Smoothed FEMA - DSFEMA
Double Smoothed Range Weighted EMA - DSRWEMA
Double Smoothed Wilders EMA - DSWEMA
Double Weighted Moving Average - DWMA
Ehlers Optimal Tracking Filter - EOTF
Exponential Moving Average - EMA
Fast Exponential Moving Average - FEMA
Fractal Adaptive Moving Average - FRAMA
Generalized DEMA - GDEMA
Generalized Double DEMA - GDDEMA
Hull Moving Average (Type 1) - HMA1
Hull Moving Average (Type 2) - HMA2
Hull Moving Average (Type 3) - HMA3
Hull Moving Average (Type 4) - HMA4
IE /2 - Early T3 by Tim Tilson
Integral of Linear Regression Slope - ILRS
Instantaneous Trendline
Kalman Filter
Kaufman Adaptive Moving Average - KAMA
Laguerre Filter
Leader Exponential Moving Average
Linear Regression Value - LSMA ( Least Squares Moving Average )
Linear Weighted Moving Average - LWMA
McGinley Dynamic
McNicholl EMA
Non-Lag Moving Average
Ocean NMA Moving Average - ONMAMA
Parabolic Weighted Moving Average
Probability Density Function Moving Average - PDFMA
Quadratic Regression Moving Average - QRMA
Regularized EMA - REMA
Range Weighted EMA - RWEMA
Recursive Moving Trendline
Simple Decycler - SDEC
Simple Jurik Moving Average - SJMA
Simple Moving Average - SMA
Sine Weighted Moving Average
Smoothed LWMA - SLWMA
Smoothed Moving Average - SMMA
Smoother
Super Smoother
T3
Three-pole Ehlers Butterworth
Three-pole Ehlers Smoother
Triangular Moving Average - TMA
Triple Exponential Moving Average - TEMA
Two-pole Ehlers Butterworth
Two-pole Ehlers smoother
Variable Index Dynamic Average - VIDYA
Variable Moving Average - VMA
Volume Weighted EMA - VEMA
Volume Weighted Moving Average - VWMA
Zero-Lag DEMA - Zero Lag Exponential Moving Average
Zero-Lag Moving Average
Zero Lag TEMA - Zero Lag Triple Exponential Moving Average
Adaptive Moving Average - AMA
Description. The Adaptive Moving Average (AMA) is a moving average that changes its sensitivity to price moves depending on the calculated volatility . It becomes more sensitive during periods when the price is moving smoothly in a certain direction and becomes less sensitive when the price is volatile.
ADXvma - Average Directional Volatility Moving Average
Linnsoft's ADXvma formula is a volatility-based moving average, with the volatility being determined by the value of the ADX indicator.
The ADXvma has the SMA in Chande's CMO replaced with an EMA , it then uses a few more layers of EMA smoothing before the "Volatility Index" is calculated.
A side effect is, those additional layers slow down the ADXvma when you compare it to Chande's Variable Index Dynamic Average VIDYA .
The ADXVMA provides support during uptrends and resistance during downtrends and will stay flat for longer, but will create some of the most accurate market signals when it decides to move.
Ahrens Moving Average
Richard D. Ahrens's Moving Average promises "Smoother Data" that isn't influenced by the occasional price spike. It works by using the Open and the Close in his formula so that the only time the Ahrens Moving Average will change is when the candlestick is either making new highs or new lows.
Alexander Moving Average - ALXMA
This Moving Average uses an elaborate smoothing formula and utilizes a 7 period Moving Average. It corresponds to fitting a second-order polynomial to seven consecutive observations. This moving average is rarely used in trading but is interesting as this Moving Average has been applied to diffusion indexes that tend to be very volatile.
Deviation Scaled Moving Average - DSMA
The Deviation-Scaled Moving Average is a data smoothing technique that acts like an exponential moving average with a dynamic smoothing coefficient. The smoothing coefficient is automatically updated based on the magnitude of price changes. In the Deviation-Scaled Moving Average, the standard deviation from the mean is chosen to be the measure of this magnitude. The resulting indicator provides substantial smoothing of the data even when price changes are small while quickly adapting to these changes.
Donchian
Donchian Channels are three lines generated by moving average calculations that comprise an indicator formed by upper and lower bands around a midrange or median band. The upper band marks the highest price of a security over N periods while the lower band marks the lowest price of a security over N periods.
Double Exponential Moving Average - DEMA
The Double Exponential Moving Average ( DEMA ) combines a smoothed EMA and a single EMA to provide a low-lag indicator. It's primary purpose is to reduce the amount of "lagging entry" opportunities, and like all Moving Averages, the DEMA confirms uptrends whenever price crosses on top of it and closes above it, and confirms downtrends when the price crosses under it and closes below it - but with significantly less lag.
Double Smoothed Exponential Moving Average - DSEMA
The Double Smoothed Exponential Moving Average is a lot less laggy compared to a traditional EMA . It's also considered a leading indicator compared to the EMA , and is best utilized whenever smoothness and speed of reaction to market changes are required.
Double Smoothed FEMA - DSFEMA
Same as the Double Exponential Moving Average ( DEMA ), but uses a faster version of EMA for its calculation.
Double Smoothed Range Weighted EMA - DSRWEMA
Range weighted exponential moving average ( EMA ) is, unlike the "regular" range weighted average calculated in a different way. Even though the basis - the range weighting - is the same, the way how it is calculated is completely different. By definition this type of EMA is calculated as a ratio of EMA of price*weight / EMA of weight. And the results are very different and the two should be considered as completely different types of averages. The higher than EMA to price changes responsiveness when the ranges increase remains in this EMA too and in those cases this EMA is clearly leading the "regular" EMA . This version includes double smoothing.
Double Smoothed Wilders EMA - DSWEMA
Welles Wilder was frequently using one "special" case of EMA ( Exponential Moving Average ) that is due to that fact (that he used it) sometimes called Wilder's EMA . This version is adding double smoothing to Wilder's EMA in order to make it "faster" (it is more responsive to market prices than the original) and is still keeping very smooth values.
Double Weighted Moving Average - DWMA
Double weighted moving average is an LWMA (Linear Weighted Moving Average ). Instead of doing one cycle for calculating the LWMA, the indicator is made to cycle the loop 2 times. That produces a smoother values than the original LWMA
Ehlers Optimal Tracking Filter - EOTF
The Elher's Optimum Tracking Filter quickly adjusts rapid shifts in the price and yet is relatively smooth when the price has a sideways action. The operation of this filter is similar to Kaufman’s Adaptive Moving
Average
Exponential Moving Average - EMA
The EMA places more significance on recent data points and moves closer to price than the SMA ( Simple Moving Average ). It reacts faster to volatility due to its emphasis on recent data and is known for its ability to give greater weight to recent and more relevant data. The EMA is therefore seen as an enhancement over the SMA .
Fast Exponential Moving Average - FEMA
An Exponential Moving Average with a short look-back period.
Fractal Adaptive Moving Average - FRAMA
The Fractal Adaptive Moving Average by John Ehlers is an intelligent adaptive Moving Average which takes the importance of price changes into account and follows price closely enough to display significant moves whilst remaining flat if price ranges. The FRAMA does this by dynamically adjusting the look-back period based on the market's fractal geometry.
Generalized DEMA - GDEMA
The double exponential moving average ( DEMA ), was developed by Patrick Mulloy in an attempt to reduce the amount of lag time found in traditional moving averages. It was first introduced in the February 1994 issue of the magazine Technical Analysis of Stocks & Commodities in Mulloy's article "Smoothing Data with Faster Moving Averages.". Instead of using fixed multiplication factor in the final DEMA formula, the generalized version allows you to change it. By varying the "volume factor" form 0 to 1 you apply different multiplications and thus producing DEMA with different "speed" - the higher the volume factor is the "faster" the DEMA will be (but also the slope of it will be less smooth). The volume factor is limited in the calculation to 1 since any volume factor that is larger than 1 is increasing the overshooting to the extent that some volume factors usage makes the indicator unusable.
Generalized Double DEMA - GDDEMA
The double exponential moving average ( DEMA ), was developed by Patrick Mulloy in an attempt to reduce the amount of lag time found in traditional moving averages. It was first introduced in the February 1994 issue of the magazine Technical Analysis of Stocks & Commodities in Mulloy's article "Smoothing Data with Faster Moving Averages''. This is an extension of the Generalized DEMA using Tim Tillsons (the inventor of T3) idea, and is using GDEMA of GDEMA for calculation (which is the "middle step" of T3 calculation). Since there are no versions showing that middle step, this version covers that too. The result is smoother than Generalized DEMA , but is less smooth than T3 - one has to do some experimenting in order to find the optimal way to use it, but in any case, since it is "faster" than the T3 (Tim Tillson T3) and still smooth, it looks like a good compromise between speed and smoothness.
Hull Moving Average (Type 1) - HMA1
Alan Hull's HMA makes use of weighted moving averages to prioritize recent values and greatly reduce lag whilst maintaining the smoothness of a traditional Moving Average. For this reason, it's seen as a well-suited Moving Average for identifying entry points. This version uses SMA for smoothing.
Hull Moving Average (Type 2) - HMA2
Alan Hull's HMA makes use of weighted moving averages to prioritize recent values and greatly reduce lag whilst maintaining the smoothness of a traditional Moving Average. For this reason, it's seen as a well-suited Moving Average for identifying entry points. This version uses EMA for smoothing.
Hull Moving Average (Type 3) - HMA3
Alan Hull's HMA makes use of weighted moving averages to prioritize recent values and greatly reduce lag whilst maintaining the smoothness of a traditional Moving Average. For this reason, it's seen as a well-suited Moving Average for identifying entry points. This version uses LWMA for smoothing.
Hull Moving Average (Type 4) - HMA4
Alan Hull's HMA makes use of weighted moving averages to prioritize recent values and greatly reduce lag whilst maintaining the smoothness of a traditional Moving Average. For this reason, it's seen as a well-suited Moving Average for identifying entry points. This version uses SMMA for smoothing.
IE /2 - Early T3 by Tim Tilson and T3 new
T3 is basically an EMA on steroids, You can read about T3 here:
T3 Striped
Integral of Linear Regression Slope - ILRS
A Moving Average where the slope of a linear regression line is simply integrated as it is fitted in a moving window of length N (natural numbers in maths) across the data. The derivative of ILRS is the linear regression slope. ILRS is not the same as a SMA ( Simple Moving Average ) of length N, which is actually the midpoint of the linear regression line as it moves across the data.
Instantaneous Trendline
The Instantaneous Trendline is created by removing the dominant cycle component from the price information which makes this Moving Average suitable for medium to long-term trading.
Kalman Filter
Kalman filter is an algorithm that uses a series of measurements observed over time, containing statistical noise and other inaccuracies. This means that the filter was originally designed to work with noisy data. Also, it is able to work with incomplete data. Another advantage is that it is designed for and applied in dynamic systems; our price chart belongs to such systems. This version is true to the original design of the trade-ready Kalman Filter where velocity is the triggering mechanism.
Kalman Filter is a more accurate smoothing/prediction algorithm than the moving average because it is adaptive: it accounts for estimation errors and tries to adjust its predictions from the information it learned in the previous stage. Theoretically, Kalman Filter consists of measurement and transition components.
Kaufman Adaptive Moving Average - KAMA
Developed by Perry Kaufman, Kaufman's Adaptive Moving Average ( KAMA ) is a moving average designed to account for market noise or volatility . KAMA will closely follow prices when the price swings are relatively small and the noise is low.
Laguerre Filter
The Laguerre Filter is a smoothing filter which is based on Laguerre polynomials. The filter requires the current price, three prior prices, a user defined factor called Alpha to fill its calculation.
Adjusting the Alpha coefficient is used to increase or decrease its lag and its smoothness.
Leader Exponential Moving Average
The Leader EMA was created by Giorgos E. Siligardos who created a Moving Average which was able to eliminate lag altogether whilst maintaining some smoothness. It was first described during his research paper "MACD Leader" where he applied this to the MACD to improve its signals and remove its lagging issue. This filter uses his leading MACD's "modified EMA" and can be used as a zero lag filter.
Linear Regression Value - LSMA ( Least Squares Moving Average )
LSMA as a Moving Average is based on plotting the end point of the linear regression line. It compares the current value to the prior value and a determination is made of a possible trend, eg. the linear regression line is pointing up or down.
Linear Weighted Moving Average - LWMA
LWMA reacts to price quicker than the SMA and EMA . Although it's similar to the Simple Moving Average , the difference is that a weight coefficient is multiplied to the price which means the most recent price has the highest weighting, and each prior price has progressively less weight. The weights drop in a linear fashion.
McGinley Dynamic
John McGinley created this Moving Average to track prices better than traditional Moving Averages. It does this by incorporating an automatic adjustment factor into its formula, which speeds (or slows) the indicator in trending, or ranging, markets.
McNicholl EMA
Dennis McNicholl developed this Moving Average to use as his center line for his "Better Bollinger Bands" indicator and was successful because it responded better to volatility changes over the standard SMA and managed to avoid common whipsaws.
Non-lag moving average
The Non Lag Moving average follows price closely and gives very quick signals as well as early signals of price change. As a standalone Moving Average, it should not be used on its own, but as an additional confluence tool for early signals.
Ocean NMA Moving Average - ONMAMA
Created by Jim Sloman, the NMA is a moving average that automatically adjusts to volatility without being programmed to do so. For more info, read his guide "Ocean Theory, an Introduction"
Parabolic Weighted Moving Average
The Parabolic Weighted Moving Average is a variation of the Linear Weighted Moving Average . The Linear Weighted Moving Average calculates the average by assigning different weights to each element in its calculation. The Parabolic Weighted Moving Average is a variation that allows weights to be changed to form a parabolic curve. It is done simply by using the Power parameter of this indicator.
Probability Density Function Moving Average - PDFMA
Probability density function based MA is a sort of weighted moving average that uses probability density function to calculate the weights. By its nature it is similar to a lot of digital filters.
Quadratic Regression Moving Average - QRMA
A quadratic regression is the process of finding the equation of the parabola that best fits a set of data. This moving average is an obscure concept that was posted to Forex forums in around 2008.
Regularized EMA - REMA
The regularized exponential moving average (REMA) by Chris Satchwell is a variation on the EMA (see Exponential Moving Average ) designed to be smoother but not introduce too much extra lag.
Range Weighted EMA - RWEMA
This indicator is a variation of the range weighted EMA . The variation comes from a possible need to make that indicator a bit less "noisy" when it comes to slope changes. The method used for calculating this variation is the method described by Lee Leibfarth in his article "Trading With An Adaptive Price Zone".
Recursive Moving Trendline
Dennis Meyers's Recursive Moving Trendline uses a recursive (repeated application of a rule) polynomial fit, a technique that uses a small number of past values estimations of price and today's price to predict tomorrow's price.
Simple Decycler - SDEC
The Ehlers Simple Decycler study is a virtually zero-lag technical indicator proposed by John F. Ehlers . The original idea behind this study (and several others created by John F. Ehlers ) is that market data can be considered a continuum of cycle periods with different cycle amplitudes. Thus, trending periods can be considered segments of longer cycles, or, in other words, low-frequency segments. Applying the right filter might help identify these segments.
Simple Loxx Moving Average - SLMA
A three stage moving average combining an adaptive EMA , a Kalman Filter, and a Kauffman adaptive filter.
Simple Moving Average - SMA
The SMA calculates the average of a range of prices by adding recent prices and then dividing that figure by the number of time periods in the calculation average. It is the most basic Moving Average which is seen as a reliable tool for starting off with Moving Average studies. As reliable as it may be, the basic moving average will work better when it's enhanced into an EMA .
Sine Weighted Moving Average
The Sine Weighted Moving Average assigns the most weight at the middle of the data set. It does this by weighting from the first half of a Sine Wave Cycle and the most weighting is given to the data in the middle of that data set. The Sine WMA closely resembles the TMA (Triangular Moving Average).
Smoothed LWMA - SLWMA
A smoothed version of the LWMA
Smoothed Moving Average - SMMA
The Smoothed Moving Average is similar to the Simple Moving Average ( SMA ), but aims to reduce noise rather than reduce lag. SMMA takes all prices into account and uses a long lookback period. Due to this, it's seen as an accurate yet laggy Moving Average.
Smoother
The Smoother filter is a faster-reacting smoothing technique which generates considerably less lag than the SMMA ( Smoothed Moving Average ). It gives earlier signals but can also create false signals due to its earlier reactions. This filter is sometimes wrongly mistaken for the superior Jurik Smoothing algorithm.
Super Smoother
The Super Smoother filter uses John Ehlers’s “Super Smoother” which consists of a Two pole Butterworth filter combined with a 2-bar SMA ( Simple Moving Average ) that suppresses the 22050 Hz Nyquist frequency: A characteristic of a sampler, which converts a continuous function or signal into a discrete sequence.
Three-pole Ehlers Butterworth
The 3 pole Ehlers Butterworth (as well as the Two pole Butterworth) are both superior alternatives to the EMA and SMA . They aim at producing less lag whilst maintaining accuracy. The 2 pole filter will give you a better approximation for price, whereas the 3 pole filter has superior smoothing.
Three-pole Ehlers Smoother
The 3 pole Ehlers smoother works almost as close to price as the above mentioned 3 Pole Ehlers Butterworth. It acts as a strong baseline for signals but removes some noise. Side by side, it hardly differs from the Three Pole Ehlers Butterworth but when examined closely, it has better overshoot reduction compared to the 3 pole Ehlers Butterworth.
Triangular Moving Average - TMA
The TMA is similar to the EMA but uses a different weighting scheme. Exponential and weighted Moving Averages will assign weight to the most recent price data. Simple moving averages will assign the weight equally across all the price data. With a TMA (Triangular Moving Average), it is double smoother (averaged twice) so the majority of the weight is assigned to the middle portion of the data.
Triple Exponential Moving Average - TEMA
The TEMA uses multiple EMA calculations as well as subtracting lag to create a tool which can be used for scalping pullbacks. As it follows price closely, its signals are considered very noisy and should only be used in extremely fast-paced trading conditions.
Two-pole Ehlers Butterworth
The 2 pole Ehlers Butterworth (as well as the three pole Butterworth mentioned above) is another filter that cuts out the noise and follows the price closely. The 2 pole is seen as a faster, leading filter over the 3 pole and follows price a bit more closely. Analysts will utilize both a 2 pole and a 3 pole Butterworth on the same chart using the same period, but having both on chart allows its crosses to be traded.
Two-pole Ehlers Smoother
A smoother version of the Two pole Ehlers Butterworth. This filter is the faster version out of the 3 pole Ehlers Butterworth. It does a decent job at cutting out market noise whilst emphasizing a closer following to price over the 3 pole Ehlers .
Variable Index Dynamic Average - VIDYA
Variable Index Dynamic Average Technical Indicator ( VIDYA ) was developed by Tushar Chande. It is an original method of calculating the Exponential Moving Average ( EMA ) with the dynamically changing period of averaging.
Variable Moving Average - VMA
The Variable Moving Average (VMA) is a study that uses an Exponential Moving Average being able to automatically adjust its smoothing factor according to the market volatility .
Volume Weighted EMA - VEMA
An EMA that uses a volume and price weighted calculation instead of the standard price input.
Volume Weighted Moving Average - VWMA
A Volume Weighted Moving Average is a moving average where more weight is given to bars with heavy volume than with light volume . Thus the value of the moving average will be closer to where most trading actually happened than it otherwise would be without being volume weighted.
Zero-Lag DEMA - Zero Lag Double Exponential Moving Average
John Ehlers's Zero Lag DEMA's aim is to eliminate the inherent lag associated with all trend following indicators which average a price over time. Because this is a Double Exponential Moving Average with Zero Lag, it has a tendency to overshoot and create a lot of false signals for swing trading. It can however be used for quick scalping or as a secondary indicator for confluence.
Zero-Lag Moving Average
The Zero Lag Moving Average is described by its creator, John Ehlers , as a Moving Average with absolutely no delay. And it's for this reason that this filter will cause a lot of abrupt signals which will not be ideal for medium to long-term traders. This filter is designed to follow price as close as possible whilst de-lagging data instead of basing it on regular data. The way this is done is by attempting to remove the cumulative effect of the Moving Average.
Zero-Lag TEMA - Zero Lag Triple Exponential Moving Average
Just like the Zero Lag DEMA , this filter will give you the fastest signals out of all the Zero Lag Moving Averages. This is useful for scalping but dangerous for medium to long-term traders, especially during market Volatility and news events. Having no lag, this filter also has no smoothing in its signals and can cause some very bizarre behavior when applied to certain indicators.
Requirements
Inputs
Confirmation 1 and Solo Confirmation: GKD-V Volatility / Volume indicator
Confirmation 2: GKD-C Confirmation indicator
Outputs
Confirmation 2 and Solo Confirmation Complex: GKD-E Exit indicator
Confirmation 1: GKD-C Confirmation indicator
Continuation: GKD-E Exit indicator
Solo Confirmation Simple: GKD-BT Backtest strategy
Additional features will be added in future releases.
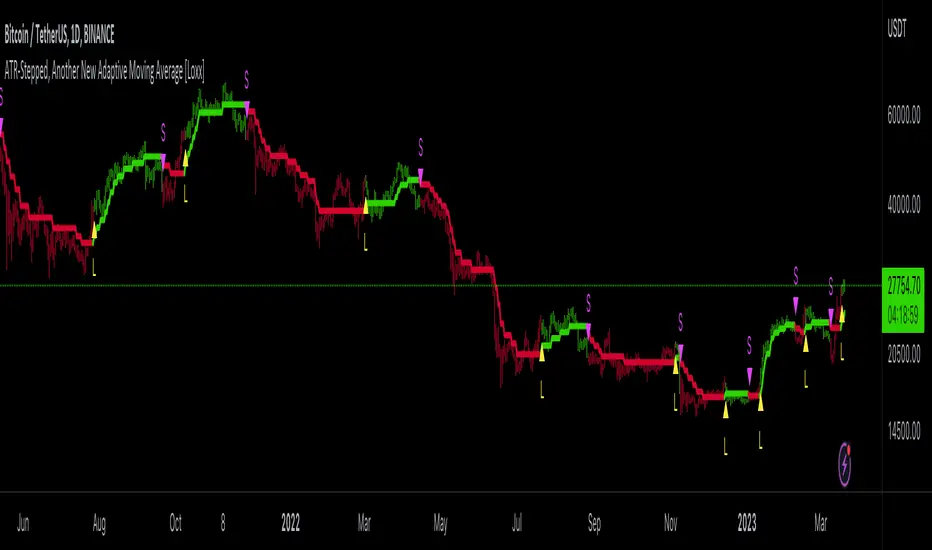
ATR-Stepped, Another New Adaptive Moving Average [Loxx]ATR-Filtered, Another New Adaptive Moving Average is a modification of @cheatcountry's "Another New Adaptive Moving Average " shown below
I've added AT- stepped filtering. This is a standard ATR filter that works by requiring movement by XX multiple of ATR before registering a trend flip. I've also included Loxx's Expanded Source Types. You can read about those here:
From @cheatcountry on A New Adaptive Moving Average
The New Adaptive Moving Average was created by Scott Cong (Stocks and Commodities Mar 2023) and this is a companion indicator to my previous script
This indicator still works off of the same concept as before with effort vs results but this indicator takes a slightly different approach and instead defines results as the absolute difference between the closing price and a closing price x bars ago. As you can see in my chart example, this indicator works great to stay with the current trend and provides either a stop loss or take profit target depending on which direction you are going in. As always, I use darker colors to show stronger signals and lighter colors to show normal signals. Buy when the line turns green and sell when it turns red.
Included
Alerts
Signals
Loxx's Expanded Source Types
Volatility Percentile (H-LINES)A simple script that adjusts the Volatility Percentile Indicator visibly in order to better accommodate entries/exits and certain trading setups/strategies.
--------------------------------------------------------------------------------------------------------------------------------------------------------
TL;DR - Remember after a full reset, we are looking for initial crosses UP on the UpperSwingline and crosses DOWN on the LowerSwingline for primary and secondary signal derivation.
Vice versa also works great but the prior method mentioned is a little more consistent in my experience, but you should mess around and optimise this for your own setups and strategies anyway.
--------------------------------------------------------------------------------------------------------------------------------------------------------
ORIGINAL SCRIPT HERE:
^Click image for a redirect to that script.
ALL CREDIT GOES TO: www.tradingview.com
He wrote everything so give credit where it's due, good bit of kit this here script is.
--------------------------------------------------------------------------------------------------------------------------------------------------------
HOW I USE MY VISUALLY ALTERED VERSION OF THIS SCRIPT
First of all, the alterations I've made seem only to be consistently viable with renko charts though if you can get the sought after results using candles or any other chart type then perfect, but be wary. All my back-testing done only with LinReg, HMA and SWMA - ATR type settings exclusively on renko charts. The changes I've made to the original script essentially just turns it visibly into an oscillator and uses a couple horizontal lines to generate signals, very simple - absolutely nothing has changed in the actual code of calculating this indicator.
What I believe my adjustments have achieved is quite simple. A full reset/oscillation on the indicator tries to map the strongest parts of a move or at least the part of the move where volume and the rate of transactions is at its peak to even facilitate said move. *take this statement with a pinch of salt though I do believe it's interacting with accumulation/distribution patterns, which is expected of volatility*
For ease of communication let's refer to the area between the the first UpperSwingline cross to the subsequent LowerSwingline cross, as the primary move. Then afterwards when it crosses the UpperSwingline again to make the full reset, the area in between those two points referred to as the secondary move.
Though more interestingly/practically the indicator ends up giving you two signals. In order for this to work we have to first decide that a spike up in volatility which crosses the UpperSwingline implies a significant level of interest at that price level. Usually that means a reversal is brewing, if price has already moved, trended and is approaching a certain area of value; which causes a spike of new positions to be taken, then you know that this is a level where contrarians are looking to enter. Now here's the tricky part, when volatility crosses the LowerSwingline price action becomes a little more open for interpretation, the way I personally like to look at this secondary signal is the potential for an exhaustion period to prolong itself a little longer. I know that's not the perfect analysis for what's going on, a more in-depth look into what's going on would best be described using Elliott Wave Theory, if a cross on the UpperSwingline near a significant area of value gives us a reversal trade lets just assume for the sake of argument that a new Elliott Wave can begin forming here. Making the move from that initial UpperSwngline cross to the cross on the LowerSwingline, the area that encompasses those two points: the impulse wave. After this point my analogy kind of falls apart and sadly my knowledge just isn't what it needs to be in order for me to properly analyse what's going on here but I must digress. Price after crossing the LowerSwingline up until the point where it makes a full reset by crossing the UpperSwingline again, within this area price seems to do either one of two things:
Situation 1 - Most likely occurs after a major trend reversal from major support/resistance or area of value (price has trended to new territory, maybe spent time a little time consolidating but hasn't broken the key level, momentum shifts, price action breaks current structure and you get the signal that primary move is a reversal) = Exhaustion Period, price will continue in direction of primary move during the secondary move. This here is for our trend-followers, you wanna take a continuation trade? Just wait for the pullback/rally to hit a FiB retracement level and enter - or any other means to find a decent support/resistance to enter.
Situation 2 - Most likely occurs when market enters a range or consolidation (price was previously seen as being at either a discount or premium so Situation 1 could have already played out and now you're looking at a full reset after that, imagine this spot to be the centre line of a linear regression channel or bang in the middle of your range, could even occur if price breaks a key moving average and decides it ought to consolidate around it for a while. Basically at any point where a somewhat prolonged consolidation is expected and not a quick reversal) = Corrective Wave, price will move against the direction of primary move during the secondary move. Now you might be expecting me to say this ones for you reversal traders but not really, if this is occurring then there probably isn't a definitive direction the market has chosen so you can use this opportunity to take range trades in the direction or against the direction of whatever the current trend or latest trend was depending on whatever slight bias you may have. <--- Situation 2 is very useful for finding cleaner entries if you do have a trend bias, say price underwent Situation 1, is now at key moving average but your bias is that it will break and continue up, so you wait and allow the secondary move of Situation 2 to take your entry to a much better R:R before entering a position.
--------------------------------------------------------------------------------------------------------------------------------------------------------

Ladder ATRThis indicator shows the upwards (green) and downward (red) volatility of the market. It is a moving average of the true range values like the ATR indicator does but with a twist! For the upwards volatility, only the green candles are taken into account, and for the downwards only the red candles are.
To the best of my knowledge, this technique had been introduced by HeWhoMustNotBeNamed in his "Supertrend - Ladder ATR" publication where the different types of volatility helped to improve the "trend reversal" conditions compared to the "Supertrend" indicator.
However, the actual "Ladder ATR" values were hard to see. This indicator shows the actual upward and downward volatility making it easy to reason about long and short price moves and potential biases in each direction.
In layman's terms this indicator "Ladder ATR" is to the "Supertrend - Ladder ATR" what the "Average True Range" indicator is to the "Supertrend" indicator.

4C Options Expected Move (Weekly + 0DTE)This indicator plots the calculated Expected Move for BOTH Weekly and Zero Dated Expiration (0DTE) Daily options, for a quick visual reference.
Please Note: This indicator is different from our original "4C Expected Move (Weekly Options)" indicator, as it now packages the ability to ALSO plot 0DTE options expected moves along with Weekly expected moves. Many other newer features have also been implemented.
Background Information
The Expected Move (EM) is the amount that a stock is predicted to increase or decrease from its current price, based on the current level of options pricing and implied volatility.
This range can be viewed as possible support and resistance, or, once price gets outside of the range, institutional hedging actions can accelerate the move in that direction.
It can be useful to know what the weekly EM range is for a stock to understand the probabilities of the overall distance, direction and volatility for the week.
About the Indicator
This indicator plots the calculated Expected Move for BOTH Weekly and Zero Dated Expiration (0DTE) options, for a quick visual reference.
For the weekly EM, the range is based on the Weekly close of the prior week.
For the Daily EM based on 0DTE options, the range is based on the Daily close of the prior day.
The indicator will automatically start a new weekly EM plot at the beginning of the week, and a new daily EM at the beginning of each day.
The EM values must be updated weekly and/or daily.
Features
Plots the EM for the week
Plots the EM for the day, for symbols that offer daily expiration options
Plots the 2 Standard Deviation EM for both the weekly and daily EM
Labels with calculated values are plotted near the levels for quick visual aid
Settings
Can toggle weekly EM on/off
Can toggle Daily EM on/off
Can toggle 2 Standard Deviation lines on/off
Can toggle labels for all EM on/off
Robust line settings
Can adjust label location left/right based on personal preference
Can enter symbol into settings as a reference
Handy instructions in the settings
How To Set Up The Indicator
To use this indicator you must have access to a broker with options data (not available on Tradingview).
Usually, you can look at the stock's option chain to find the weekly expected move.
You will have to do your own research to find where this information is displayed depending on your broker. You may also need to find the information elsewhere if your broker does not have this information.
You can also do your calculation of the EM using the following formula (please do your own research):
Expected Move = Option Price x Implied Volatility x Square Root of Time
See screenshot example below
This is the Thinkorswim platform's option chain, and the Implied Volatility % and the calculated EM are on the right side of the option chain.
The Expected Move is circled in blue. Use the +- number in parentheses, NOT the % value.
For the weekly EM, input the number that corresponds to the weekly option into the indicator. This must be done on a weekly basis, and It is typically best to use the EM for the next week expiration that is generated AFTER the Friday close and/or before the Monday open of the upcoming week.
For the daily EM, input the number that corresponds to the daily 0DTE option into the indicator. This must be done on a daily basis, and it is typically best to use the EM value for the 0DTE option that is generated the night before (after market close), or before the market opens for that 0DTE. .

GKD-C FDI-Adaptive Supertrend [Loxx]Giga Kaleidoscope GKD-C FDI-Adaptive Supertrend is a Volatility/Volume module included in Loxx's "Giga Kaleidoscope Modularized Trading System".
█ Giga Kaleidoscope Modularized Trading System
What is Loxx's "Giga Kaleidoscope Modularized Trading System"?
The Giga Kaleidoscope Modularized Trading System is a trading system built on the philosophy of the NNFX (No Nonsense Forex) algorithmic trading.
What is the NNFX algorithmic trading strategy?
The NNFX (No-Nonsense Forex) trading system is a comprehensive approach to Forex trading that is designed to simplify the process and remove the confusion and complexity that often surrounds trading. The system was developed by a Forex trader who goes by the pseudonym "VP" and has gained a significant following in the Forex community.
The NNFX trading system is based on a set of rules and guidelines that help traders make objective and informed decisions. These rules cover all aspects of trading, including market analysis, trade entry, stop loss placement, and trade management.
Here are the main components of the NNFX trading system:
1. Trading Philosophy: The NNFX trading system is based on the idea that successful trading requires a comprehensive understanding of the market, objective analysis, and strict risk management. The system aims to remove subjective elements from trading and focuses on objective rules and guidelines.
2. Technical Analysis: The NNFX trading system relies heavily on technical analysis and uses a range of indicators to identify high-probability trading opportunities. The system uses a combination of trend-following and mean-reverting strategies to identify trades.
3. Market Structure: The NNFX trading system emphasizes the importance of understanding the market structure, including price action, support and resistance levels, and market cycles. The system uses a range of tools to identify the market structure, including trend lines, channels, and moving averages.
4. Trade Entry: The NNFX trading system has strict rules for trade entry. The system uses a combination of technical indicators to identify high-probability trades, and traders must meet specific criteria to enter a trade.
5. Stop Loss Placement: The NNFX trading system places a significant emphasis on risk management and requires traders to place a stop loss order on every trade. The system uses a combination of technical analysis and market structure to determine the appropriate stop loss level.
6. Trade Management: The NNFX trading system has specific rules for managing open trades. The system aims to minimize risk and maximize profit by using a combination of trailing stops, take profit levels, and position sizing.
Overall, the NNFX trading system is designed to be a straightforward and easy-to-follow approach to Forex trading that can be applied by traders of all skill levels.
Core components of an NNFX algorithmic trading strategy
The NNFX algorithm is built on the principles of trend, momentum, and volatility. There are six core components in the NNFX trading algorithm:
1. Volatility - price volatility; e.g., Average True Range, True Range Double, Close-to-Close, etc.
2. Baseline - a moving average to identify price trend
3. Confirmation 1 - a technical indicator used to identify trends
4. Confirmation 2 - a technical indicator used to identify trends
5. Continuation - a technical indicator used to identify trends
6. Volatility/Volume - a technical indicator used to identify volatility/volume breakouts/breakdown
7. Exit - a technical indicator used to determine when a trend is exhausted
What is Volatility in the NNFX trading system?
In the NNFX (No Nonsense Forex) trading system, ATR (Average True Range) is typically used to measure the volatility of an asset. It is used as a part of the system to help determine the appropriate stop loss and take profit levels for a trade. ATR is calculated by taking the average of the true range values over a specified period.
True range is calculated as the maximum of the following values:
-Current high minus the current low
-Absolute value of the current high minus the previous close
-Absolute value of the current low minus the previous close
ATR is a dynamic indicator that changes with changes in volatility. As volatility increases, the value of ATR increases, and as volatility decreases, the value of ATR decreases. By using ATR in NNFX system, traders can adjust their stop loss and take profit levels according to the volatility of the asset being traded. This helps to ensure that the trade is given enough room to move, while also minimizing potential losses.
Other types of volatility include True Range Double (TRD), Close-to-Close, and Garman-Klass
What is a Baseline indicator?
The baseline is essentially a moving average, and is used to determine the overall direction of the market.
The baseline in the NNFX system is used to filter out trades that are not in line with the long-term trend of the market. The baseline is plotted on the chart along with other indicators, such as the Moving Average (MA), the Relative Strength Index (RSI), and the Average True Range (ATR).
Trades are only taken when the price is in the same direction as the baseline. For example, if the baseline is sloping upwards, only long trades are taken, and if the baseline is sloping downwards, only short trades are taken. This approach helps to ensure that trades are in line with the overall trend of the market, and reduces the risk of entering trades that are likely to fail.
By using a baseline in the NNFX system, traders can have a clear reference point for determining the overall trend of the market, and can make more informed trading decisions. The baseline helps to filter out noise and false signals, and ensures that trades are taken in the direction of the long-term trend.
What is a Confirmation indicator?
Confirmation indicators are technical indicators that are used to confirm the signals generated by primary indicators. Primary indicators are the core indicators used in the NNFX system, such as the Average True Range (ATR), the Moving Average (MA), and the Relative Strength Index (RSI).
The purpose of the confirmation indicators is to reduce false signals and improve the accuracy of the trading system. They are designed to confirm the signals generated by the primary indicators by providing additional information about the strength and direction of the trend.
Some examples of confirmation indicators that may be used in the NNFX system include the Bollinger Bands, the MACD (Moving Average Convergence Divergence), and the Stochastic Oscillator. These indicators can provide information about the volatility, momentum, and trend strength of the market, and can be used to confirm the signals generated by the primary indicators.
In the NNFX system, confirmation indicators are used in combination with primary indicators and other filters to create a trading system that is robust and reliable. By using multiple indicators to confirm trading signals, the system aims to reduce the risk of false signals and improve the overall profitability of the trades.
What is a Continuation indicator?
In the NNFX (No Nonsense Forex) trading system, a continuation indicator is a technical indicator that is used to confirm a current trend and predict that the trend is likely to continue in the same direction. A continuation indicator is typically used in conjunction with other indicators in the system, such as a baseline indicator, to provide a comprehensive trading strategy.
What is a Volatility/Volume indicator?
Volume indicators, such as the On Balance Volume (OBV), the Chaikin Money Flow (CMF), or the Volume Price Trend (VPT), are used to measure the amount of buying and selling activity in a market. They are based on the trading volume of the market, and can provide information about the strength of the trend. In the NNFX system, volume indicators are used to confirm trading signals generated by the Moving Average and the Relative Strength Index. Volatility indicators include Average Direction Index, Waddah Attar, and Volatility Ratio. In the NNFX trading system, volatility is a proxy for volume and vice versa.
By using volume indicators as confirmation tools, the NNFX trading system aims to reduce the risk of false signals and improve the overall profitability of trades. These indicators can provide additional information about the market that is not captured by the primary indicators, and can help traders to make more informed trading decisions. In addition, volume indicators can be used to identify potential changes in market trends and to confirm the strength of price movements.
What is an Exit indicator?
The exit indicator is used in conjunction with other indicators in the system, such as the Moving Average (MA), the Relative Strength Index (RSI), and the Average True Range (ATR), to provide a comprehensive trading strategy.
The exit indicator in the NNFX system can be any technical indicator that is deemed effective at identifying optimal exit points. Examples of exit indicators that are commonly used include the Parabolic SAR, the Average Directional Index (ADX), and the Chandelier Exit.
The purpose of the exit indicator is to identify when a trend is likely to reverse or when the market conditions have changed, signaling the need to exit a trade. By using an exit indicator, traders can manage their risk and prevent significant losses.
In the NNFX system, the exit indicator is used in conjunction with a stop loss and a take profit order to maximize profits and minimize losses. The stop loss order is used to limit the amount of loss that can be incurred if the trade goes against the trader, while the take profit order is used to lock in profits when the trade is moving in the trader's favor.
Overall, the use of an exit indicator in the NNFX trading system is an important component of a comprehensive trading strategy. It allows traders to manage their risk effectively and improve the profitability of their trades by exiting at the right time.
How does Loxx's GKD (Giga Kaleidoscope Modularized Trading System) implement the NNFX algorithm outlined above?
Loxx's GKD v1.0 system has five types of modules (indicators/strategies). These modules are:
1. GKD-BT - Backtesting module (Volatility, Number 1 in the NNFX algorithm)
2. GKD-B - Baseline module (Baseline and Volatility/Volume, Numbers 1 and 2 in the NNFX algorithm)
3. GKD-C - Confirmation 1/2 and Continuation module (Confirmation 1/2 and Continuation, Numbers 3, 4, and 5 in the NNFX algorithm)
4. GKD-V - Volatility/Volume module (Confirmation 1/2, Number 6 in the NNFX algorithm)
5. GKD-E - Exit module (Exit, Number 7 in the NNFX algorithm)
(additional module types will added in future releases)
Each module interacts with every module by passing data between modules. Data is passed between each module as described below:
GKD-B => GKD-V => GKD-C(1) => GKD-C(2) => GKD-C(Continuation) => GKD-E => GKD-BT
That is, the Baseline indicator passes its data to Volatility/Volume. The Volatility/Volume indicator passes its values to the Confirmation 1 indicator. The Confirmation 1 indicator passes its values to the Confirmation 2 indicator. The Confirmation 2 indicator passes its values to the Continuation indicator. The Continuation indicator passes its values to the Exit indicator, and finally, the Exit indicator passes its values to the Backtest strategy.
This chaining of indicators requires that each module conform to Loxx's GKD protocol, therefore allowing for the testing of every possible combination of technical indicators that make up the six components of the NNFX algorithm.
What does the application of the GKD trading system look like?
Example trading system:
Backtest: Strategy with 1-3 take profits, trailing stop loss, multiple types of PnL volatility, and 2 backtesting styles
Baseline: Hull Moving Average
Volatility/Volume: Damiani Volatmeter as shown on the chart above
Confirmation 1: FDI-Adaptive Supertrend as shown on the chart above
Confirmation 2: Williams Percent Range
Continuation: Fisher Transform
Exit: Rex Oscillator
Each GKD indicator is denoted with a module identifier of either: GKD-BT, GKD-B, GKD-C, GKD-V, or GKD-E. This allows traders to understand to which module each indicator belongs and where each indicator fits into the GKD protocol chain.
Giga Kaleidoscope Modularized Trading System Signals (based on the NNFX algorithm)
Standard Entry
1. GKD-C Confirmation 1 Signal
2. GKD-B Baseline agrees
3. Price is within a range of 0.2x Volatility and 1.0x Volatility of the Goldie Locks Mean
4. GKD-C Confirmation 2 agrees
5. GKD-V Volatility/Volume agrees
Baseline Entry
1. GKD-B Baseline signal
2. GKD-C Confirmation 1 agrees
3. Price is within a range of 0.2x Volatility and 1.0x Volatility of the Goldie Locks Mean
4. GKD-C Confirmation 2 agrees
5. GKD-V Volatility/Volume agrees
6. GKD-C Confirmation 1 signal was less than 7 candles prior
Continuation Entry
1. Standard Entry, Baseline Entry, or Pullback; entry triggered previously
2. GKD-B Baseline hasn't crossed since entry signal trigger
3. GKD-C Confirmation Continuation Indicator signals
4. GKD-C Confirmation 1 agrees
5. GKD-B Baseline agrees
6. GKD-C Confirmation 2 agrees
1-Candle Rule Standard Entry
1. GKD-C Confirmation 1 signal
2. GKD-B Baseline agrees
3. Price is within a range of 0.2x Volatility and 1.0x Volatility of the Goldie Locks Mean
Next Candle:
1. Price retraced (Long: close < close or Short: close > close )
2. GKD-B Baseline agrees
3. GKD-C Confirmation 1 agrees
4. GKD-C Confirmation 2 agrees
5. GKD-V Volatility/Volume agrees
1-Candle Rule Baseline Entry
1. GKD-B Baseline signal
2. GKD-C Confirmation 1 agrees
3. Price is within a range of 0.2x Volatility and 1.0x Volatility of the Goldie Locks Mean
4. GKD-C Confirmation 1 signal was less than 7 candles prior
Next Candle:
1. Price retraced (Long: close < close or Short: close > close )
2. GKD-B Baseline agrees
3. GKD-C Confirmation 1 agrees
4. GKD-C Confirmation 2 agrees
5. GKD-V Volatility/Volume Agrees
PullBack Entry
1. GKD-B Baseline signal
2. GKD-C Confirmation 1 agrees
3. Price is beyond 1.0x Volatility of Baseline
Next Candle:
1. Price is within a range of 0.2x Volatility and 1.0x Volatility of the Goldie Locks Mean
3. GKD-C Confirmation 1 agrees
4. GKD-C Confirmation 2 agrees
5. GKD-V Volatility/Volume Agrees
█ GKD-C FDI-Adaptive Supertrend
What is the Fractal Dimension Index?
The Fractal Dimension Index (FDI) is a measure of the complexity or irregularity of a geometric shape or pattern. It is a mathematical concept that quantifies the degree of self-similarity or self-affinity of an object at different scales. The FDI is a real number that represents the scaling behavior of an object in a particular space, and it can be used to characterize a wide range of natural and synthetic phenomena, from coastlines to fractal art.
The FDI is based on the concept of fractals, which are objects that exhibit self-similar or self-affine patterns at different scales. Fractals are characterized by their fractional dimensionality, which is a non-integer number that describes their complexity. The FDI is a measure of this fractional dimensionality, and it can be calculated using a variety of mathematical techniques, including box counting, wavelet analysis, and Fourier analysis.
In practical terms, the FDI can be used to quantify the complexity or roughness of natural surfaces, such as soil or rock, as well as the irregularity of synthetic materials, such as concrete or ceramics. It is also used in image analysis and pattern recognition to characterize the complexity of digital images and to detect patterns that are difficult to discern with traditional methods.
In forex trading, the Fractal Dimension Index (FDI) is a technical indicator used to analyze market trends and price movements. The FDI is calculated based on the fractal geometry of price charts and is used to identify support and resistance levels, as well as potential changes in trend direction.
The FDI indicator works by measuring the fractal dimensionality of price movements. Fractals are self-similar or self-affine patterns that repeat at different scales, and they can be used to identify key levels of support and resistance in the market. The FDI indicator calculates the fractal dimension of price movements over a specified time period, and it plots the result as a line on the price chart.
Traders use the FDI indicator to identify potential trend changes and to confirm trend direction. When the FDI line crosses above or below a key level, such as 1.5, it may indicate a potential trend reversal. Additionally, when the FDI line is trending in the same direction as the price, it can confirm the current trend and provide additional confidence for traders.
Overall, the Fractal Dimension Index is a technical indicator that can be used to analyze market trends and price movements in forex trading. By measuring the fractal dimensionality of price movements, traders can identify potential support and resistance levels and confirm trend direction.
What is Supertrend?
Supertrend is a popular technical indicator used in trading to identify trends in the market. It is a trend-following indicator that helps traders to identify the direction of the market trend and to enter or exit trades accordingly.
The Supertrend indicator is based on the Average True Range (ATR) and the price action of an asset. It plots a line on the price chart that follows the trend of the asset and indicates potential support and resistance levels. The Supertrend line changes its color when the trend changes, which can be used as a signal to enter or exit trades.
The Supertrend indicator is used to identify both long-term and short-term trends in the market. When the Supertrend line is above the price, it indicates a downtrend, and when it is below the price, it indicates an uptrend. Traders can use the Supertrend indicator to identify potential entry and exit points for their trades, as well as to set stop-loss orders and take-profit levels.
Supertrend is a popular indicator among traders because it is easy to use and can be applied to a variety of markets and timeframes. However, like any technical indicator, it is not perfect and can produce false signals in certain market conditions. Therefore, it is important to use the Supertrend indicator in combination with other indicators and to have a solid trading strategy in place.
What is FDI-Adaptive Supertrend?
FDI-Adaptive Supertrend uses FDI to adapt the period inputs into Supertrend to make Supertrend FDI-adaptive.
Requirements
Inputs
Confirmation 1 and Solo Confirmation: GKD-V Volatility / Volume indicator
Confirmation 2: GKD-C Confirmation indicator
Outputs
Confirmation 2 and Solo Confirmation Complex: GKD-E Exit indicator
Confirmation 1: GKD-C Confirmation indicator
Continuation: GKD-E Exit indicator
Solo Confirmation Simple: GKD-BT Backtest strategy
Additional features will be added in future releases.
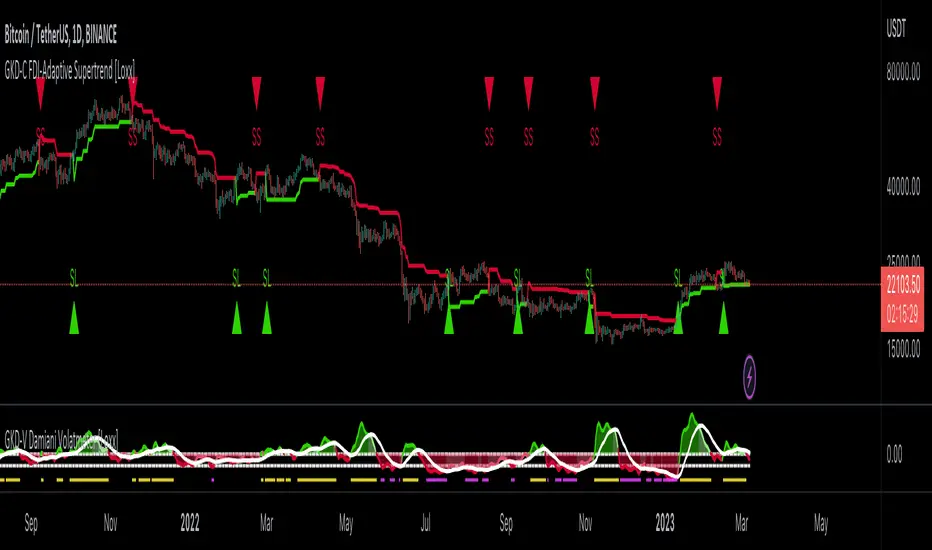
GKD-C ATR-Stepped PDFMA [Loxx]Giga Kaleidoscope GKD-C ATR-Stepped PDFMA is a Confirmation module included in Loxx's "Giga Kaleidoscope Modularized Trading System".
█ Giga Kaleidoscope Modularized Trading System
What is Loxx's "Giga Kaleidoscope Modularized Trading System"?
The Giga Kaleidoscope Modularized Trading System is a trading system built on the philosophy of the NNFX (No Nonsense Forex) algorithmic trading.
What is the NNFX algorithmic trading strategy?
The NNFX (No-Nonsense Forex) trading system is a comprehensive approach to Forex trading that is designed to simplify the process and remove the confusion and complexity that often surrounds trading. The system was developed by a Forex trader who goes by the pseudonym "VP" and has gained a significant following in the Forex community.
The NNFX trading system is based on a set of rules and guidelines that help traders make objective and informed decisions. These rules cover all aspects of trading, including market analysis, trade entry, stop loss placement, and trade management.
Here are the main components of the NNFX trading system:
1. Trading Philosophy: The NNFX trading system is based on the idea that successful trading requires a comprehensive understanding of the market, objective analysis, and strict risk management. The system aims to remove subjective elements from trading and focuses on objective rules and guidelines.
2. Technical Analysis: The NNFX trading system relies heavily on technical analysis and uses a range of indicators to identify high-probability trading opportunities. The system uses a combination of trend-following and mean-reverting strategies to identify trades.
3. Market Structure: The NNFX trading system emphasizes the importance of understanding the market structure, including price action, support and resistance levels, and market cycles. The system uses a range of tools to identify the market structure, including trend lines, channels, and moving averages.
4. Trade Entry: The NNFX trading system has strict rules for trade entry. The system uses a combination of technical indicators to identify high-probability trades, and traders must meet specific criteria to enter a trade.
5. Stop Loss Placement: The NNFX trading system places a significant emphasis on risk management and requires traders to place a stop loss order on every trade. The system uses a combination of technical analysis and market structure to determine the appropriate stop loss level.
6. Trade Management: The NNFX trading system has specific rules for managing open trades. The system aims to minimize risk and maximize profit by using a combination of trailing stops, take profit levels, and position sizing.
Overall, the NNFX trading system is designed to be a straightforward and easy-to-follow approach to Forex trading that can be applied by traders of all skill levels.
Core components of an NNFX algorithmic trading strategy
The NNFX algorithm is built on the principles of trend, momentum, and volatility. There are six core components in the NNFX trading algorithm:
1. Volatility - price volatility; e.g., Average True Range, True Range Double, Close-to-Close, etc.
2. Baseline - a moving average to identify price trend
3. Confirmation 1 - a technical indicator used to identify trends
4. Confirmation 2 - a technical indicator used to identify trends
5. Continuation - a technical indicator used to identify trends
6. Volatility/Volume - a technical indicator used to identify volatility/volume breakouts/breakdown
7. Exit - a technical indicator used to determine when a trend is exhausted
What is Volatility in the NNFX trading system?
In the NNFX (No Nonsense Forex) trading system, ATR (Average True Range) is typically used to measure the volatility of an asset. It is used as a part of the system to help determine the appropriate stop loss and take profit levels for a trade. ATR is calculated by taking the average of the true range values over a specified period.
True range is calculated as the maximum of the following values:
-Current high minus the current low
-Absolute value of the current high minus the previous close
-Absolute value of the current low minus the previous close
ATR is a dynamic indicator that changes with changes in volatility. As volatility increases, the value of ATR increases, and as volatility decreases, the value of ATR decreases. By using ATR in NNFX system, traders can adjust their stop loss and take profit levels according to the volatility of the asset being traded. This helps to ensure that the trade is given enough room to move, while also minimizing potential losses.
Other types of volatility include True Range Double (TRD), Close-to-Close, and Garman-Klass
What is a Baseline indicator?
The baseline is essentially a moving average, and is used to determine the overall direction of the market.
The baseline in the NNFX system is used to filter out trades that are not in line with the long-term trend of the market. The baseline is plotted on the chart along with other indicators, such as the Moving Average (MA), the Relative Strength Index (RSI), and the Average True Range (ATR).
Trades are only taken when the price is in the same direction as the baseline. For example, if the baseline is sloping upwards, only long trades are taken, and if the baseline is sloping downwards, only short trades are taken. This approach helps to ensure that trades are in line with the overall trend of the market, and reduces the risk of entering trades that are likely to fail.
By using a baseline in the NNFX system, traders can have a clear reference point for determining the overall trend of the market, and can make more informed trading decisions. The baseline helps to filter out noise and false signals, and ensures that trades are taken in the direction of the long-term trend.
What is a Confirmation indicator?
Confirmation indicators are technical indicators that are used to confirm the signals generated by primary indicators. Primary indicators are the core indicators used in the NNFX system, such as the Average True Range (ATR), the Moving Average (MA), and the Relative Strength Index (RSI).
The purpose of the confirmation indicators is to reduce false signals and improve the accuracy of the trading system. They are designed to confirm the signals generated by the primary indicators by providing additional information about the strength and direction of the trend.
Some examples of confirmation indicators that may be used in the NNFX system include the Bollinger Bands, the MACD (Moving Average Convergence Divergence), and the Stochastic Oscillator. These indicators can provide information about the volatility, momentum, and trend strength of the market, and can be used to confirm the signals generated by the primary indicators.
In the NNFX system, confirmation indicators are used in combination with primary indicators and other filters to create a trading system that is robust and reliable. By using multiple indicators to confirm trading signals, the system aims to reduce the risk of false signals and improve the overall profitability of the trades.
What is a Continuation indicator?
In the NNFX (No Nonsense Forex) trading system, a continuation indicator is a technical indicator that is used to confirm a current trend and predict that the trend is likely to continue in the same direction. A continuation indicator is typically used in conjunction with other indicators in the system, such as a baseline indicator, to provide a comprehensive trading strategy.
What is a Volatility/Volume indicator?
Volume indicators, such as the On Balance Volume (OBV), the Chaikin Money Flow (CMF), or the Volume Price Trend (VPT), are used to measure the amount of buying and selling activity in a market. They are based on the trading volume of the market, and can provide information about the strength of the trend. In the NNFX system, volume indicators are used to confirm trading signals generated by the Moving Average and the Relative Strength Index. Volatility indicators include Average Direction Index, Waddah Attar, and Volatility Ratio. In the NNFX trading system, volatility is a proxy for volume and vice versa.
By using volume indicators as confirmation tools, the NNFX trading system aims to reduce the risk of false signals and improve the overall profitability of trades. These indicators can provide additional information about the market that is not captured by the primary indicators, and can help traders to make more informed trading decisions. In addition, volume indicators can be used to identify potential changes in market trends and to confirm the strength of price movements.
What is an Exit indicator?
The exit indicator is used in conjunction with other indicators in the system, such as the Moving Average (MA), the Relative Strength Index (RSI), and the Average True Range (ATR), to provide a comprehensive trading strategy.
The exit indicator in the NNFX system can be any technical indicator that is deemed effective at identifying optimal exit points. Examples of exit indicators that are commonly used include the Parabolic SAR, the Average Directional Index (ADX), and the Chandelier Exit.
The purpose of the exit indicator is to identify when a trend is likely to reverse or when the market conditions have changed, signaling the need to exit a trade. By using an exit indicator, traders can manage their risk and prevent significant losses.
In the NNFX system, the exit indicator is used in conjunction with a stop loss and a take profit order to maximize profits and minimize losses. The stop loss order is used to limit the amount of loss that can be incurred if the trade goes against the trader, while the take profit order is used to lock in profits when the trade is moving in the trader's favor.
Overall, the use of an exit indicator in the NNFX trading system is an important component of a comprehensive trading strategy. It allows traders to manage their risk effectively and improve the profitability of their trades by exiting at the right time.
How does Loxx's GKD (Giga Kaleidoscope Modularized Trading System) implement the NNFX algorithm outlined above?
Loxx's GKD v1.0 system has five types of modules (indicators/strategies). These modules are:
1. GKD-BT - Backtesting module (Volatility, Number 1 in the NNFX algorithm)
2. GKD-B - Baseline module (Baseline and Volatility/Volume, Numbers 1 and 2 in the NNFX algorithm)
3. GKD-C - Confirmation 1/2 and Continuation module (Confirmation 1/2 and Continuation, Numbers 3, 4, and 5 in the NNFX algorithm)
4. GKD-V - Volatility/Volume module (Confirmation 1/2, Number 6 in the NNFX algorithm)
5. GKD-E - Exit module (Exit, Number 7 in the NNFX algorithm)
(additional module types will added in future releases)
Each module interacts with every module by passing data between modules. Data is passed between each module as described below:
GKD-B => GKD-V => GKD-C(1) => GKD-C(2) => GKD-C(Continuation) => GKD-E => GKD-BT
That is, the Baseline indicator passes its data to Volatility/Volume. The Volatility/Volume indicator passes its values to the Confirmation 1 indicator. The Confirmation 1 indicator passes its values to the Confirmation 2 indicator. The Confirmation 2 indicator passes its values to the Continuation indicator. The Continuation indicator passes its values to the Exit indicator, and finally, the Exit indicator passes its values to the Backtest strategy.
This chaining of indicators requires that each module conform to Loxx's GKD protocol, therefore allowing for the testing of every possible combination of technical indicators that make up the six components of the NNFX algorithm.
What does the application of the GKD trading system look like?
Example trading system:
Backtest: Strategy with 1-3 take profits, trailing stop loss, multiple types of PnL volatility, and 2 backtesting styles
Baseline: Hull Moving Average
Volatility/Volume: Jurik DMX as shown on the chart
Confirmation 1: GKD-V ATR-Stepped PDFMA as shown on the chart above
Confirmation 2: Williams Percent Range
Continuation: Fisher Transform
Exit: Rex Oscillator
Each GKD indicator is denoted with a module identifier of either: GKD-BT, GKD-B, GKD-C, GKD-V, or GKD-E. This allows traders to understand to which module each indicator belongs and where each indicator fits into the GKD protocol chain.
Giga Kaleidoscope Modularized Trading System Signals (based on the NNFX algorithm)
Standard Entry
1. GKD-C Confirmation 1 Signal
2. GKD-B Baseline agrees
3. Price is within a range of 0.2x Volatility and 1.0x Volatility of the Goldie Locks Mean
4. GKD-C Confirmation 2 agrees
5. GKD-V Volatility/Volume agrees
Baseline Entry
1. GKD-B Baseline signal
2. GKD-C Confirmation 1 agrees
3. Price is within a range of 0.2x Volatility and 1.0x Volatility of the Goldie Locks Mean
4. GKD-C Confirmation 2 agrees
5. GKD-V Volatility/Volume agrees
6. GKD-C Confirmation 1 signal was less than 7 candles prior
Continuation Entry
1. Standard Entry, Baseline Entry, or Pullback; entry triggered previously
2. GKD-B Baseline hasn't crossed since entry signal trigger
3. GKD-C Confirmation Continuation Indicator signals
4. GKD-C Confirmation 1 agrees
5. GKD-B Baseline agrees
6. GKD-C Confirmation 2 agrees
1-Candle Rule Standard Entry
1. GKD-C Confirmation 1 signal
2. GKD-B Baseline agrees
3. Price is within a range of 0.2x Volatility and 1.0x Volatility of the Goldie Locks Mean
Next Candle:
1. Price retraced (Long: close < close or Short: close > close )
2. GKD-B Baseline agrees
3. GKD-C Confirmation 1 agrees
4. GKD-C Confirmation 2 agrees
5. GKD-V Volatility/Volume agrees
1-Candle Rule Baseline Entry
1. GKD-B Baseline signal
2. GKD-C Confirmation 1 agrees
3. Price is within a range of 0.2x Volatility and 1.0x Volatility of the Goldie Locks Mean
4. GKD-C Confirmation 1 signal was less than 7 candles prior
Next Candle:
1. Price retraced (Long: close < close or Short: close > close )
2. GKD-B Baseline agrees
3. GKD-C Confirmation 1 agrees
4. GKD-C Confirmation 2 agrees
5. GKD-V Volatility/Volume Agrees
PullBack Entry
1. GKD-B Baseline signal
2. GKD-C Confirmation 1 agrees
3. Price is beyond 1.0x Volatility of Baseline
Next Candle:
1. Price is within a range of 0.2x Volatility and 1.0x Volatility of the Goldie Locks Mean
3. GKD-C Confirmation 1 agrees
4. GKD-C Confirmation 2 agrees
5. GKD-V Volatility/Volume Agrees
█ GKD-V ATR-Stepped PDFMA
ATR-Stepped PDF MA is and ATR-stepped moving average that uses a probability density function moving average.
What is Probability Density Function?
Probability Density Function (PDF) is a statistical function used to describe the likelihood of a continuous random variable taking on a particular value or range of values. In other words, it describes the probability distribution of a random variable over a continuous range of values.
The PDF is defined as the derivative of the cumulative distribution function (CDF) of a continuous random variable. The CDF of a continuous random variable is the probability that the random variable takes on a value less than or equal to a given value. The PDF is a non-negative function that integrates to 1 over the entire range of the random variable.
The PDF is used to calculate the probability of the random variable taking on a value within a specific range. This is done by integrating the PDF over that range. The height of the PDF at a particular value of the random variable indicates the relative likelihood of that value occurring.
The PDF is an essential tool in many areas of statistics, including hypothesis testing, confidence interval estimation, and Bayesian inference.
Probability density function based MA is a sort of weighted moving average that uses probability density function to calculate the weights.
Requirements
Inputs
Confirmation 1 and Solo Confirmation: GKD-V Volatility / Volume indicator
Confirmation 2: GKD-C Confirmation indicator
Outputs
Confirmation 2 and Solo Confirmation Complex: GKD-E Exit indicator
Confirmation 1: GKD-C Confirmation indicator
Continuation: GKD-E Exit indicator
Solo Confirmation Simple: GKD-BT Backtest strategy
Additional features will be added in future releases.
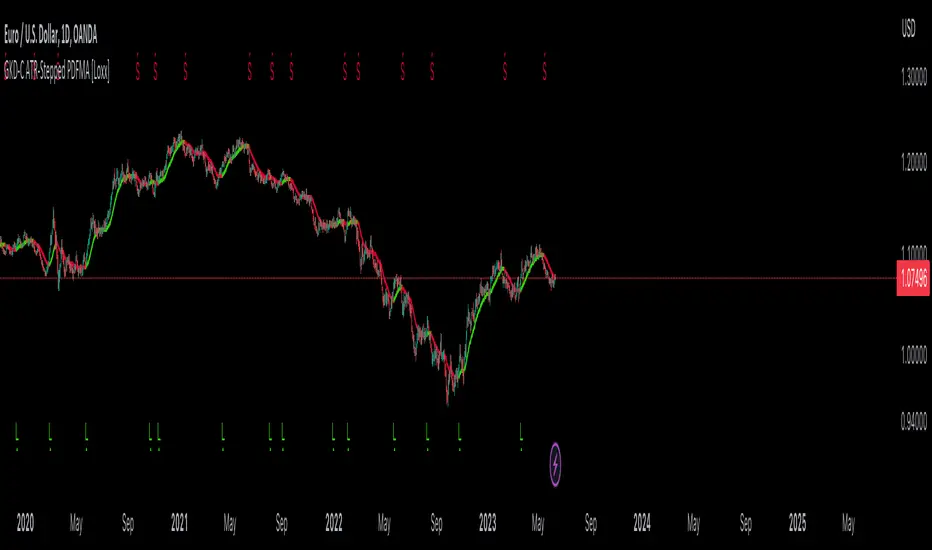
TheATR™: Volatility Extremes (VolEx)Volatility is a crucial aspect of financial markets that is closely monitored by traders and investors alike. The traditional Average True Range (ATR) oscillator is a widely used technical indicator for measuring volatility in financial markets. However, there are limitations to the ATR oscillator, as it does not account for changing market conditions and may not adequately reflect extreme price movements. To address these limitations, TheATR has developed the VolEx indicator, which aims to identify extremes in the ATR oscillator by building dynamic thresholds using either a 'percentage' or 'standard deviation' based comparison with the value of the ATR.
The VolEx indicator utilizes a dynamic approach to measure volatility by considering the current level of the ATR oscillator relative to the dynamically generated thresholds. The dynamic thresholds are calculated based on the current ATR value and the chosen method of comparison (either 'percentage' or 'standard deviation'). If the ATR value exceeds the upper dynamic threshold, the market is experiencing high volatility, while a value below the lower dynamic threshold indicates low volatility.
The VolEx indicator offers several advantages over traditional volatility indicators, such as the ATR oscillator. First, it takes into account the changing market conditions and adjusts the thresholds accordingly. Second, it offers flexibility in the choice of the comparison method, allowing traders to tailor the indicator to their specific trading strategies. Finally, it provides clear signals for identifying extremes in volatility, which can be used to inform trading decisions.
In summary, the VolEx indicator developed by TheATR is a dynamic and flexible technical indicator that offers a robust approach to measuring volatility in financial markets. By utilizing dynamic thresholds and allowing for different comparison methods, the VolEx indicator provides a valuable tool for traders and investors seeking to identify extremes in market volatility..
NOTE: It is important to note that volatility, as measured by the VolEx indicator, does not provide any directional bias for the market movement. Rather, it simply indicates the degree to which the market is moving, regardless of direction. Traders and investors must use other technical or fundamental analysis tools to determine the direction of the market and make informed trading decisions based on their individual strategies and risk tolerance.

Artharjan - ATR DashboardArtharjan - ATR Dashboard indicator is designed to plot a dashboard of Average True Range for past 10 candles on the chart. It calculates and shows what percentage of the closing price the ATR is for the selected timeframe.
It also plots the volume of past 10 days and shows whether the volume has gone up (Green Color) or fallen (Red Color)
For daily timeframe since there are 22 active trading days per month a default 11 period is selected for the Daily timeframe however users may change according to their preference.
If the timeframe is in seconds - 75 period is used to calculate ATR
If the timeframe is in Intraday - 25 period is used to calculate ATR
If the timeframe is in Daily - 11 period is used to calculate ATR
If the timeframe is in Weekly - 4 period is used to calculate ATR
If the timeframe is in Monthly - 3 period is used to calculate ATR
The Default ATR period is 14. User has a choice to select the ATR period based on the timeframe or use Standard 14 period for all timeframes.
There is also a provision created to add a Buffer % to the ATR that is calculated. With this Buffer the Options Selling Prices (For Short Strangle Strategy) are calculated. If the Buffer is set to 0 then no Buffer is added to the ATR.
Strike Switch is provided to change the way the Call and Put Options Strike Prices are calculated.
There are two options provided to calculate short strike prices for Out of Money Call and Out of Money Put.
1] Strikes calculation based on H/L of previous candle
2] Strikes calculation based on the midpoint of previous candle (High + Low) /2
Short strikes for the OTM Call Option and OTM Put Options are calculated by adding the Buffered ATR either to the Previous Day High and subtracting Buffered ATR from Previous Day Low OR by adding the Buffered ATR either to the mid point of Previous Day and subtracting Buffered ATR from mid point of previous Day. If Buffer % is set to zero then no Buffer is added to the ATR.
Traders can decide whether they wish to enter the trade if the ATR is let's say at least 1.25% or higher of the Candles closing price that will ensure decent options premium to be collected by Options Writers.
The Dashboard plots following details for 10 period
1] Closing Price (LTP)
2] % Change of Closing Price
3] ATR for the selected Period
4] % Change in ATR
5] ATR as a Percentage of LTP
6] Buffered ATR
7] CE Strike
8] PE Strike
9] Volume (IN THOUSANDS)
Hope traders will find this dashboard very useful.
Regards
Rahul Desai
@Artharjan

Relative ATRATR is one of the main indicators we use to measure volatility. When the market starts to consolidate or does not rise, ATR will be at a relatively low position.
However, the classic ATR formula does not consider that when the price changes at a logarithmic level, the ATR value will also change significantly. Therefore, I divide the calculated ATR value by the closing price to get an amplitude ratio index.
The adjusted indicator can well reflect the level of volatility. For example, the volatility of BTC reached an unprecedented low in January this year, which means that there will be a significant outbreak after breaking through the consolidation range. The configuration of the breakthrough order will be an excellent choice.

ATR fluctuation abnormal warning RTA77 1.0//en
ATR fluctuation abnormal warning RTA77 1.0
COINBASE:BTCUSD
"coming? "
A classic technical term for impending volatility. But "coming" generally means that the question of whether volatility or a trend is coming is asked only after volatility has been observed.
By combining short-term volatility, long-term volatility, and abnormal changes in relative cycles, this indicator identifies potential changes in upcoming volatility (volatility changes) at an earlier stage, allowing the market to be asked the question "Is it coming?
Since volatility itself has a lag, and the longer the period, the more lagged the detection of abnormal volatility will be, so this indicator is only suitable for short-term, small period (15M - 1H) best. Because volatility is passed from small to large, there is a chance to detect large volatility quotes by catching potential volatility abnormal changes in small cycles.
The "volatility warning" of this indicator all refers to the plate is in abnormal volatility, or is about to occur volatility anomaly, can be used as a precursor warning of the emergence of volatility anomaly in the later market. When a golden cross between short-term volatility and long-term volatility is observed, it means that in a short period of time, or in the future, a high volatility market will be profitable in contrast to the previous low volatility market.
(Alert triggering is not only limited to a single time, if it is confirmed several times in a short period of time, if volatility has not yet occurred, the probability of volatility in the future market increases in the short term)
This indicator of "shock warning" all refers to the plate may have been from the previous state of high volatility, into a low volatility of the shock state, orderly or disorderly, suggesting that volatility in the short term appeared to reduce the higher the volatility of the previous section of the market, when the shock warning signal, the probability of starting to enter the shock adjustment market.
The ATR of two different cycles can be changed as needed, but must maintain the relationship between short-term and long-term correspondence, each subject has a different cycle, you need to judge and find the optimal parameters
Continuously updated.
//ch
ATR波动异常预警 RTA77 1.0
《来了?》
一个经典代表波动即将来临的专业术语。但“来了”一般情况下指有当人们观察到波动以后,才会发出对市场的提问,波动或趋势是否到来?
本指标通过结合短期波动率,长期波动率,在相对周期内的异常变化表现,从而在更早的阶段发现即将出现波动的潜在变化(波动率变化),使得能够更早的向市场提出疑问《来了?》
由于波动率本身具有滞后性,且周期越长,发现波动异常的时候就会越滞后,所以本指标仅适合在短期,小周期里使用(15M - 1H)最佳。因为波动是从小到大传递,所以通过抓取小周期内潜在的波动异常变化,从而有机会发现大波动行情。
本指标的 “波动预警” 皆指的是盘面正处于异常波动,或者即将发生波动异常,可做为对后市出现波动异常的前兆预警。当观察到短期波动与长期波动金叉时,意味着在短时间内,或者未来将盈利与之前低波动行情相反的高波动行情。
(警报触发不仅限单次,如在短期内多次确认时,如还未发生波动,则后市短期内出现波动概率增大)
本指标的 “震荡预警” 皆指的是盘面可能已经从之前的高波动状态,转变为低波动的震荡状态,有序或无序,提示短期内波动率出现降低,前段波动幅度越高的行情,当出现震荡预警信号时,则大概率开始进入震荡调整行情。
两条不同周期的ATR可以按需要更改,但必须保持短期和长期对应的关系,每个标的有着不同的周期,需要自行判断并找出最优参数
持续更新中。。
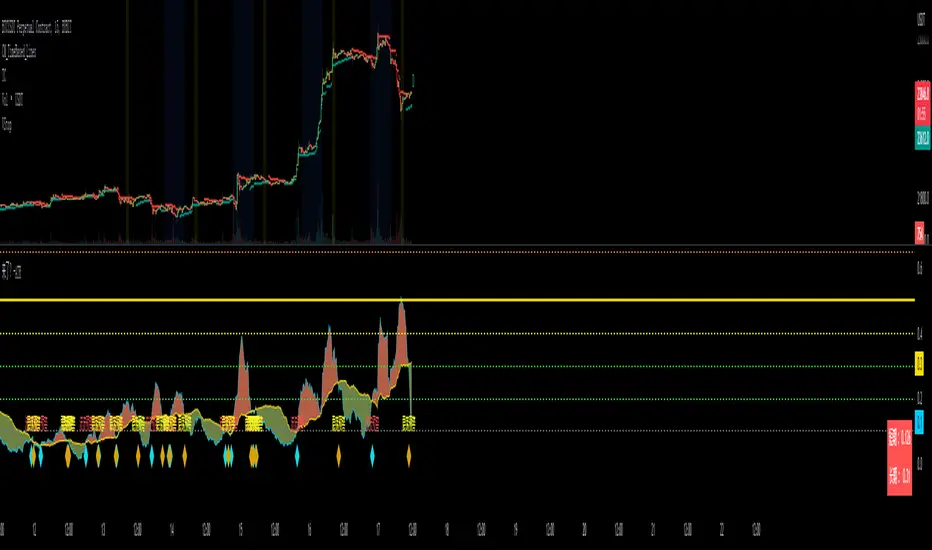
STructure Atr Cloud w/ TargetsThis indicator is part of our educational suite focused on teaching price structure, momentum, and mean reversion trading strategies. This indicator is recommended to be used with our “Price Action Trading Indicator” or PATI.
Components of this indicator:
Intraday and Swing Price Structure
Breaks of Structure Identification
Change of Character Identification
Fib-derived Price Targets
Dynamic ATR-based Trend Cloud
This indicator is intended to be used in conjunction with the education we provide to help our users determine their optimal trade plan to utilize their edge.
Intraday (Short-Term) Structure is displayed in gray as HH, HL, LH, LL by default, and the zig-zags can be turned on/off in the settings.
Swing Structure is displayed in yellow as HH, HL, LH, LL by default, and the zig-zags can be turned on/off in the settings.
EQL/EQH show areas where price made an equal low or high.
Dynamic ATR-based Trend Cloud (orange cloud) helps traders stay in profitable trades longer by giving them a visual aid of the current momentum. We have added a confirmation level that dynamically appears when the price breaks over/under the cloud giving validation to the potential trend shift. Failure to break this level tends to result in a rejection and continuation of the current orange cloud trend as you can see in the image above.
Change of Character (ChoCh) shows internal structural breaks where a minor level or supply/demand zone fail, resulting in a potential shift in a short-term trend. Above you can see two common ChoCh setups (head and shoulders/ inverse head and shoulders) that usually result in significant price reversals.
Above is an example of using this indicator on two timeframes to develop short and longer term targets. Previous targets can be used as areas of interest where we can look for price to bounce/reject. Target levels that develop above/below price make great areas to potentially take off some risk/ put risk on.
Please check the Author Instructions Below for how to gain access to our indicators.

Fibonacci Levels Based on Supertrend [By MUQWISHI]A “ Fibonacci Levels Based on Supertrend ” indicator is supertrend indicator planned with Fibonacci retracements levels. Fibonacci retracements provides a sequence of levels starting from 0% to 100% in addition to extension levels. 0% is measured to be the initial Supertrend line, and 100% is the previous Supertrend line where it has been broken by candle. This tool could be valuable in terms of managing trades by setting targets and reducing the risk in the trend direction.
█ OVERVIEW
█ INDICATOR SETTINGS
Please let me know if you have any questions.
Thank you.

Cryptos Pump Hunter[liwei666]🔥 Cryptos Pump Hunter captured high volatility symbols in real-time, Up to 40 symbols can be monitored at same time.
Help you find the most profitable symbol with excellent visualization.
🔥 Indicator Design logic
🎯 The core pump/dump logic is quite simple
1. calc past bars highest and lowest High price, get movement by this formula
" movement = (highest - lowest) / lowest * 100 "
2. order by 'movement' value descending, you will get a volatility List
3. use Table tool display List, The higher the 'movement', the higher the ranking.
🔥 Settings
🎯 2 input properties impact on the results, 2 input impact on display effects, others look picture below.
pump_bars_cnt : lookback bar to calc pump/dump
resolution for pump : 1min to 1D
show_top1 : when ranking list top1 change, will draw a label
show pump : when symbol over threhold, draw a pump lable
🔥 How TO USE
🎯 only trade high volatility symbols
1. focus on top1 symbol on Table panel at top-right postion, trading symbols at label in chart.
2. Short when 'postion' ~ 0, Long when 'postion' ~ 1 on Table Cell
🎯 Monitor the symbols you like
1. 100+ symbols added in script, cancel remarks in code line if symbol is your want
2. add 1 line code if symbol not exist. if you want monitor 'ETHUSDTPERP ', then add
" ETHUSDTPERP = create_symbol_obj('BINANCE:ETHUSDTPERP'), array.unshift(symbol_a, ETHUSDTPERP ) "
🎯 Alert will be add soon, any questions or suggestion please comment below, I would appreciate it greatly.
Hope this indicator will be useful for you :)
enjoy! 🚀🚀🚀
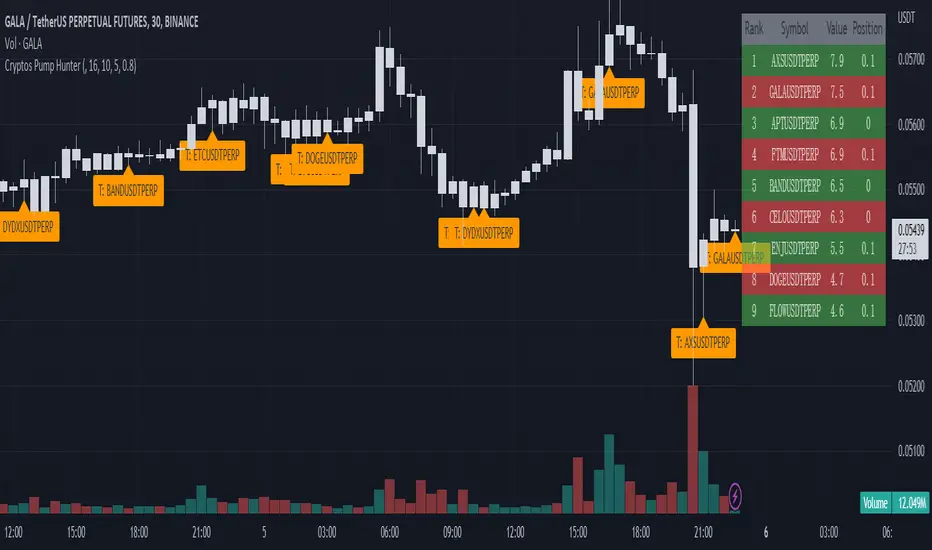
Average True Range PercentWhen writing the Quickfingers Luc base scanner (Marvin) script, I wanted a measure of volatility that would be comparable between charts. The traditional Average True Range (ATR) indicator calculates a discrete number providing the average true range of that chart for a specified number of periods. The ATR is not comparable across different price charts.
Average True Range Percent (ATRP) measures the true range for the period, converts it to a percentage using the average of the period's range ((high + low) / 2) and then smooths the percentage. The ATRP provides a measure of volatility that is comparable between charts showing their relative volatility.
Enjoy.
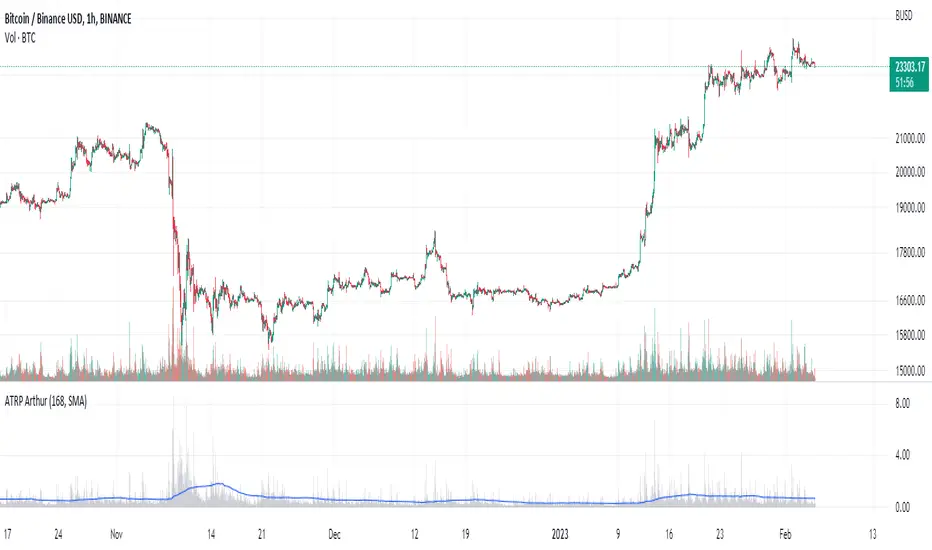
Trail Blaze - (Multi Function Trailing Stop Loss) - [mutantdog]Shorter version:
As the title states, this is a 'Trailing Stop' type indicator, albeit one with a whole bunch of additional functionality, making it far more versatile and customisable than a standard trailing stop.
The main set of features includes:
Three independent trailing types each with their own +/- multipliers:
- Standard % change
- ATR (aka Supertrend)
- IQR (inter-quartile range)
These can be used in isolation or summed together. A subsequent pair of direction specific multipliers are also included.
Two separate custom source inputs are available, both feature the standard options alongside a selection of 'weighted inputs' and the option to use another indicator (selected via 'AUX'):
- 'Centre' determines the value about which the trailing sum will be added to define the stop level.
- 'Trigger' determines the value used for crossing of stops, initiating trend changes and triggering alerts.
A selection of optional filters and moving averages are available for both.
Furthermore there are various useful visualisation options available, including the underlying bands that govern the stop levels. Preset alerts for trend reversals are also included.
This is not really an 'out-of-the-box' indicator. Depending upon the market and timeframe some adjustments will be necessary for it to function in a useful manner, these can be as simple or complex as the feature-set allows. Basic settings are easy to dial in however and the default state is intended as a good starting point. Alternatively with some experimentation, a plethora of unique and creative configurations are possible, making this a great tool for tweaking. Below is a more detailed overview followed by a bunch of simple example settings.
------------------------
Lengthy Version :
DESIGN & CONCEPT
Before we start breaking this down, a little background. This started off as an attempt to improve upon the ever-popular Supertrend indicator. Of course there are many excellent user created variants available utilising some interesting methods to overcome the drawbacks of the basic version. To that end, rather than copying the work of others, the direction here shifted towards a hybrid trailing stop loss with a bunch of additional user customisation options. At some point, a completely different project involving IQR got morphed into this one. After sitting through months of sideways chop (where this proved to be of limited use), at the time of publication the market has began to form some near term trend direction and it appears to be performing well in many different timeframes.
And so with that out of the way...
INPUTS
The standard Supertrend (and most other variants) includes a single source input, as default set to 'hl2' (candle mid-range). This is the centre around which the atr bands are added/subtracted to govern the stop levels. This is not however the value which is used to trigger the trend reversal, that is usually hard-coded to 'close'. For this version both source values are adjustable: labelled 'centre' and 'trigger' respectively.
Each has custom input selectors including the usual options, a selection of 'weighted inputs' and the option to use another indicator (selected from the Aux input). The 'weighted inputs' are those introduced in Weight Gain 4000, for more details please refer to that listing. These should be treated as experimental, however may prove useful in certain configurations. In this case 'hl-oc2' can be considered an estimate of the candle median and may be a good alternative to the default 'centre' setting of 'hl2', in contrast 'cc-ohlc4' can tend to favour the extremes in the trend direction so could be useful as a faster 'trigger' than the default 'close'.
To cap them off both come with a selection of moving average filters (SMA, EMA, WMA, RMA, HMA, VWMA and a simple VWEMA - note: not elastic) aswell as median and mid-range. 'Centre' can also be set to the output of 'trigger' post-filter which can be useful if working with fast/slow crosses as the basis.
DYNAMICS
This is the main section, comprised of three separate factors: 'TSL', 'ATR' and 'IQR'. The first two should be fairly obvious, 'TSL' (trailing stop loss) is simply a percentage of the 'centre' value while 'ATR' (average true range) is the standard RMA-based version as used in Supertrend, Volatility Stop etc.
The third factor is less common however: 'IQR' (inter-quartile range). In case you are unfamiliar the principle here is, for a given dataset, the greatest 25% and smallest 25% of samples are removed. The remainder is then treated as a set and the range is calculated by highest - lowest. This is a commonly used method in statistical analysis, by removing the extremes it is less prone to influence by outliers and gives a good representation of the main dispersion around the median. In practise i have found it can be a good alternative to ATR, translating better across multiple time-frames due to it representing a fraction of the total range rather than an average of per-candle range like ATR. Used in combination with the others it can also add a factor more representative of longer-term/higher-timeframe trend. By discarding outliers it also benefits from not being impacted by brief pumps/volatility, instead responding only to more sustained changes in trend, such as rallies and parabolic moves. In order to give an accurate result the IQR is calculated using a dataset of high, low and hlcc4 values for all bars within the lookback length. Once calculated this value is then halved which, strictly speaking, makes it a semi-interquartile range.
All three of these components can be used individually or summed together to create a hybrid dynamics factor. Furthermore each multiplier can be set to both positive and negative values allowing for some interesting and creative possibilities. An optional smoothing filter can be applied to the sum, this is a basic SWMA-4 which is can reduce the impact of sudden changes but does incur a noticeable lag. Finally, a basic limiter condition has been hard-coded here to prevent the sum total from ever going below zero.
Capping off this section is a pair of direction multipliers. These simply take the prior dynamics sum and allow for further multiplication applied only to one side (uptrend/lo-stop and downtrend/hi-stop). To see why this is useful consider that markets often behave differently in each direction, we've all seen prices steadily climb over several weeks and then abruptly dump in the process of a day or two, shorter time frames are no stranger to this either. A lack of downside liquidity, a panicked market, aggressive shorts. All these things contribute to significant differences in downward price action. This function allows for tighter stops in one direction compared to the other to reflect this imbalance.
VISUALISATIONS
With all of these options and possibilities, some visual aids are useful. Beneath the dynamics' section are several visual options including both sources post-filter and the actual 'bands' created by the dynamics. These are what govern the stop levels and seeing them in full can help to better understand what our various configurations actually do. We can even hide the stop levels altogether and just use the bands, making this a kind of expanded Keltner Channel. Here we can also find colour and opacity settings for everything we've discussed.
EXAMPLES
The obvious first example here is the standard %-change trailing stop loss which, from my experience, tends to be the best suited for lower time frames. Filtering should probably minimal here. In both charts here we use the default config for source inputs, the top is a standard bi-directional setup with 1.5% tsl while the bottom uses a 2.5% tsl with the histop multiplier reduced to 0 resulting in an uptrend only stoploss.
Shown here in grey is the standard Supertrend which uses 'hl2' as centre and 'close' as trigger, ATR(10) multiplied by 3. On top we have the default filtered source config with ATR(8) multiplied by 2 which gives a different yet functionally similar result, below is the same source config instead using IQR(12) multiplied by 2. Notice here the more 'stepped' response from IQR following the central rally, holding back for a while before closing in on price and ultimately initiating reversal much sooner. Unlike ATR, the length parameter for IQR is absolute and can more significantly affect its responsiveness.
Next we focus on the visualisation options, on top we have the default source config with ATR(8) multiplied by 2 and IQR(12) multiplied by 1. Here we have activated the switch to show 'bands', from this we can see the actual summed dynamics and how it influences the stop levels. Below that we have an altogether different config utilising the included filters which are now visible. In this example we have created a basic 8/21 EMA cross and set a 1% TSL, notice the brief fakeout in the middle which ordinarily might indicate a buy signal. Here the TSL functions as an additional requirement which in this case is not met and thus no buy signal is given.
Finally we have a couple of more 'experimental' examples. On top we have Lazybear's 'Variable Moving Average' in white which has been assigned via 'aux' as the centre with no additional filtering, the default config for trigger is used here and a basic TSL of 1.5% added. It's a simple example but it shows how this can be applied to other indicators. At the bottom we return to the default source config, combining a TSL of 8% with IQR(24) multiplied by -2. Note here the negative IQR with greater length which causes the stop to close in on price following significant deviations while otherwise remaining fairly wide. Combining positive and negative multiples of each factor can yield mixed results, some more useful than others depending upon suitable market conditions.
Since this has been quite lengthy, i shall leave it there. Suffice to say that there are plenty more ways to use this besides these examples. Please feel free to share any of your own ideas in the comments below. Enjoy.

True Range MomentumThe indicator calculates the momentum of bullish and bearish based on the average true range and the highest highs and lowest lows of the historical price.
The indicator displays the strength for either taking a long position, or a short position.
The simplest way to use the indicator is to take a long position when the M+ line crosses above the 0 line. Similarly, to short, the M- line should cross above the 0 line. The exit would be when the respective line crosses below the 0 line.
The contrarian traders should wait for the lines to start rising towards the 0 line and taking an exit. In essence, the line should be going from negative to 0.
The greater the divergence between the M+ and M-, the stronger the trend.
The small table of Long and Short suggests what is in strength. A 100 will show a strong trend in the respective direction. It will be 50-50 when there is no clear direction, ideally identifying a consolidation range.
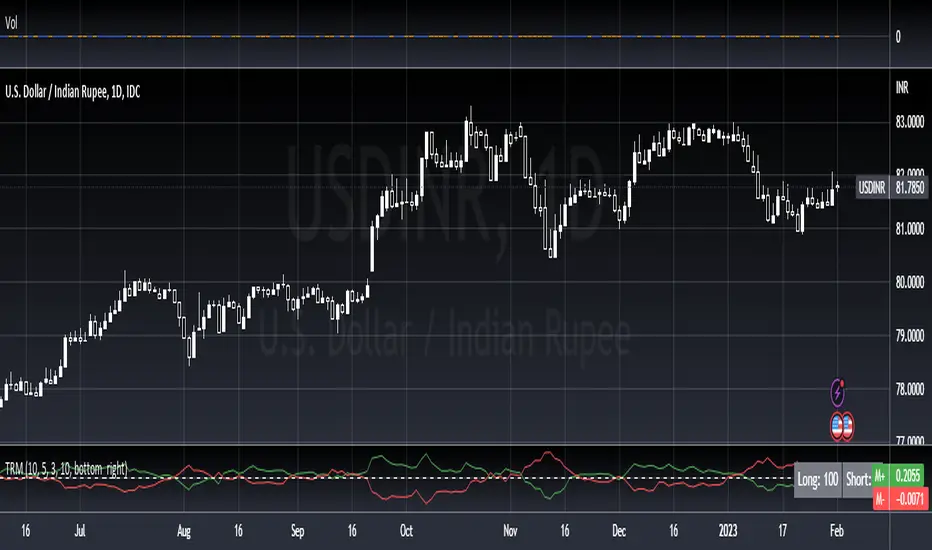
GKD-C ATR-Adaptive, Smoothed Laguerre RSI [Loxx]Giga Kaleidoscope ATR-Adaptive, Smoothed Laguerre RSI is a Confirmation module included in Loxx's "Giga Kaleidoscope Modularized Trading System".
█ Giga Kaleidoscope Modularized Trading System
What is Loxx's "Giga Kaleidoscope Modularized Trading System"?
The Giga Kaleidoscope Modularized Trading System is a trading system built on the philosophy of the NNFX (No Nonsense Forex) algorithmic trading.
What is an NNFX algorithmic trading strategy?
The NNFX algorithm is built on the principles of trend, momentum, and volatility. There are six core components in the NNFX trading algorithm:
1. Volatility - price volatility; e.g., Average True Range, True Range Double, Close-to-Close, etc.
2. Baseline - a moving average to identify price trend
3. Confirmation 1 - a technical indicator used to identify trends
4. Confirmation 2 - a technical indicator used to identify trends
5. Continuation - a technical indicator used to identify trends
6. Volatility/Volume - a technical indicator used to identify volatility/volume breakouts/breakdown
7. Exit - a technical indicator used to determine when a trend is exhausted
How does Loxx's GKD (Giga Kaleidoscope Modularized Trading System) implement the NNFX algorithm outlined above?
Loxx's GKD v1.0 system has five types of modules (indicators/strategies). These modules are:
1. GKD-BT - Backtesting module (Volatility, Number 1 in the NNFX algorithm)
2. GKD-B - Baseline module (Baseline and Volatility/Volume, Numbers 1 and 2 in the NNFX algorithm)
3. GKD-C - Confirmation 1/2 and Continuation module (Confirmation 1/2 and Continuation, Numbers 3, 4, and 5 in the NNFX algorithm)
4. GKD-V - Volatility/Volume module (Confirmation 1/2, Number 6 in the NNFX algorithm)
5. GKD-E - Exit module (Exit, Number 7 in the NNFX algorithm)
(additional module types will added in future releases)
Each module interacts with every module by passing data between modules. Data is passed between each module as described below:
GKD-B => GKD-V => GKD-C(1) => GKD-C(2) => GKD-C(Continuation) => GKD-E => GKD-BT
That is, the Baseline indicator passes its data to Volatility/Volume. The Volatility/Volume indicator passes its values to the Confirmation 1 indicator. The Confirmation 1 indicator passes its values to the Confirmation 2 indicator. The Confirmation 2 indicator passes its values to the Continuation indicator. The Continuation indicator passes its values to the Exit indicator, and finally, the Exit indicator passes its values to the Backtest strategy.
This chaining of indicators requires that each module conform to Loxx's GKD protocol, therefore allowing for the testing of every possible combination of technical indicators that make up the six components of the NNFX algorithm.
What does the application of the GKD trading system look like?
Example trading system:
Backtest: Strategy with 1-3 take profits, trailing stop loss, multiple types of PnL volatility, and 2 backtesting styles
Baseline: Hull Moving Average as shown on the chart above
Volatility/Volume: Volatility Ratio as shown on the chart above
Confirmation 1: ATR-Adaptive, Smoothed Laguerre RSI as shown on the chart above
Confirmation 2: Williams Percent Range
Continuation: Fisher Transform
Exit: Rex Oscillator
Each GKD indicator is denoted with a module identifier of either: GKD-BT, GKD-B, GKD-C, GKD-V, or GKD-E. This allows traders to understand to which module each indicator belongs and where each indicator fits into the GKD protocol chain.
Giga Kaleidoscope Modularized Trading System Signals (based on the NNFX algorithm)
Standard Entry
1. GKD-C Confirmation 1 Signal
2. GKD-B Baseline agrees
3. Price is within a range of 0.2x Volatility and 1.0x Volatility of the Goldie Locks Mean
4. GKD-C Confirmation 2 agrees
5. GKD-V Volatility/Volume agrees
Baseline Entry
1. GKD-B Baseline signal
2. GKD-C Confirmation 1 agrees
3. Price is within a range of 0.2x Volatility and 1.0x Volatility of the Goldie Locks Mean
4. GKD-C Confirmation 2 agrees
5. GKD-V Volatility/Volume agrees
6. GKD-C Confirmation 1 signal was less than 7 candles prior
Continuation Entry
1. Standard Entry, Baseline Entry, or Pullback; entry triggered previously
2. GKD-B Baseline hasn't crossed since entry signal trigger
3. GKD-C Confirmation Continuation Indicator signals
4. GKD-C Confirmation 1 agrees
5. GKD-B Baseline agrees
6. GKD-C Confirmation 2 agrees
1-Candle Rule Standard Entry
1. GKD-C Confirmation 1 signal
2. GKD-B Baseline agrees
3. Price is within a range of 0.2x Volatility and 1.0x Volatility of the Goldie Locks Mean
Next Candle:
1. Price retraced (Long: close < close or Short: close > close )
2. GKD-B Baseline agrees
3. GKD-C Confirmation 1 agrees
4. GKD-C Confirmation 2 agrees
5. GKD-V Volatility/Volume agrees
1-Candle Rule Baseline Entry
1. GKD-B Baseline signal
2. GKD-C Confirmation 1 agrees
3. Price is within a range of 0.2x Volatility and 1.0x Volatility of the Goldie Locks Mean
4. GKD-C Confirmation 1 signal was less than 7 candles prior
Next Candle:
1. Price retraced (Long: close < close or Short: close > close )
2. GKD-B Baseline agrees
3. GKD-C Confirmation 1 agrees
4. GKD-C Confirmation 2 agrees
5. GKD-V Volatility/Volume Agrees
PullBack Entry
1. GKD-B Baseline signal
2. GKD-C Confirmation 1 agrees
3. Price is beyond 1.0x Volatility of Baseline
Next Candle:
1. Price is within a range of 0.2x Volatility and 1.0x Volatility of the Goldie Locks Mean
3. GKD-C Confirmation 1 agrees
4. GKD-C Confirmation 2 agrees
5. GKD-V Volatility/Volume Agrees
█ ATR-Adaptive, Smoothed Laguerre RSI
What is ATR-Adaptive, Smoothed Laguerre RSI?
ATR-Adaptive, Smoothed Laguerre RSI is an adaptive Laguerre RSI indicator with smoothing to reduce noise. The Laguerre RSI indicator created by John F. Ehlers is described in his book "Cybernetic Analysis for Stocks and Futures". For this version, Instead of using fixed periods for Laguerre RSI calculation, this indicator uses an ATR ( average True Range ) adapting method to adjust the calculation period. This makes the RSI more responsive in some periods (periods of high volatility ), and smoother in order periods (periods of low volatility). There are two signal types: middle and levels.
Requirements
Inputs
Confirmation 1 and Solo Confirmation: GKD-V Volatility / Volume indicator
Confirmation 2: GKD-C Confirmation indicator
Outputs
Confirmation 2 and Solo Confirmation: GKD-E Exit indicator
Confirmation 1: GKD-C Confirmation indicator
Continuation: GKD-E Exit indicator
Additional features will be added in future releases.
