ER-Adaptive ATR [Loxx]Average True Range (ATR) is widely used indicator in many occasions for technical analysis. It is calculated as the RMA of true range. This version adds a "twist": it uses Perry Kaufman's Efficiency Ratio to calculate adaptive true range
You can use this indicator the same way you'd use the standard ATR.
Average True Range (ATR)

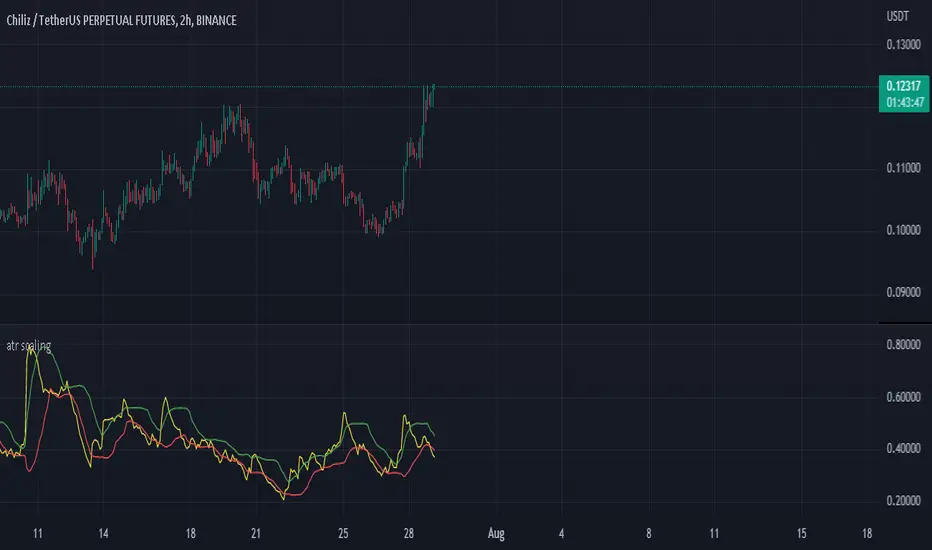
ATR Scaling IndicatorATR Scaling Indicator
Objective - Use for entry point
Description - ATR Scaling is the introduction of Average True Range to scaling it into 1 Standard diviation. Since the average Ture Range in general has a wide distribution of data, we need to scaling the data to reduce fragmentation.
Applications - The principle of ATR Scaling is to use it as an entry point when the value of the Scaling ATR crosses above the lower band of the Bolinger Band.
Recommendation - The fact that ATR Scaling has crossed above the lower band is not indicative of a trend in the market. ATR Scaling should be used in conjunction with indicators used to filter trend, for example Supertrend, Exponancial Moving Average.
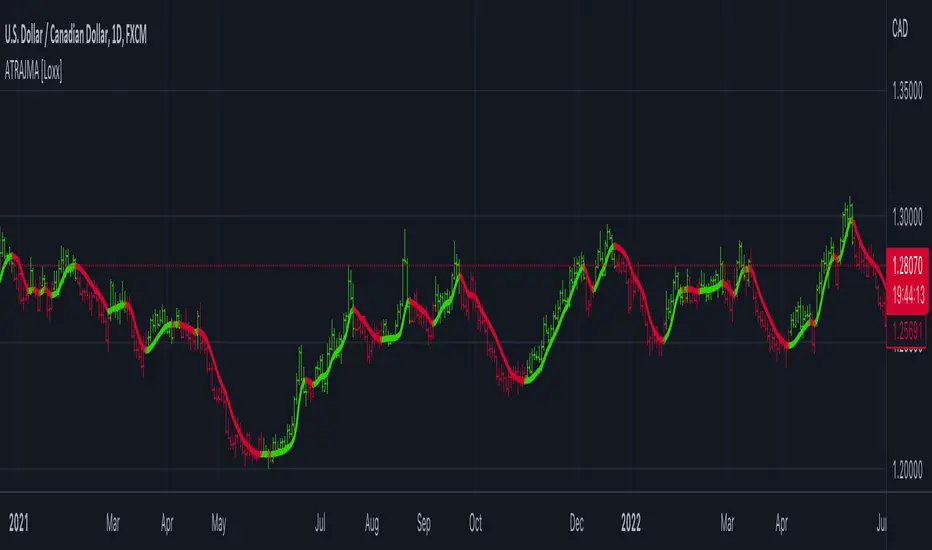
ATR-Adaptive JMA [Loxx]Not many know that the JMA (Jurik Moving Average) is already an adaptive indicator (it is adapting using the usual market volatility monitoring mode). Hence, making it adaptive "once more" makes it double adaptive. Fro the adaptivity in this case, we are use ATR (Average True Range) to make the JMA double adaptive. The ATR period is the same as the JMA period (there is no separate setting for that) so the usage of the indicator is as simple as it gets.
What is Jurik Volty used in the Juirk Filter?
One of the lesser known qualities of Juirk smoothing is that the Jurik smoothing process is adaptive. "Jurik Volty" (a sort of market volatility ) is what makes Jurik smoothing adaptive. The Jurik Volty calculation can be used as both a standalone indicator and to smooth other indicators that you wish to make adaptive.
What is the Jurik Moving Average?
Have you noticed how moving averages add some lag (delay) to your signals? ... especially when price gaps up or down in a big move, and you are waiting for your moving average to catch up? Wait no more! JMA eliminates this problem forever and gives you the best of both worlds: low lag and smooth lines.
Included:
Bar coloring
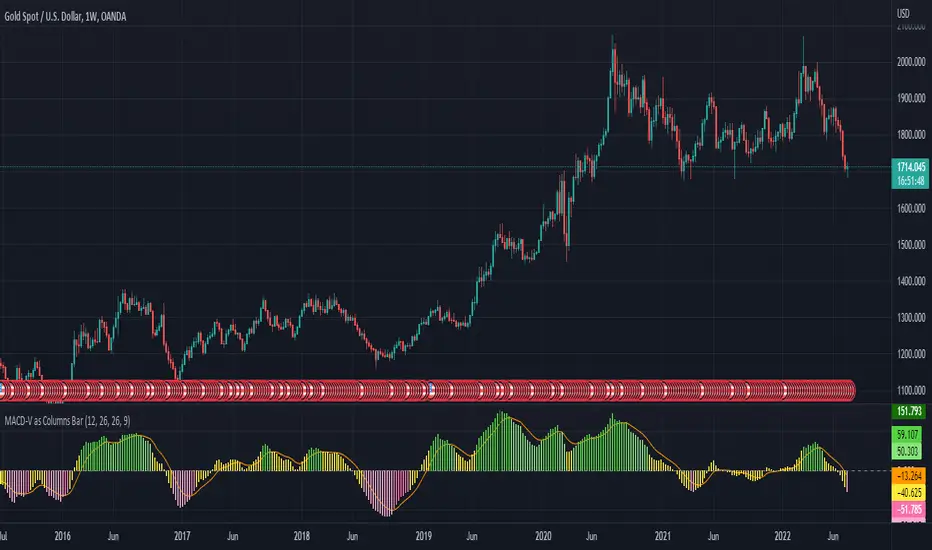
MACD-V as Columns BarI use MACD-V as Columns Bar and including the signal line
Not use MACD-V - Signal Line as Histogram
Enjoy!
ATR Multiplier OverlayFunctions like ATR Multiplier by bjr117, but is overlaid on chart to make your setting of stop-loss and take profit levels easier.
Simply set the multiplier, script will take the ATR for that time with whatever setting, multiply it with your input and plot that number plus and minus each candle close.
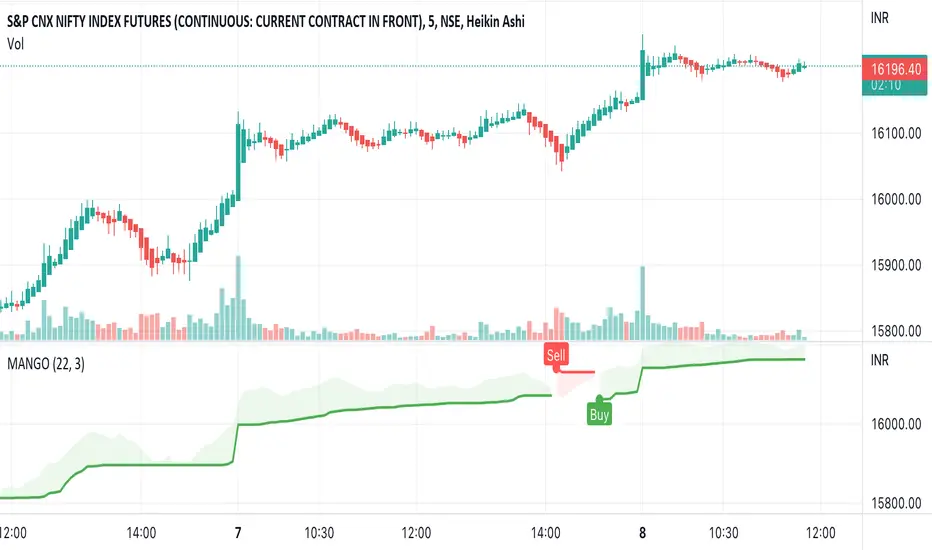
SST-V2this scrips is combination of Moving average that you can alter with buy and Sell signal.
it is easy to use. u can go with the trend as of the bar color turn to blue it is indcate tha ur in bullish trend
and with turn to red it indicate that your in down trend.
Use Ema 200 for trend confluences
hope you like it.
thank's
Sadflute

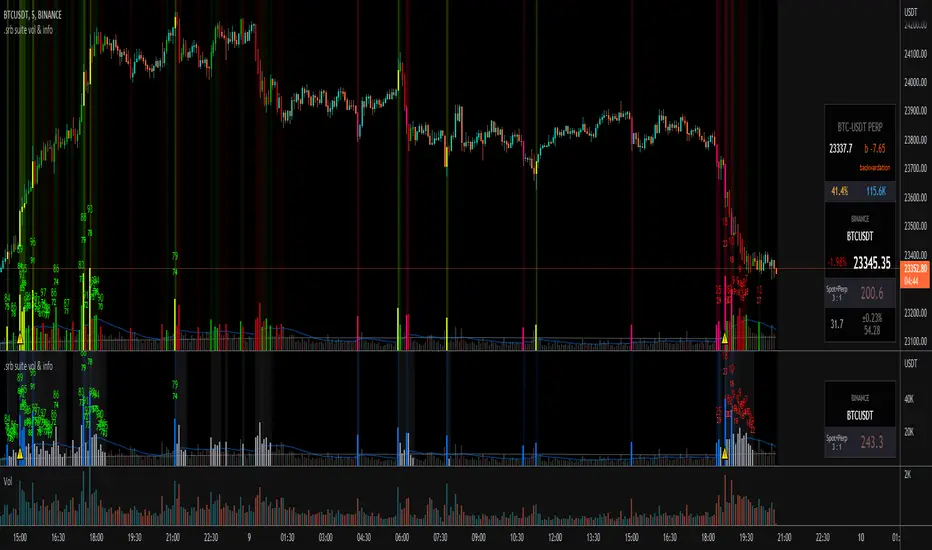
.srb suite vol & infoThe volume indicator
what can replace the built-in volume indicator and It also has some useful features.
and designed to work as overlay in the same pane with open-source indicator by default.
Regular volume Indicator
Volume SMA plot
Large Volume ! emphasize by color & mark.
Ultra Volume ! overlay marking ; x2 x4 x6 lager than regular average volume. it will help you can take the reversal
BTC-agg. Volume
4 BTC-spot & 4 BTC-PERP volume aggregated.
It might helps you don't miss out on important volume flows.
Weighted to spot trading volume when using PERP+spot volume.
If enabled, BTC-agg.Vol automatically applied when selecting BTC-pair.
Information panel (optimized for crypto-currency)
BTC-PERP price & delta (when Binance:BTCUSDT selected)
BTC dominance, Binance:BTCUSDTPERP OI
Symbol, Price, Daily up/down
ATR14 (for checking current volatility)
Recommended setup for .srb suite
tradingview | chart setting > Appearance > Top margin 0%, Bottom margin 0% for optimized screen usage
tradingview | chart setting > Appearance > Right margin 57
.srb suite vol & info --> Visual Order > Bring to Front
.srb suite vol & info --> Pin to scale > No scale (Full-screen)
Volatility Pivot Support and Resistance [Loxx]Volatility Pivot Support and Resistance calculates "pivots" (support/resistance lines) based on current symbol/timeframe Average True Range calculated volatility.
What is Average True Range?
The average true range (ATR) is a technical analysis indicator, introduced by market technician J. Welles Wilder Jr. in his book New Concepts in Technical Trading Systems, that measures market volatility by decomposing the entire range of an asset price for that period.
The true range indicator is taken as the greatest of the following: current high less the current low; the absolute value of the current high less the previous close; and the absolute value of the current low less the previous close. The ATR is then a moving average, generally using 14 days, of the true ranges.
Included:
-Bar coloring

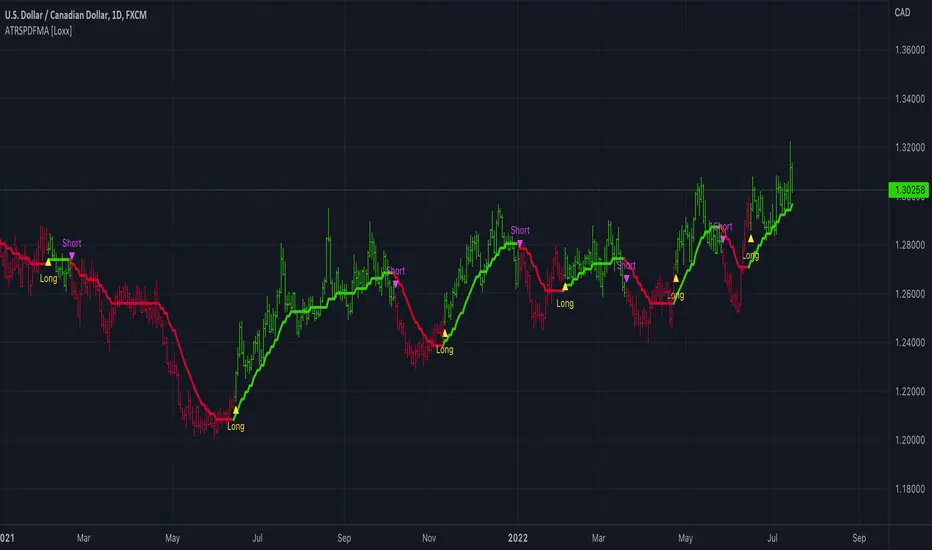
ATR-Stepped PDF MA [Loxx]ATR-Stepped PDF MA is and ATR-stepped moving average that uses a probability density function moving average.
What is Probability Density Function?
Probability density function based MA is a sort of weighted moving average that uses probability density function to calculate the weights.
Included:
-Toggle on/off bar coloring
-Toggle on/off signals
-Alerts long/short
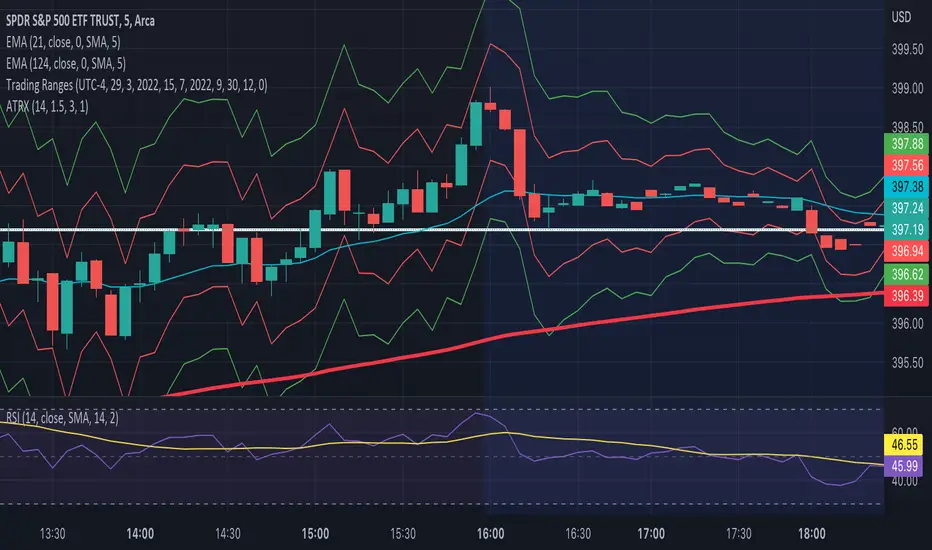
RVOL/ATR LabelRelative Volume and Average True Range are critical for quick decision-making and managing risk. Even if the setup is there for a day trade, having a high relative volume on the name helps with confirmation to put on the risk. Additionally, using ATR to define your risk is a very helpful way to quickly size your trade in the moment. This indicator provides the ability immediately assess whether a trade is worth taking, as well as defining risk for the trade.
HOW TO USE
Our relative volume calculation looks at the cumulative volume up until the current minute of the day, and compares that with the same calculation of the previous 5 trading days. We have provided an "RVOL Threshold" input, which paints the RVOL square green if it is greater than or equal to this number (otherwise, it is red). We prefer an RVOL value of at least 2; however, feel free to change this value to your preference.
OUTPUTS
This indicator prints the RVOL and ATR values in the top right of your chart for quick and easy decision-making (as described above). If the RVOL value is greater than or equal to your RVOL Threshold, the square will be green. Use the color-coding to your advantage when making quick decisions.
Happy Trading!

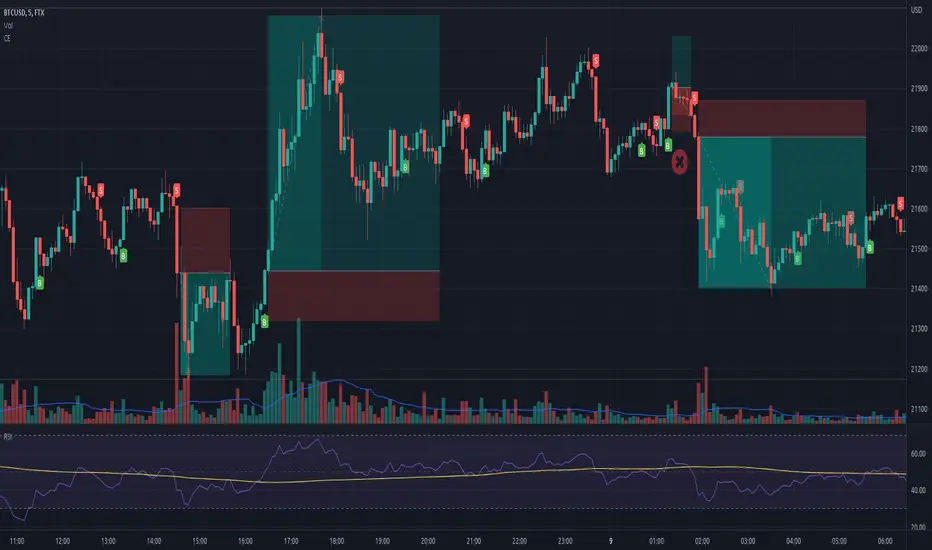
Chandelier Exit - Heikin AshiThis is a redesign of the Chandelier Exit indicator. It removes stupid transitions between Chandelier Exit' states and highlights initial points for both lines.
This indicator was originally developed by Charles Le Beau and popularized by Dr . Alexander Elder in his book "Come Into My Trading Room: A Complete Guide to Trading" (2002).
In short, this is a trailing stop-loss based on the Average True Range (ATR).
If "Heikin Ashi for calculation" is checked, then ATR and buy/sell signals are calculated based on heikin ashi candles.
You don't need to change bar style to heikin ashi.
Thanks to everget for the initial version.
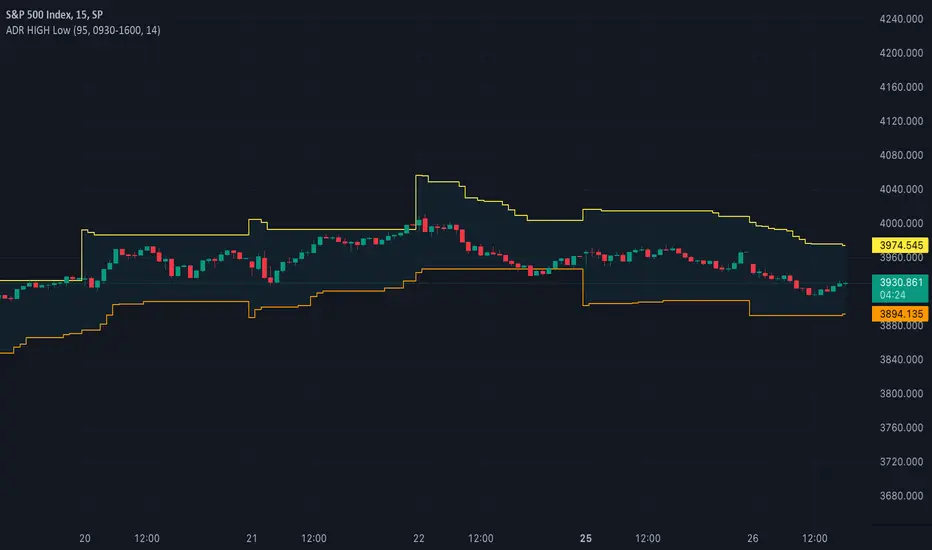
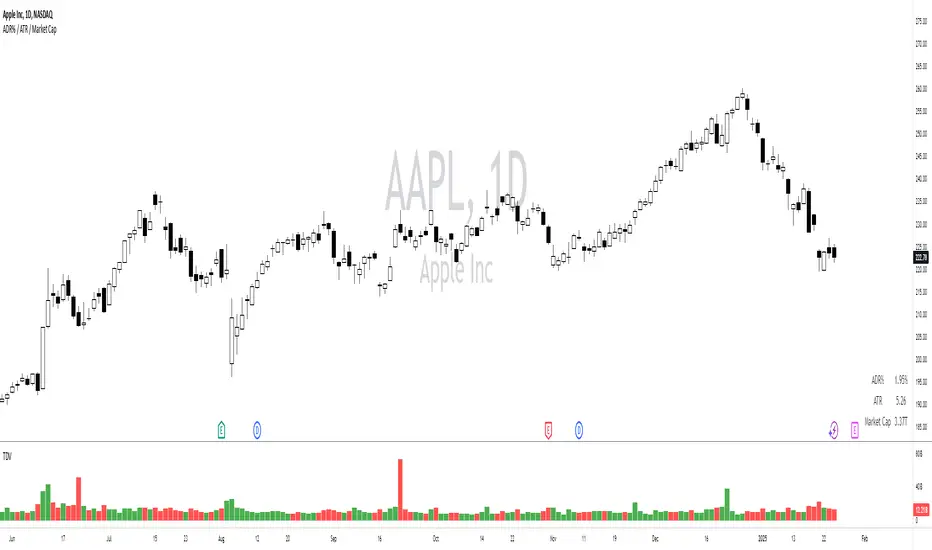
ADR% / ATR / Market CapDisplays the following values in a table in the upper right corner of the chart:
ADR%: Average daily range (in percent).
ATR: Average true range (hidden by default).
Market Cap: Total value of all a company's shares of stock.
All values are calculated based on daily bars, no matter what time frame you are currently viewing. Doesn't work for time frames >1D, which is why the table is not shown on weekly/monthly charts.
Credit to MikeC / TheScrutiniser and GlinckEastwoot for ADR% formula, and ArmerSchlucker for the original script which includes LoD Dist . instead of Market Cap.
ATR alerts & backtestingThe Basics
Alert will trigger if the current (real time) price surpasses the high of the ATR of the previous bar. (can also be set for the Low of the ATR). Each time the follow up candle surpasses the high of the previous ATR, the background will be coloured orange. This makes back testing easier on the eye. This can be turned off.
- Colours can be changed.
- Can also set a color and alert when the current price surpasses the Low of the ATR of the previous bar.
- ATR distance can be changed.
- Can be used on different chart types.
- Can be used as entry or exits in combination with bots.
- Can display only ATR top or bottom or both.
Example
An alert will trigger if the price of the current bar surpasses the red dot (ATR) of the previous bar.
Alerts can be created on all timeframes, if this is within your Tradingview plan.
Final Words
Disclaimer: Please use it with care and at own risk. The owner of this indicator is not liable for any financial losses.
Past performance is no guarantee of future returns.

Rets High/Low (2.0 Special Uncensored Edition)This script can be used as a visual aid in seeing the last highs and lows of price in a specific time period. It automatically updates the plots if new highs or lows are made within the given lookback period.
This is a fairly basic version currently, with new added features coming in future updates such as range between high/low and half and whole number detection.

Spinn ATR targetNot quite the usual approach to plotting targets on the chart, where the price will come with a given probability.
The indicator draws targets by studying the ATR of the target timeframe. More precisely, this is not exactly an ATR - the price move is taken from the closing price of the previous bar and is calculated both up and down separately.
The settings specify the percentage used to calculate the price move, at which the specified percentage of bars reached this price move in the past.
Simply put, if we set 50% in the settings, this means that a line will be drawn at the level at which the price reached this level in 50% of cases over a given period.
--
Не совсем обычный подход к построению целей на графике, куда цена придет с заданной вероятностью.
Индикатор рисует цели, изучая ATR целевого таймфрейма. Точнее, это не совсем ATR - ход цены берется от цены закрытия предыдущего бара и считается отдельно как вверх, так и вниз.
В настройках задается процент, исходя из которого вычисляется ход цены, при котором заданный процент баров достигал этого хода цены ранее.
Проще говоря, если мы задаем в настройках 50%, то это означает, что будет построена линия на том уровне, на котором цена в 50% случаев за заданный период достигала этого уровня.

Fake breakHi Traders,
I've developed an indicator which can detect fake-breaks on the chart.
In the following you'll find the definition of the fake break candles and also you will find how to recognize it on the chart with practical examples.
What is the fake break pattern?
Sometimes support and resistance lines broke with a full body and strong candles that gives us the idea of sharp movements on the chart but suddenly the next candle returns all the path of the previous candle. in this case we can say fake break is happening on the chart.
This indicator detect fake break patterns based on two criteria:
1. It uses AverageTrueRange indicator to measure the strength of the pattern.
2. The returning candle should engulf minimum 75% of the break candle.
This indicator plot 2 terms in the name of "FB-D" and "FB-U" that are abbreviations of the "Fake Break Down" and "Fake Break Up".
You can also set alerts to get notified when fake breakout happens on the chart.
Notice: This pattern is only acceptable in valid support and resistance zones and you can not rely on it everywhere on the chart (specially in the middle of the waves).
Notice: The source code of this indicator is open and you are allowed to use it on your scripts by mentioning the name of author.
Disclaimer: This is not a financial advice or any signal to buy or sell, the goal of developing such an indicator is to use for educational purposes.

Spinn ATR tableThe table contains summary data on the ATR from different timeframes and for different periods. You can view both absolute values and the percentage of the average price move to the current price.
This data can be used to compare the ATR on different timeframes. And, most importantly, you can compare the ATR of different coins.
In addition, the last column shows the average deviation of the ATR for each of the timeframes. You can compare these values on different coins to determine which ones are more volatile .
Note.
Using the indicator on different timeframes may give slightly different values due to the difference in the stored data for these timeframes.
--
В таблице собраны сводные данные по ATR с разных таймфреймов и за разные периоды. Можно просматривать как абсолютные значения, так и процентное соотношение среднего хода цены к текущей цене.
Эти данные можно использовать, чтобы сравнить ATR на разных таймфреймах. И, самое главное, можно сравнивать ATR разных монет.
Кроме того, в последней колонке указано среднее отклонение ATR по каждому из таймфреймов. Можно сравнивать эти значения на разных монетах, чтобы определить - какие из них более волатильны .
Примечание.
Использование индикатора на разных таймфреймах может давать слегка разные значения из-за разницы в хранимых данных для этих таймфреймов.

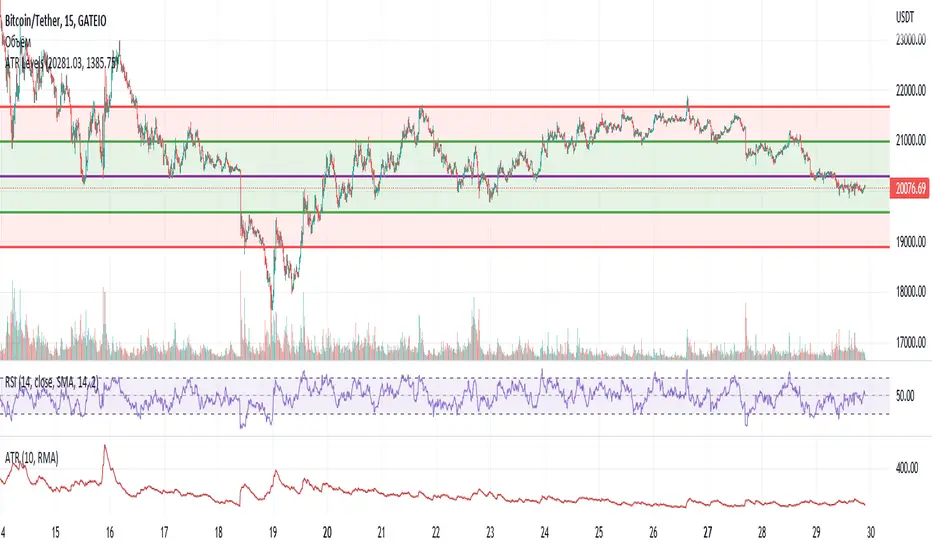
ATR LevelsATR Levels
The indicator plots levels based on the ATR indicator
Initial data required for the indicator:
- Open price
- ATR
Levels are calculated as follows:
1. Open price +100% ATR
2. Open price +50% ATR
3. Open price
4. Open price -50% ATR
5. Open price -100% ATR
For visual convenience:
The area between levels 1-2 and 4-5 is filled with red
Zone between levels 2-4 - filled with green
Уровни среднего истинного диапазона
Индикатор строит уровни, основанные на индикаторе ATR (Средний истинный диапазон)
Исходные данные, необходимы для индикатора:
- Цена открытия
- ATR (Средний истинный диапазон)
Уровни рассчитываются следующим образом:
1. Цена открытия +100% ATR
2. Цена открытия +50% ATR
3. Цена открытия
4. Цена открытия -50% ATR
5. Цена открытия -100% ATR
Для удобства визуального восприятия:
Зона между уровнями 1-2 и 4-5 заполнена красным цветом
Зона между уровнями 2-4 - заполнена зеленым цветом
Percentage Average True RangeCalculates the percentage movement of an instrument per day.
Default is 1 period ATR (ATR(1)) but this can be changed in the settings.
Maths - (ATR (1)/closing price)*100
Above is the ATR (1)
Below is the %ATR(1)
Average True Range MultipliedModified version of an Average True Range indicator. You could adjust the multiplication of the ATR value on the settings. I personally use this indicator for a turtle trading strategy so I don't have to use calcuator to manually multiply the ATR value by two.

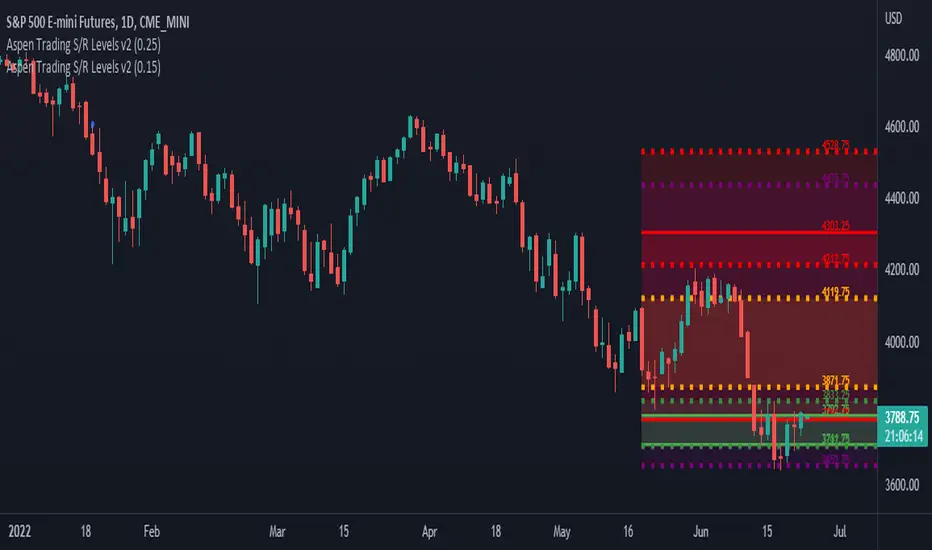
Aspen Trading S/R Levels v2In Trading, Objectivity Trumps Subjectivity
“Every trader is a steaming hot bowl of bias stew and must maintain self-awareness and lucidity behind the screens as the trading day oscillates between boredom and terror.”
The above quote is from a good friend of mine and veteran FX trader Brent Donnelly. It completely nails the biggest challenge for new and even experienced traders: being as objective as possible when making trading decisions.
Yes, as you become more experienced, subjectivity, market feel and experience are part of one’s decision-making matrix, but early on you do not have that luxury.
If you start each day knowing that price action in the market is random it will remind you to think objectively. There are, however, repeatable patterns that occur again and again…..it’s your job to identify them.
That’s where Support & Resistance levels come in.
Definitions: “Support” and “Resistance” Levels
Many technical indicators and tools can be subjective and challenging to learn. This is not the case with support and resistance levels.
Support and resistance are terms for two price levels on a chart that appear to limit the security’s range of movement.
The “support level” is where the price regularly stops falling and bounces up.
The “resistance level” is where the price normally stops rising and dips back down.
The more frequently a price hits either level, the more reliable that level is likely to be in predicting future price movements.
Understanding Support and Resistance Levels
Remember, the more informed and objective we can be with numbers, the more confident we can be with our trades. That’s important because, although price action is random (a fact that has been proven time and time again), there are repeatable patterns we can use to get an edge.
Two of those objective data points we can use to gain an edge are support and resistance levels. These are two of the best tools we have when it comes to swing trading. Why? Because they give us strong data points that suggest where an instrument is likely (and unlikely) to go.
But this is really key: Arbitrarily cataloging each price level that appears to be relevant as a support or resistance level isn’t going to get you far. That’s why Aspen Trading takes a unique approach to support and resistance levels.
With Aspen’s Support & Resistance Levels, we measure where trades (prices) occur in terms of frequency. This gives us a sense of where market participants are wagering prices may go.
That’s about as raw and unfiltered as you can get in terms of displaying what has taken place. There’s no room for interpretation - this is raw data that can be used to get a sense of where prices may be heading.
Learning The “Four Sets” of Support and Resistance Levels
There are four sets of support and resistance levels that are part of Aspen Trading’s S/R framework.
Each set of support and resistance levels is unique to a specified period of time. We display each of them in different colors on our charts when we analyze trades to make it easy for us to understand the data as we get comfortable reading charts.
You’ll see each of these levels on display in the charts that follow below. The four sets of support and resistance levels are classified as follows:
There are four sets of support and resistance levels that are displayed by Aspen Trading’s S/R Analysis Tool. Each one is unique to a specified period of time that we then display directly on the chart. The levels are classified as follows
GREEN: displays 2 dotted lines (upper/lower)
ORANGE: displays 2 dotted lines (upper/lower)
RED: displays 2 dotted lines (upper/lower)
PURPLE: displays 2 dotted lines (upper/lower)
IMPORTANT:
What’s the distinction between the 4 color levels?
Essentially think of these levels on a rising scale of importance. While GREEN levels are certainly key, they do not hold the same level of significance as the PURPLE levels.
To get access to Aspen's S/R Levels - simply purchase an annual license for $595 at the link below. Once the transaction is complete, we will email you asking you for your TradingView username and get you permisisoned within 12-hours.