Backtest

High and Low Levels Backtest This script shows a high and low period value.
Width - width of lines
SelectPeriod - Day or Week or Month and etc.
LookBack - Shift levels 0 - current period, 1 - previous and etc.
You can change long to short in the Input Settings
WARNING:
- For purpose educate only
- This script to change bars colors.

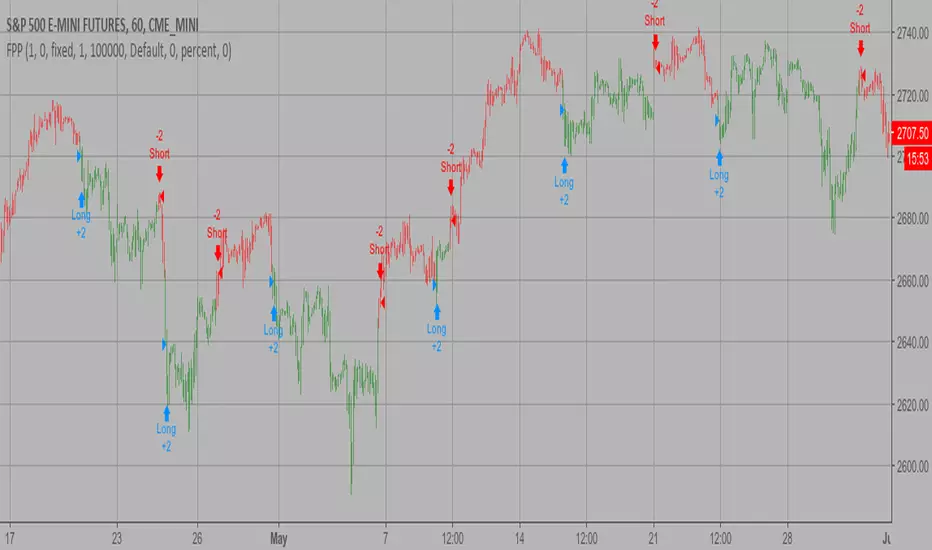
Floor Pivot Points Backtest The name ‘Floor-Trader Pivot,’ came from the fact that Pivot points can
be calculated quickly, on the fly using price data from the previous day
as an input. Although time-frames of less than a day can be used, Pivots are
commonly plotted on the Daily Chart; using price data from the previous day’s
trading activity.
You can change long to short in the Input Settings
WARNING:
- For purpose educate only
- This script to change bars colors.
[STRATEGY]Kagi Emulator OCC & SLTP V3It is a Kagi candle emulator without resolution multiplier.
Also with take profit and stop loss.
Modify the value of "reversal" according to current symbol.
It's the backtest, coming soon, same script but with no-repainting alerts
Enjoy!

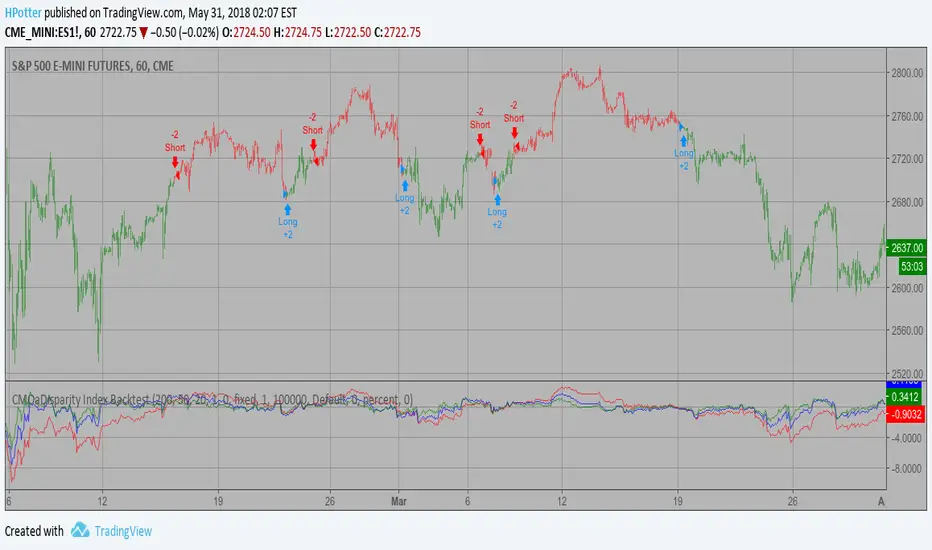
CMOaDisparity Index Backtest The related article is copyrighted materialfrom Stocks & Commodities Dec 2009
My strategy modification.
You can change long to short in the Input Settings
WARNING:
- For purpose educate only
- This script to change bars colors.
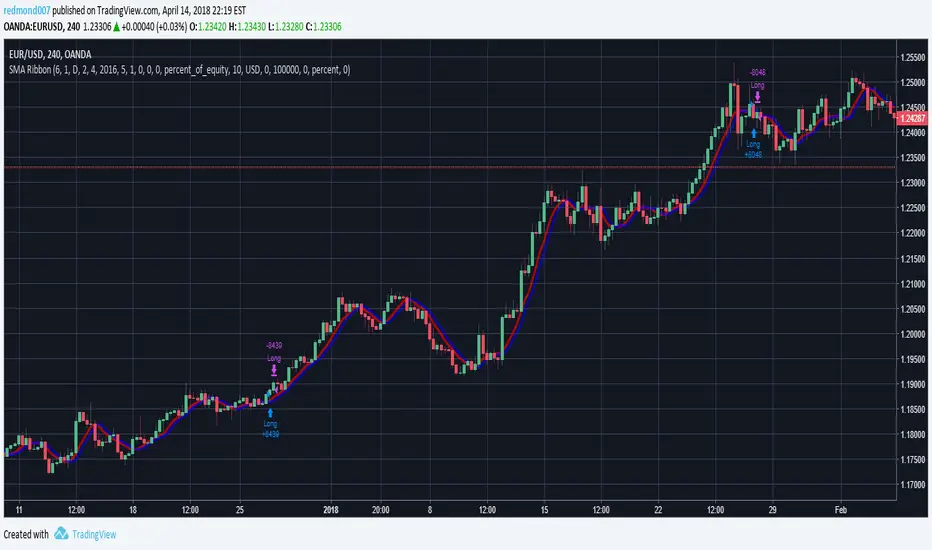
Dual Timeframe SMA Ribbon Crossover Backtest// Backtesting Dual SMA Ribbon Crossover Strategy
// see f.bpcdn.co
// including time limiting
Turned this study into a backtest.
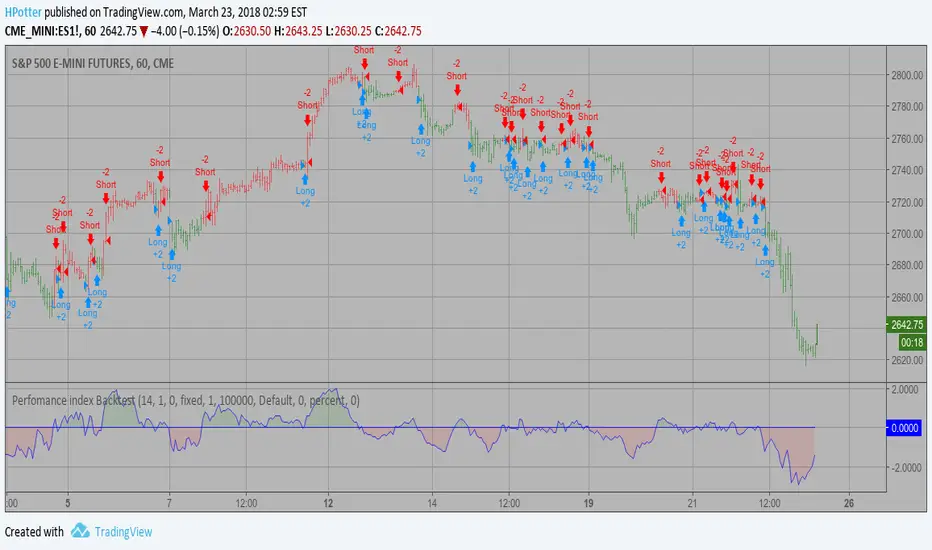
Perfomance index Backtest The Performance indicator or a more familiar term, KPI (key performance indicator),
is an industry term that measures the performance. Generally used by organizations,
they determine whether the company is successful or not, and the degree of success.
It is used on a business’ different levels, to quantify the progress or regress of a
department, of an employee or even of a certain program or activity. For a manager
it’s extremely important to determine which KPIs are relevant for his activity, and
what is important almost always depends on which department he wants to measure the
performance for. So the indicators set for the financial team will be different than
the ones for the marketing department and so on.
Similar to the KPIs companies use to measure their performance on a monthly, quarterly
and yearly basis, the stock market makes use of a performance indicator as well, although
on the market, the performance index is calculated on a daily basis. The stock market
performance indicates the direction of the stock market as a whole, or of a specific stock
and gives traders an overall impression over the future security prices, helping them decide
the best move. A change in the indicator gives information about future trends a stock could
adopt, information about a sector or even on the whole economy. The financial sector is the
most relevant department of the economy and the indicators provide information on its overall
health, so when a stock price moves upwards, the indicators are a signal of good news. On the
other hand, if the price of a particular stock decreases, that is because bad news about its
performance are out and they generate negative signals to the market, causing the price to go
downwards. One could state that the movement of the security prices and consequently, the movement
of the indicators are an overall evaluation of a country’s economic trend.
You can change long to short in the Input Settings
WARNING:
- For purpose educate only
- This script to change bars colors.
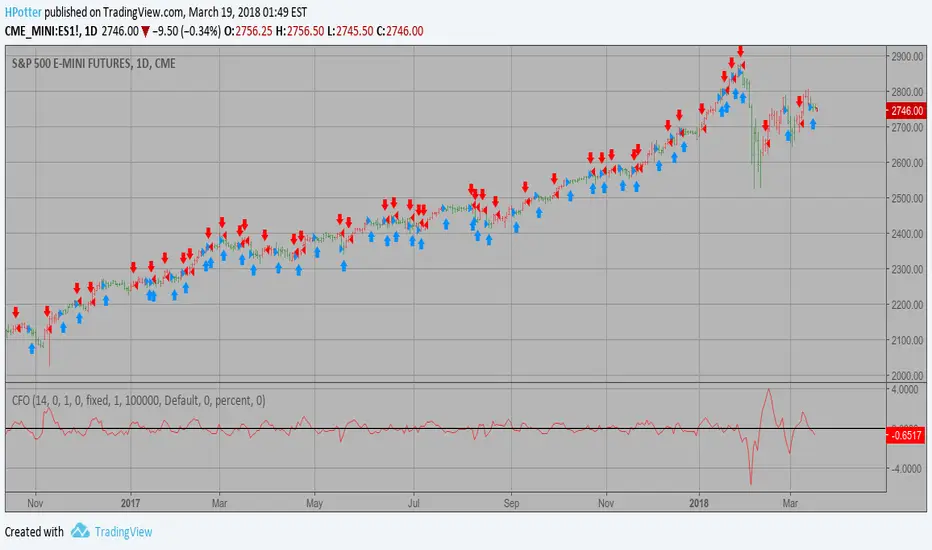
Chande Forecast Oscillator Backtest The Chande Forecast Oscillator developed by Tushar Chande The Forecast
Oscillator plots the percentage difference between the closing price and
the n-period linear regression forecasted price. The oscillator is above
zero when the forecast price is greater than the closing price and less
than zero if it is below.
You can change long to short in the Input Settings
WARNING:
- For purpose educate only
- This script to change bars colors.
Fractal Chaos Bands Backtest The FCB indicator looks back in time depending on the number of time periods trader selected
to plot the indicator. The upper fractal line is made by plotting stock price highs and the
lower fractal line is made by plotting stock price lows. Essentially, the Fractal Chaos Bands
show an overall panorama of the price movement, as they filter out the insignificant fluctuations
of the stock price.
You can change long to short in the Input Settings
WARNING:
- For purpose educate only
- This script to change bars colors.

How To Set Backtest Date RangeExample how to select and set date range window to be backtested. Normally when you change chart period it changes the number of days being backtested which means as you increas the chart period (for example from 5min to 15min) you also increase the number of days traded, so you can not compare apples to apples for which period would yield best returns for your strategy. Now you can. Incorporate this code replacing buy and sell with your strategy, then simply input the From and To dates in Format -> Inputs, and then change the chart period to view updated results.
NOTE: There is a limit in backtesting to 2000 orders, so please be aware of this when setting your date ranges. If you set your range too high, you may be exceeding this limit on some periods and not on others, so this would yield incorrect comparison of returns per period. If you see in your backtesting results that you are nearing this limit for one of your periods you are testing, then reduce the date range to a smaller number of days.
Enjoy!
(Thanks to @Gesundheit "Adeel" for pointing me in the right direction on this!)
MACD Crossover Backtest MACD – Moving Average Convergence Divergence. The MACD is calculated
by subtracting a 26-day moving average of a security's price from a
12-day moving average of its price. The result is an indicator that
oscillates above and below zero. When the MACD is above zero, it means
the 12-day moving average is higher than the 26-day moving average.
This is bullish as it shows that current expectations (i.e., the 12-day
moving average) are more bullish than previous expectations (i.e., the
26-day average). This implies a bullish, or upward, shift in the supply/demand
lines. When the MACD falls below zero, it means that the 12-day moving average
is less than the 26-day moving average, implying a bearish shift in the
supply/demand lines.
A 9-day moving average of the MACD (not of the security's price) is usually
plotted on top of the MACD indicator. This line is referred to as the "signal"
line. The signal line anticipates the convergence of the two moving averages
(i.e., the movement of the MACD toward the zero line).
Let's consider the rational behind this technique. The MACD is the difference
between two moving averages of price. When the shorter-term moving average rises
above the longer-term moving average (i.e., the MACD rises above zero), it means
that investor expectations are becoming more bullish (i.e., there has been an
upward shift in the supply/demand lines). By plotting a 9-day moving average of
the MACD, we can see the changing of expectations (i.e., the shifting of the
supply/demand lines) as they occur.
You can change long to short in the Input Settings
WARNING:
- For purpose educate only
- This script to change bars colors.

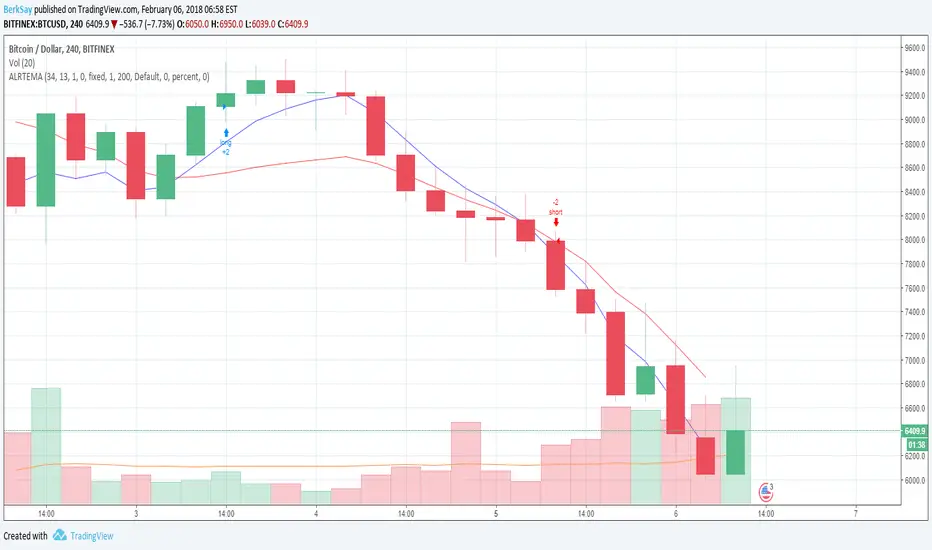
Kaufman Moving Average Adaptive (KAMA) Backtest Everyone wants a short-term, fast trading trend that works without large
losses. That combination does not exist. But it is possible to have fast
trading trends in which one must get in or out of the market quickly, but
these have the distinct disadvantage of being whipsawed by market noise
when the market is volatile in a sideways trending market. During these
periods, the trader is jumping in and out of positions with no profit-making
trend in sight. In an attempt to overcome the problem of noise and still be
able to get closer to the actual change of the trend, Kaufman developed an
indicator that adapts to market movement. This indicator, an adaptive moving
average (AMA), moves very slowly when markets are moving sideways but moves
swiftly when the markets also move swiftly, change directions or break out of
a trading range.
You can change long to short in the Input Settings
Please, use it only for learning or paper trading. Do not for real trading.

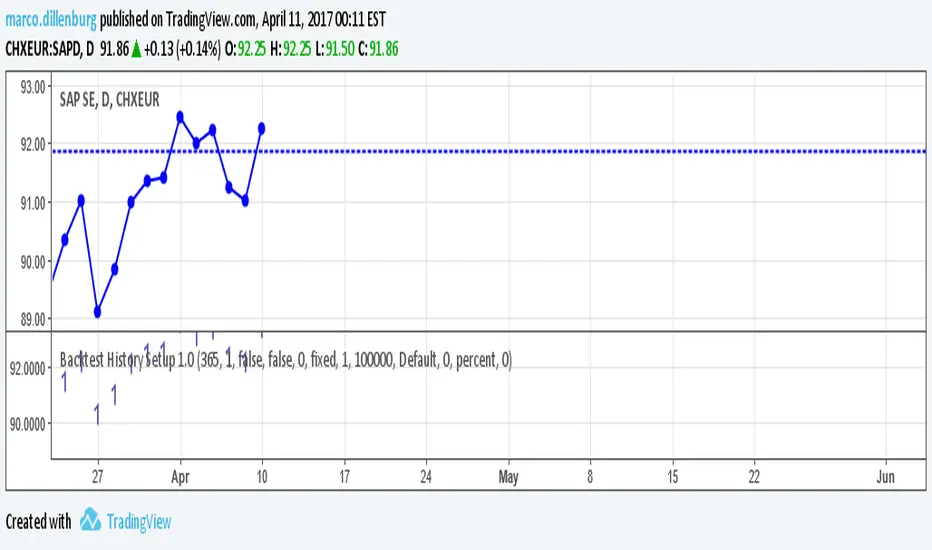
Backtest History Setup 1.0Script of strategy component to setup the backtext lookback. You setup the maximum days back in the history, which will be used for backtest.
15 Minute Gold Trend-Following StrategyThis is the main strategy that I will be forward testing on demo for a month or two, then making it an EA in MetaTrader4
You can see the code for yourself this time, all the strategy is, is a crossover of various moving averages.
Commission included, $10,000 account.
Results over the past 3 months, beginning in January 2017.

1-2-3 Reversal Backtest StrategyThis is backtesting script.
This System was created from the Book "How I Tripled My Money In The
Futures Market" by Ulf Jensen, Page 183. This is reverse type of strategies.
The strategy buys at market, if close price is higher than the previous close
during 2 days and the meaning of 9-days Stochastic Slow Oscillator is lower than 50.
The strategy sells at market, if close price is lower than the previous close price
during 2 days and the meaning of 9-days Stochastic Fast Oscillator is higher than 50.

MACD, backtest 2015+ only, cut in half and doubledThis is only a slight modification to the existing "MACD Strategy" strategy plugin!
found the default MACD strategy to be lacking, although impressive for its simplicity. I added "year>2014" to the IF buy/sell conditions so it will only backtest from 2015 and beyond ** .
I also had a problem with the standard MACD trading late, per se. To that end I modified the inputs for fast/slow/signal to double. Example: my defaults are 10, 21, 10 so I put 20, 42, 20 in. This has the effect of making a 30min interval the same as 1 hour at 10,21,10. So if you want to backtest at 4hr, you would set your time interval to 2hr on the main chart. This is a handy way to make shorter time periods more useful even regardless of strategy/testing, since you can view 15min with alot less noise but a better response.
Used on BTCCNY OKcoin, with the chart set at 45 min (so really 90min in the strategy) this gave me a percent profitable of 42% and a profit factor of 1.998 on 189 trades.
Personally, I like to set the length/signals to 30,63,30. Meaning you need to triple the time, it allows for much better use of shorter time periods and the backtests are remarkably profitable. (i.e. 15min chart view = 45min on script, 30min= 1.5hr on script)
** If you want more specific time periods you need to try plugging in different bar values: replace "year" with "n" and "2014" with "5500". The bars are based on unix time I believe so you will need to play around with the number for n, with n being the numbers of bars.

4H CCI Strategy 1.5Included adaptive lot size based on ATR, and also ATR based stop and take profit levels.
Risk/reward increased to 1:2 and should work in all ranging FX pairs as long as they are not trending.
Once the market starts trending it'll eat this bot alive.
Cheers,
Ivan Labrie
Time at Mode FX

4H CCI Strategy 1.4Here's the last version...quick hack job.
I'm sure it can be improved, but this is a rough sketch, code wise.
The strategy works in range bound enviroments, so cointegrated pairs like AUDCAD will shine with it.
Cheers,
Ivan Labrie
Time at Mode FX
