Bullish ATR Level indicatorThis indicator is used by OVTLYR Golden Ticket Trading strategy to determine the stop loss and option rollover levels. Super simple indicator that just shows the current price, -1/2 ATR for a stop loss and 1 and 2 ATR levels for possible take profit or option rollover points.
Jalur dan Saluran

IMT智能趋势引擎系统 v3.1 (发布版)It is best to use 15-minute K-line charts with a winning rate of over 75%, which are trend-following indicators and can filter out oscillations

EMAS imalezunEl Analisis mas completo con este cojunto de EMAS, para tener una mayor proyeccion del precio

Engulfing Candlestick Pattern - BB FilterBeen working on doing a better version of this. This is like version 2.0. Usese this definition of an engulfing candle:
tradeciety.com/how-to-trade-the-engulfing-candlestick-pattern
As you change the parameters of the Bollinger band the signals will change.
You can also set the distance away from the band using ATR muliplier to catch moves near the BB.
Per Claude,
This setup should give you much higher quality signals since you're filtering for engulfing patterns that occur at the extremes of the Bollinger Bands - exactly like the Tradeciety article recommends. Those are the setups with the best context and highest probability.
A few tips for using it:
You can adjust the BB Touch Distance slider if you want to be stricter or more lenient about what counts as "touching" the bands
Try enabling Strict Mode if you want only the strongest engulfing patterns (where the full range including wicks is engulfed)
Works great on higher timeframes like Daily and Weekly for the most reliable signals on NQ and ES
I personally use this on the 1000 tick NQ chart.
It's not perfect but 2x better than my first attempt. Enjoy.
Open to suggestions as well.
For entertainment purposes only.

Engulfing Candlestick Pattern - BB FilterBeen working on doing a better version of this. This is like version 2.0. Usese this definition of an engulfing candle:
tradeciety.com
As you change the parameters of the Bollinger band the signals will change.
You can also set the distance away from the band using ATR muliplier to catch moves near the BB.
Per Claude,
This setup should give you much higher quality signals since you're filtering for engulfing patterns that occur at the extremes of the Bollinger Bands - exactly like the Tradeciety article recommends. Those are the setups with the best context and highest probability.
A few tips for using it:
You can adjust the BB Touch Distance slider if you want to be stricter or more lenient about what counts as "touching" the bands
Try enabling Strict Mode if you want only the strongest engulfing patterns (where the full range including wicks is engulfed)
Works great on higher timeframes like Daily and Weekly for the most reliable signals on NQ and ES
I personally use this on the 1000 tick NQ chart.
It's not perfect but 2x better than my first attempt. Enjoy.
Open to suggestions as well.
For entertainment purposes only.

Volume Climax Reversal (VCR) — Catch Exhaustion Tops & BottomsNew! VCR spots exhaustion spikes at highs/lows using volume extremes + price action + VWAP context.
If you trade parabolic runners, indices, or mean-reversion edges, VCR helps you time the backside (shorts) and fade capitulation (longs) with clean, rule-based signals.
What it does
Detects volume climax: current volume > SMA(len) × multiplier and a new volume high in the lookback.
Confirms price context: makes a higher high (for tops) or lower low (for bottoms).
Filters with VWAP (optional): bearish signals only below VWAP, bullish signals only above VWAP.
Optional wick filter: requires an exhaustion wick > body to reduce chop.
Why traders like it
Clear entries: “VCR↓” (bearish) at exhaustion tops, “VCR↑” (bullish) at washout lows.
Fewer false signals: VWAP gating + wick filter focus on true climaxes.
Built-in alerts: set once, get notified on your phone/desktop when a setup appears.
How I trade it (simple playbook)
Bearish reversal (short / puts)
Wait for VCR↓ (exhaustion at/near HH).
Look for a lower high that fails to reclaim the signal candle high.
Enter on the break of that lower-high candle low.
Stop above the signal wick high.
Covers/targets: VWAP first; then 20–30% fade from the local top / prior demand.
Bullish reversal (long / calls)
Wait for VCR↑ (capitulation at/near LL).
Look for a higher low that holds above the signal candle low.
Enter on the break of the HL candle high.
Stop below the signal wick low.
Targets: VWAP first; then prior supply/MA bands.
Tip for small-cap/“Dux” style: VCR pairs perfectly with a gap + high USD-rotation scan. Let them blow off, then use VCR for the timing.
Inputs (tune to your market)
Volume SMA Length (default 20)
Volume Spike Multiplier (default 2.0)
Lookback High / Low (default 10 / 10)
Require VWAP confirmation? (on)
Use wick filter? (on)
Works on stocks, indices, futures, crypto.
Timeframes: 1–15m for day trading; 1h–4h–D for swing.
Alerts
Set one (or both) alerts and forget it:
Bearish Volume Climax — VCR↓
Bullish Volume Climax — VCR↑
You’ll get instant notifications when a qualified top/bottom prints.
Best practices
Don’t countertrend the first front-side ramp—wait for the VCR and a lower-high/higher-low.
Respect VWAP: it’s your first profit-taking and a bias filter.
Size small into volatility; widen stops in fast markets.
Combine with your watchlist filters (gap %, float/O/S, USD rotation, session timing).
What’s included
Clean visual signals (triangles + subtle background shading)
Session-anchored VWAP
Alert conditions that appear in TradingView’s alert menu
Sensible defaults + clear docs (this post)
FAQ
Q: Does it repaint?
No. VCR uses completed-bar data; signals print end-of-bar.
Q: Which markets?
Anything with volume: US equities, futures, crypto, indices.
Q: Can I use it for scalps?
Yes—1–5m with wick filter on and VWAP required works well.
Get more / upgrades
I’m iterating fast (MTF filter, heatmap panel, combined “one-alert” mode).
Want the pro template with dashboard & combined alerts? Message me on TV or DM / email you@domain.com
.
Risk Notice
This is educational research, not financial advice. Markets carry risk—always manage position size and use stops.
If this helped you, smash the 👍 and ⭐ — it really helps!
#volume #vwap #reversal #exhaustion #trendreversal #smallcaps #scalping #daytrading #swingtrading #stocks #futures #crypto #indicator

VWAP + Volume Spikes See Where Smart Money ExhaustsVolume tells the truth. VWAP tells the bias. This script shows both — live.
If you trade intraday momentum, reversals, or liquidity sweeps, this indicator is built for you.
It shows where volume spikes hit extreme levels, anchored around VWAP and its dynamic bands, so you can instantly spot capitulation or hidden absorption.
🎯 What This Indicator Does
✅ Plots VWAP — session-anchored, updates automatically
✅ Adds dynamic VWAP bands — standard deviation envelopes showing volatility context
✅ Highlights volume spikes — colored candles + background for abnormal prints
✅ Includes alerts — “Volume Spike”, “VWAP Cross”, or a combined alert with direction
✅ Clean visual design — instantly readable in fast markets
It’s your visual orderflow radar — whether you’re trading gold, indices, or small caps.
🔍 Why It Works
Institutions build and unwind positions around VWAP.
Retail often chases volume… this script shows you when that volume becomes too extreme.
A spike above VWAP near resistance? → Likely distribution.
A spike below VWAP near support? → Likely capitulation.
Combine volume exhaustion + VWAP context, and you’ll see market turning points form before most indicators react.
⚙️ Inputs You Can Tune
Bands lookback: adjusts how reactive the VWAP bands are
Band width (σ): set how tight or wide your deviation envelope is
Volume baseline length: controls how “abnormal” a spike must be
Spike threshold: multiplier vs. average volume
Toggle color-coding, bands, and labels
Default settings work well across 1m–15m intraday charts and 1h–4h swing frames.
💡 How Traders Use It
1️⃣ Fade Parabolics:
When a green spike candle pierces upper VWAP band on high volume → smart money unloading.
Look for rejection and short into VWAP.
2️⃣ Catch Capitulations:
When a red spike candle dumps below lower VWAP band → panic selling.
Watch for stabilization and long back to VWAP.
3️⃣ VWAP Rotation Plays:
Alerts for price crossing VWAP help you spot shift in intraday control.
Above VWAP = buyers in charge.
Below VWAP = sellers in charge.
🧠 Best Practices
Pair it with Volume Profile or Delta/Flow tools to confirm exhaustion.
Don’t chase — wait for spike confirmation + reversal candle.
Use it on liquid tickers (NASDAQ, SPY, GOLD, BTC, etc.).
Great for Dux-style small-cap shorts or index pullbacks.
🔔 Alerts Ready
Choose from:
Volume Spike (single-bar explosion)
VWAP Cross Up/Down (trend shift confirmation)
One Combined Alert (any signal, includes ticker, price, and volume)
Set once — get real-time push notifications, Telegram, or webhook signals.
📊 My Favorite Setups
US100 / NASDAQ: fade rallies above VWAP + spike
Gold / Silver: trade reversals from VWAP bands
Small caps: short back-side after volume climax
ES, DAX, Oil: scalp VWAP rotation with confluence
❤️ Support This Work
I release free and premium scripts weekly — combining smart money concepts, VWAP tools, and volume analytics.
👉 Follow me on TradingView for more indicators and setups.
👉 Comment “🔥” if you want me to post the multi-timeframe VWAP + Volume Pressure version next.
👉 Share this with your team — it helps the community grow.


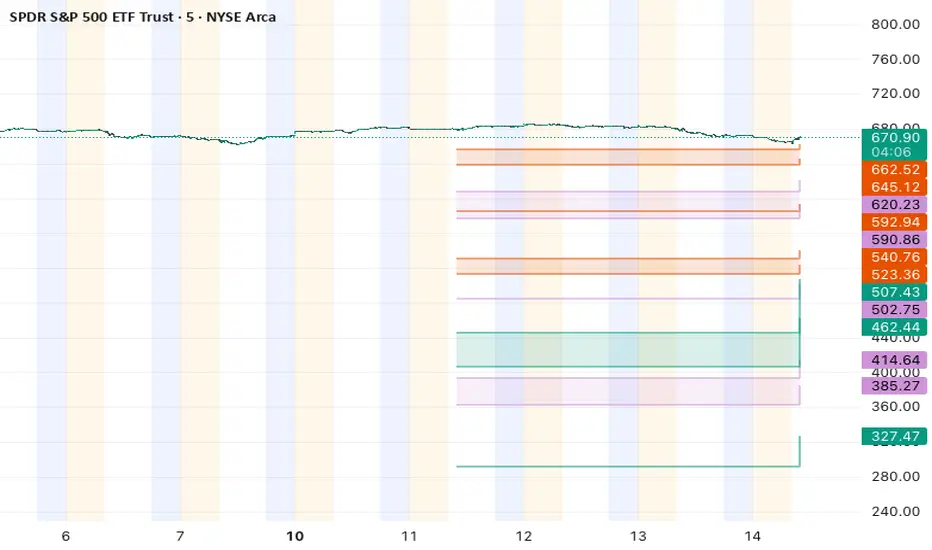
SPY Levels on ES# SPY Levels on ES - Professional Support & Resistance Indicator
## 🎯 Overview
Transform your S&P 500 futures trading with precision-engineered SPY support and resistance levels. This professional-grade indicator displays critical SPY price levels directly on your ES (E-mini S&P 500) and MES (Micro E-mini S&P 500) charts, providing institutional-quality analysis for retail traders.
## ⚡ Key Features
### 📊 Dual-Level System
- Whole Number Levels : 10 closest round SPY levels around current price
- Half Levels : 0.5 increment levels for granular analysis
- Smart Scaling : Automatically converts SPY levels to ES/MES prices
### 🎨 Professional Visualization
- Clean Design : Minimalist lines that don't clutter your chart
- Customizable Colors : Choose your own colors for whole and half levels
- Historical Extension : Lines extend across your entire chart for context
- Dynamic Labels : Real-time SPY price display with clear level identification
### ⚙️ Intelligent Features
- Auto-Detection : Works seamlessly on SPY, ES, and MES charts
- Real-Time Updates : Levels adjust automatically as SPY price moves
- Performance Optimized : Efficient code that won't slow down your charts
- Flexible Settings : Toggle levels on/off based on your trading style
## 🎯 Perfect For
- ES Futures Traders seeking SPY correlation levels
- MES Micro Futures traders needing precise entry/exit points
- SPY Options Traders analyzing support/resistance zones
- Day Traders requiring quick visual reference points
- Swing Traders identifying key technical levels
## 📈 How It Works
The indicator fetches real-time SPY prices and calculates the 10 closest whole number levels (e.g., 580, 581, 582) plus half levels (580.5, 581.5, 582.5) around the current price. When applied to ES or MES charts, it automatically scales these levels to match futures pricing, giving you precise SPY-correlated support and resistance zones.
## 🔧 Customization Options
- SPY Price Label : Toggle on/off
- Whole Number Levels : Show/hide with custom colors
- Half Levels : Show/hide with custom colors and transparency
- Visual Styling : Personalize colors to match your chart theme
## 💡 Trading Applications
- Support/Resistance : Identify key psychological levels
- Entry/Exit Points : Use levels for precise trade execution
- Risk Management : Set stops and targets at significant levels
- Market Structure : Understand institutional price zones
- Confluence Analysis : Combine with other technical indicators

Asian Range [FE]This script will help you mark out the Asian session range as well as write down your trading rules at the top right corner,

Keltner Channels (StevenCharts) [LONGTERM]This indicator plots Keltner Channels from your current timeframe plus three fully customizable Higher Timeframes (HTF) simultaneously.
It is designed for multi-timeframe analysis, allowing you to see how price interacts with long-term support and resistance levels without ever leaving your chart. All HTF levels are non-repainting and plot as clean, stable "steps."
Key Features:
Four Timeframes in One: Plots Current, HTF 1, HTF 2, and HTF 3.
"Band Zones": Each HTF features an inner "band" based on a percentage of the total channel width.
Built-in Reversion Signals: Get buy/sell signals (triangles) when price closes back inside the selected channel.
Signal Source Selector: Choose which timeframe's bands (Current or HTF) you want to use for generating signals and alerts.
Time Filter: Includes an option to only show levels for the most recent 'X' days, keeping your chart clean and focused.
Keltner Channels {StevenCharts}This indicator plots Keltner Channels from your current timeframe plus three fully customizable Higher Timeframes (HTF) simultaneously.
It is designed for multi-timeframe analysis, allowing you to see how price interacts with long-term support and resistance levels without ever leaving your chart. All HTF levels are non-repainting and plot as clean, stable "steps."
Key Features:
Four Timeframes in One: Plots Current, HTF 1, HTF 2, and HTF 3.
"Band Zones": Each HTF features an inner "band" based on a percentage of the total channel width.
Built-in Reversion Signals: Get buy/sell signals (triangles) when price closes back inside the selected channel.
Signal Source Selector: Choose which timeframe's bands (Current or HTF) you want to use for generating signals and alerts.
Time Filter: Includes an option to only show levels for the most recent 'X' days, keeping your chart clean and focused.


Smart MA Crossover█ OVERVIEW
"Smart MA Crossover" is a technical analysis indicator designed to enhance the effectiveness of strategies based on MA crossovers, combining classic moving average crossovers with breakouts from boxes and dynamic trend visualizations. The indicator is fully customizable—you can freely adjust both parameters and graphical elements.
█ CONCEPTS
Trading approaches based solely on moving average crossover moments generate a large number of false signals. Smart MA Crossover was created to improve this statistic. That's why boxes are added, which are formed from the candle where the MA crossover occurred and generate signals only upon breakout from them. The boxes have bullish (green) and bearish (red) colors. By default, the show_only_matching filter is enabled, displaying entry signals only when the breakout direction matches the box color (e.g., only upward for a bullish box). Boxes are by default the size of the candle on which the crossover occurred, but their size can be adjusted to suit your strategy via an optional average candle size multiplier.
█ FEATURES
- Moving Averages: Two configurable MAs (fast_length, default 10; slow_length, default 30) with selectable type (SMA, EMA, WMA, HMA, VWMA). Optionally displayed with gradient fill between them (color depends on trend: green for uptrend, red for downtrend).
- MA Gradient and Candle Coloring: Enable gradient fill between MAs (transparency: gradient_opacity, default 85) and dynamic candle coloring based on trend (green/red).
- Fog Gradient Trend: Multi-layered gradient "fog" around hl2, consisting of 5 levels up and down, with offset based on average candle size (offset_mult, default 0.7) and increasing transparency (base_transp, default 80; transp_inc, default 4). Fog colors are dynamic (green/red).
- Breakout Boxes: Created at the moment of MA crossover, extending to the right. Box height optionally multiplied by average candle size (use_box_multiplier, box_multiplier, default 1.0). Boxes close and generate a signal when price breaks out beyond the top/bottom edge.
Signals:
- Triangles: Green downward triangles (buy breakout) below the bar, red upward triangles (sell breakout) above the bar—only on breakouts matching direction (if show_only_matching = true). When the matching filter is disabled, every box generates a signal based not on the MA crossover, but on the breakout direction.
- Labels: “BUY” (green, below bar) and “SELL” (red, iabove bar) with transparent background (transparency 40).
- Matching Filter: The show_only_matching option limits signals to breakouts consistent with box direction (bullish box → only buy, bearish → only sell).
- Visualization: Gradient MA lines, fill between MAs, multi-layered fog with increasing transparency, boxes with transparent background (85) and colored borders, dynamic trend colors.
- Alerts: Built-in alerts for BUY and SELL signals (with message including ticker and timeframe).
█ HOW TO USE
Add to Chart: Apply the indicator via Pine Editor or the Indicators menu on TradingView.
Configure Settings:
- MA Settings: Adjust fast (fast_length, default 10) and slow (slow_length, default 30) MA lengths and type (ma_type, default SMA).
- Visualization: Enable/disable MA lines (show_ma_lines), MA gradient (use_gradient_ma), fog trend (show_fog), candle coloring (color_candles).
- Boxes and Breakouts: Enable candle size multiplier (use_box_multiplier) and set value (box_multiplier, default 1.0). Enable signal filter (show_only_matching).
- Signals: Choose type (signal_type): Triangles or Labels (Buy/Sell).
- Fog Trend: Adjust offset (offset_mult), base transparency (base_transp), and increment (transp_inc). Select trend colors (col_up, col_dn).
Signal Interpretation:
- Buy Signals: Green triangles below the bar or “BUY” label—on upward breakout from a bullish box (after bull cross).
- Sell Signals: Red triangles above the bar or “SELL” label—on downward breakout from a bearish box (after bear cross).
- Fog and Gradient: green fog/fill = uptrend; red = downtrend.
- Boxes: Active boxes indicate potential breakout zones; their closure confirms the move.
Signal Confirmation: Use with other tools, such as support/resistance levels, volume, or additional MAs to filter false crossovers.
█ APPLICATIONS
- MA Cross Strategies: Replace classic crossovers—boxes and breakouts eliminate many false signals, thereby increasing effectiveness. Confirm with other indicators, e.g., RSI, Fibonacci, FVG, pivot levels.
- Trend Following: Can be used as a classic trend indicator, especially with larger MA values.
█ NOTES
- Test the indicator across different timeframes and assets, adjusting MA lengths and box multiplier to market volatility.
- In consolidating markets, the indicator generates more false signals.

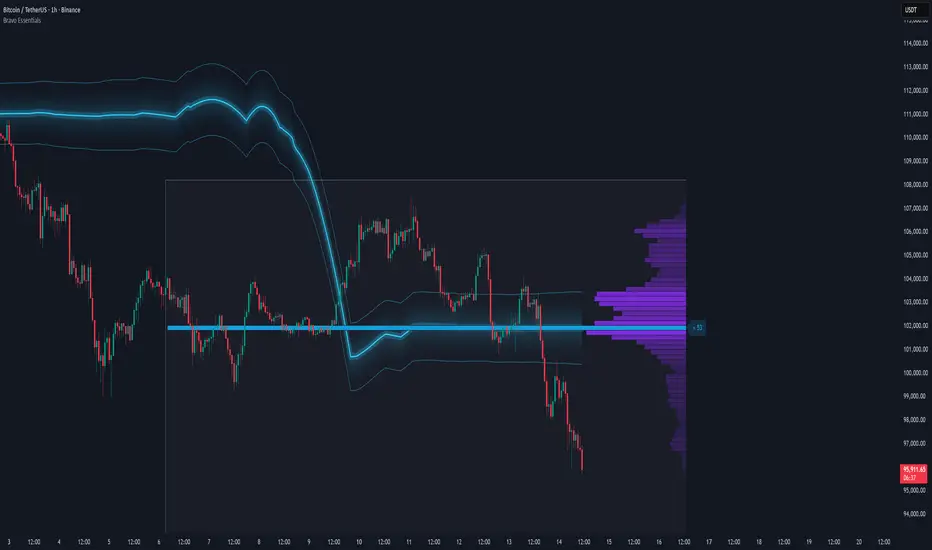
Bravo EssentialsThe Bravo Essentials is a mini toolkit of volume based analysis tools for traders. By combining analysis of multiple market dimensions we created this toolkit for traders that want a clean setup for analysing volume and trends.
The Normalized Volume and Volatility Frequency Profile
This is a specialized analytical indicator that integrates volatility-adjusted volume data with a price frequency distribution profile. It provides a multidimensional perspective of how trading activity and volatility interact across different price levels, allowing for a deeper understanding of where market participation is most concentrated and how price dynamics evolve over time.
Unlike traditional volume or profile indicators that treat volume and volatility separately, this tool adjusts volume relative to volatility, creating a more balanced and context-aware representation of market behavior. This helps traders observe how changes in volatility influence participation, and where stable or reactive zones tend to form in the price structure.
The indicator displays a visual box made up of two main components:
Normalized Volume with Volatility Adjustment, displayed at the bottom, showing how trading activity responds to varying levels of volatility.
Price Frequency Profile — positioned on the right side, mapping how often price has traded at each level and highlighting the Point of Control (POC), the area of highest activity or equilibrium.
Key Features
- Normalized Volume & Volatility Display
Illustrates trading activity in context with volatility changes, revealing periods of expansion and contraction that may not appear on raw volume charts.
- Frequency Distribution Profile
Displays the density of price interactions across the selected range, helping highlight zones where the market has spent the most time.
- Point of Control (POC)
Marks the level with the highest concentration of price activity, often an area of balance or a potential inflection point.
- Adaptive Scaling
Automatically adjusts to market conditions, ensuring consistent readability during both high and low volatility periods.
- Gradient Visualization
Uses color intensity to convey the strength of both volume and frequency data, aiding quick interpretation.
- Customizable Parameters
Includes options to modify lookback length, bin count, and color palette to suit different charting preferences.
How to Use
- Volume and Volatility Context
Detect transitions between low-activity consolidation and high-activity breakout conditions by comparing normalized volume behavior with price movement.
- Market Structure Analysis
Identify areas of balance and imbalance within the price range, offering potential support and resistance cues.
- Trend Assessment
Analyze the relationship between rising or falling normalized volume and directional price changes to evaluate momentum consistency.
- Breakout Confirmation
Observe how price behaves around the POC; a breakout with increasing normalized volume can reinforce directional conviction.
Pre-Move Compression Zones
Recognize low-volatility regions that often precede significant directional expansions.
The Dynamic POC
The Dynamic Point of Control (Dynamic POC) is a price based key level that continuously adapts to evolving market conditions. It represents the price area where the most trading activity or volume concentration has occurred within a defined lookback period. This level effectively marks the market’s short-term “center of gravity,” providing valuable insight into areas of balance, interest, and potential reaction.
Unlike static profile based POC levels that are calculated once and remain fixed, the Dynamic POC recalculates in real time as new data forms. This makes it more responsive to intraday structure and better suited for active trading environments where market balance can shift quickly. The inclusion of volatility-based upper and lower bands adds further context, helping traders assess how far price has deviated from equilibrium and whether current movement is expanding or reverting toward balance.
Key Features
- Adaptive Price Equilibrium
Continuously tracks the most active price zone within a rolling window, updating dynamically as market conditions evolve.
- Volume-Weighted Logic
Reflects where the greatest market participation occurs, highlighting levels where buyers and sellers have historically agreed on value.
- Volatility Bands
Optional upper and lower boundaries expand and contract based on market volatility, visually defining zones of potential overextension or compression.
- Color-Coded Visualization
Uses clear, consistent coloring to distinguish the POC line and its volatility envelopes, making it easy to interpret balance shifts at a glance.
- Customizable Width and Lookback
Adjustable parameters allow traders to fine-tune sensitivity and precision depending on the timeframe or strategy focus.
How to Use
- Market Balance Indicator
When price remains close to the Dynamic POC, it suggests equilibrium—markets are balanced and consolidating.
- Directional Bias Filter
Sustained movement above the Dynamic POC often reflects bullish control, while persistent price action below can indicate bearish sentiment.
- Reversion & Breakout Context
Tests of the upper or lower volatility bands can precede mean reversion toward the POC, while clean breaks beyond them may confirm continuation momentum.
- Support and Resistance Framework
The Dynamic POC frequently aligns with short-term support or resistance zones, making it a useful anchor for trade entries, targets, and risk placement.
By combining both the POC and the Volume Frequency Profile we are able to build up a system of confluence whereby we can locate pockets of larger volume in the market. Generally speaking these are good areas to be setting areas for entries, exits and stop losses.
Multi Rolling VWAPMulti Rolling VWAP Indicator
Displays 4 volume-weighted average price (VWAP) levels on your chart:
7D VWAP - Weekly rolling average
30D VWAP - Monthly rolling average
90D VWAP - Quarterly rolling average
365D VWAP - Yearly rolling average
Each VWAP shows where the average price is, weighted by volume. Institutional traders often use these levels as support/resistance.
Optional Features:
Bands show volatility zones (Value Area High/Low)
Anchor modes: Reset weekly, monthly, quarterly, or yearly instead of rolling
Crypto volume aggregation from 15+ exchanges for accurate calculations
Clean, minimal design for white background charts.

ProChart NF50 1H📘 Nifty 50 – 1 Hour Options Trading Indicator (By- Dr Bean)
This indicator is designed specifically for Nifty 50 Index on the 1-hour timeframe, optimized for options trading (For Call entries based on index direction).
It automatically identifies high-probability Buy and Sell signals, using a combination of trend structure, volatility filters, and momentum logic. The goal is to capture clean directional moves with controlled risk.
🔍 What the Indicator Does
✅ 1. Generates Buy & Sell Signals
Buy signal appears when the trend flips bullish and volatility confirms the momentum.
Sell signal appears when upward momentum weakens and reversal logic triggers.
This helps option traders decide when to enter CE (Call) or Exit positions with better timing.
📈 Example of Signals on Chart
The chart shows:
Buy signals at early trend stages
Sell signals when momentum weakens
Take-Profit markers based on trailing logic
Trend structure lines to visualize the move
This makes spotting trend continuation and reversal trades extremely simple.
📊 Backtested Performance
Based on historical Nifty 50 (1-hour timeframe): (On 14/11/2025)
Total Trades: 329
Win Rate: 51.67%
Profit Factor: 1.83
Largest Win: ₹944.05
Largest Loss: –₹307.15
Average R Multiple: 0.46
Max Win Streak: 7
Max Loss Streak: 6
These stats show high reward-to-risk stability, with controlled losses and strong upside streaks.
🎯 Why This Indicator Works Well for Options
Nifty 50 moves cleanly on higher timeframes
1-hour candles reduce noise
Signals are not overly frequent
Momentum and ATR-based filters help avoid choppy markets
Easy visual signals help traders take CE decisions confidently
This indicator is ideal for:
Intraday & Swing Options Traders
Traders who prefer rule-based signals
Nifty Index direction traders
💡 Overall Purpose
This tool simplifies the process of identifying:
Trend continuation
Momentum breakouts
Profit-taking zones
Early reversals
It helps option traders take trades based on clear, objective, visual signals, instead of guesswork.
⏱️ Recommended Timeframe:
Optimized for 1-Hour Charts
💬 Note : This is a paid indicator. Access is granted upon subscription.
For inquiries, trial access, or support, please contact us directly via TradingView or our official social channels.
Market Risk Applies – All trading involves risk. Always use proper risk management and never rely solely on any single indicator for trading decisions.
Backtesting Recommended – Before live trading, test this indicator on past data and in simulated environments to understand its behavior and limitations.
Disclaimer : We and our private indicator are not registered with SEBI (India), the SEC (U.S. Securities and Exchange Commission), or any other financial regulatory authority. The information provided is purely for educational and informational purposes and does not constitute financial or investment advice. Please consult a registered financial advisor before making any investment decisions.


PLANBXPRESS PSYCHOLOGICAL LEVEL ENTRY MODELThis Indicator merges multiple professional trading concepts into one visual tool — helping traders identify momentum shifts, entry zones, and daily trading plans with volume confirmation.
It automatically detects trend direction, generates dynamic take-profit & stop-loss levels, and overlays key daily reference points such as VWAP, pivot, support, and resistance zones based on ATR and trend context.
⚙️ Main Components
1️⃣ Signal System
Detects trend bias using SMA-based logic.
Generates entry price, TP1–TP3, and SL dynamically from recent impulse ranges.
Updates signals automatically when trend bias changes or previous targets are hit.
Visual levels are drawn directly on the chart.
2️⃣ Volume Analysis
Compares current volume against a moving average (SMA).
Classifies volume as:
🟢 Strong (above 1.5× average)
🟡 Average
🔴 Weak (below 0.8× average)
Displays the current volume strength and trend bias in an on-chart table.
3️⃣ Auto Day Plan
Uses multi-timeframe ATR calculations to define:
Support / Resistance zones
Pivot & Balance areas
Daily VWAP
Auto Targets (ATR-based expansion levels)
Adapts automatically to selected base timeframe (1H, 4H, or Daily).
4️⃣ Trend Context
Dual EMA system (50 & 200) to confirm bullish/bearish structure.
Aligns expected direction with VWAP & pivot location for context-aware bias.
🎯 What You Get on Chart
📈 Automatic LONG/SHORT signals
🎯 TP1, TP2, TP3, and SL levels
📊 Volume strength meter
🧭 VWAP, pivot, support/resistance & balance zones
🎨 Clean visual layout for intraday and swing traders
🧩 Inputs
Parameter Description
lenImpulse Impulse range length
smaLen SMA length for trend bias
levelRatio SL/TP ratio multiplier
volLen Volume SMA length
baseTF Base timeframe for zones/VWAP
atrMult1 / atrMult2 ATR multipliers for target levels
fwdBars Extension range for future projection
💡 How to Use
Add the script to your chart and choose your preferred timeframe.
Observe signal direction (📈 LONG / 📉 SHORT) and TP/SL levels.
Confirm entries when:
Trend aligns with VWAP direction, and
Volume category shows Strong or Average.
Use Auto Day Plan levels (pivot, balance, VWAP) as intraday reaction zones.

Weekly Futures VWAP (Major Indices) - StableAutomatically puts the VWAP anchor on Sunday opening of futures at 16:00, you are able to toggle on/off VWAP bands and of course enter alerts

Dual TF VWAP + ATR BandsDual TF VWAP + EMA (3×3 Outer Shells)
A precision volatility framework combining institutional VWAP structure with trend-anchored EMA logic.
🔍 Overview
Dual TF VWAP + EMA is a multi-layer trend and volatility system designed for traders who want clean directional context, controlled volatility boundaries, and a reliable method to spot pivots, expansions, compressions, and exhaustion points across any timeframe.
This tool blends:
Higher-Timeframe VWAP (50-period rolling)
Local EMA Midline (configurable)
3×3 ATR Outer Shells
Directional Color Coding
Signal-Ready Interaction Zones
Unlike traditional Bollinger Bands, Keltner channels, or static envelopes, this indicator adapts dynamically with both price and volume, giving deeper insight into how institutions accumulate, distribute, or expand trends.
🎯 What It Shows
1. Higher-Timeframe VWAP Midline
A 50-period Rolling VWAP that reflects where real volume-weighted control sits.
Perfect for reading:
Institutional trend bias
Value area reclaims
High-confidence mean reversions
High-probability trend continuations
2. Local EMA Trendline (Configurable)
A flexible EMA that acts as your local “risk-on/off” trend gauge.
You can use:
12 EMA for aggression
20 EMA for balanced trending
50 EMA for slower institutional rhythm
This EMA + VWAP pairing creates a powerful trend confirmation system.
3. Outer ATR Shells (U1–U3 / L1–L3)
Three upper and three lower ATR-based shells form a volatility map showing:
U1/L1: First reaction zones
U2/L2: Overextension zones
U3/L3: Exhaustion / blow-off tops / panic bottoms
The 3×3 shells tell you instantly whether price is:
Expanding
Compressing
Overextended
Reversing
Trending cleanly
📘 How To Use It — Practical Trading Logic
1. Trend Confirmation
Bullish: Price above VWAP + EMA rising + 12 EMA above U1
Bearish: Price below VWAP + EMA falling + 12 EMA under L1
2. Reversals
U3/L3 taps signal exhaustion
EMA rejection at U1/U2 confirms fading momentum
VWAP reclaim confirms the reversal
Trend resumes once EMA crosses back above/below VWAP
3. Momentum Acceleration
When price floats above the EMA without touching it and rides between:
EMA → U1 → U2
trend acceleration is underway (trip-wire continuation signal).
4. Safe Entries
EMA reclaim
VWAP reclaim after sweep
EMA → VWAP “compression and release”
Price floating above EMA with U1 break
5. Safe Exits
U2/U3 spikes
EMA flattening
EMA cross back under VWAP
Shell compression before trend shift
---Why This Tool Works---
Traditional bands are one-dimensional:
They react to price only.
This tool uses price + volatility + volume, so it shows:
Real trend strength
Institutional control zones
High-probability reversal points
Low-risk entry pockets
It performs exceptionally well across:
SPY / QQQ
Tech momentum
Small caps
Crypto
High-beta growth names
Summary
Dual TF VWAP + EMA (3×3 Outer Shells) is built for traders who want:
Clear trend direction
Accurate expansion/reversal signals
Dynamic institutional value zones
Multi-timeframe confidence
Clean volatility boundaries
A powerful companion for confirmation systems, breakout strategies, and liquidity-based execution.

Opening Range A simple opening range indicator. Use the inputs tabs to change start/end and length of the range.

TraderDemircan Trend Based Fibonacci + XABCD FormationDescription
TraderDemircan Trend-Based Fibonacci + XABCD Formation is an original open-source indicator that combines trend-based Fibonacci projections with an automated XABC structure detection engine.
The script focuses on identifying swing high → swing low transitions in a downtrend, generating Fibonacci levels and projecting a potential C-target extension based on harmonic geometry.
This indicator is designed for traders who want a clearer visual structure of how retracement, continuation, and harmonic projections interact inside trending markets.
🧩 What the Script Does
1. Detects the Most Recent X–A Swing (Trend High → Trend Low)
The indicator automatically scans a user-defined lookback range to identify:
X: Most recent significant swing high
A: The lowest low after X within the lookback window
This creates the foundational XA leg used for both Fibonacci levels and harmonic projections.
2. Determines a Dynamic B-Point Retracement
The script measures the market’s current retracement relative to the XA leg:
If price retraces below 0.50, B becomes the 0.50 level
If price retraces above 0.50, B becomes the 0.382 level
The algorithm ensures proper harmonic logic by validating that price stays below the B-level, preventing invalid structures.
3. Projects a Harmonic C-Target
Using harmonic extension logic, the script calculates:
C = B − (X − A)
This projects a symmetrical continuation leg relative to XA, giving traders an estimated “C-completion zone."
The C-target is displayed visually and numerically in an on-chart info table.
4. Plots Full Trend-Based Fibonacci Levels
The indicator draws Fibonacci levels from 0.0 to 2.618
Users can independently enable/disable each level, adjust line styling, choose color themes, add price labels, and display retracement percentages.
🎨 Visualization & Usability
The script includes:
Clean, customizable Fibonacci layout
Optional price labels & percentage labels
Extendable line options
Highlighted XABC structure
Dashed projection lines for the C-target
A compact info table showing X, A, B, C prices
This helps traders visually track structural market progression with clarity.
📘 Conceptual Foundation
This indicator is based on:
Trend-retracement logic using classic Fibonacci ratios
Structural swing identification
Basic harmonic symmetry (XA → BC projection)
Downtrend-based continuation expectations
It does not attempt to identify full harmonic patterns (like Gartley, Bat, or Crab), but instead focuses on the trend-based XABC segment and projected continuation targets.
🔧 Inputs Overview
Key user controls include:
Lookback window for pivot detection
Individual Fibonacci level visibility toggles
Color controls & line styling
Label display options
XABC formation display toggle
C-target on/off
All parameter names in the script are English; if translations appear in inputs, their English equivalents are included here to comply with TradingView publication rules.
⚠️ Limitations & Notes
The indicator does not predict future price direction.
It does not repaint, but pivot detection naturally depends on completed bars.
The C-projection is a geometric estimate, not a trading signal.
No forward-looking or non-causal data is used.
This tool is intended for structural analysis, not automated strategy execution.
📎 How to Use It
Add the indicator to a clean chart.
Observe the most recent X → A swing.
Watch how price interacts with 0.382 / 0.5 retracement to form the B-point.
Use the projected C-target as a reference zone for potential continuation completions.
Combine with your own trend, momentum, or volume methods for confirmation.
✔ Originality
This script is fully original and not derived from any pre-existing public script.
It combines:
Automated dynamic trend-based Fibonacci framework
Custom XABC structure detection
Harmonic-style C projection logic
Fully customizable visualization system
The indicator is intended to add meaningful analytical value to the community beyond standard Fibonacci tools.
