Options Scalping V2This Indicator is Owned by Team Option Scalping.
It has 4 Plots and 2 Tables.
This indicator to be used only in BankNifty Futures
VWAP ( Volume weighted average price )
• User can input the source and enable/disable the VWAP from input section.
• When price is more than the VWAP its Bullish Trend and vice versa.
VWMA ( Volume weighted moving average )
• Default value of 20 is used in VWMA . User can enable/disable it from input section.
• When price is more than the VWMA its Bullish Trend and vice versa.
Parabolic SAR
• User can input “start”, “increment” and “maximum” values from input section and can enable/disable SAR also.
• When price is more than the Parabolic SAR its Bullish Trend and vice versa.
SuperTrend
• User can input ATR Period and ATR Multiplier values from input section. By defaults it’s 10 and 2.
• User have option of enable/disable “Change ATR calculation Method”, if enabled then ATR is calculated differently for SuperTrend.
• Enable/disable “BUY/SELL signals” on SuperTrend.
• When price is more than the SuperTrend its Bullish Trend and vice versa.
Top Right Corner TABLE ( 6 , 10 )
When you are trading in Banknifty futures , we have to check major Banks which is contributing to Banknifty move. So we have given that in this tab.
This table consist data of 9 following stocks:
• BankNifty
• Nifty
• Dow
• INDIA
• VIX
• HDFC
• ICICI
• KOTAK
• AXIS
• SBI
And following data of each stock has been provided:
• LTP
• Daily Change
• Daily Percentage Change
• 15-minute Change Percentage
• 1-Hour Change Percentage
Bottom Right Corner TABLE (3, 6 )
This table consist of 4 indicators values and Up/Down indicator:
• VWMA (When price is more than the VWMA its Bullish and vice versa)
• SuperTrend (10.2, When price is more than the SuperTrend its Bullish and vice versa.)
• RSI (14)
• VWAP (When price is more than the VWAP its Bullish and vice versa.)
BANKNIFTY

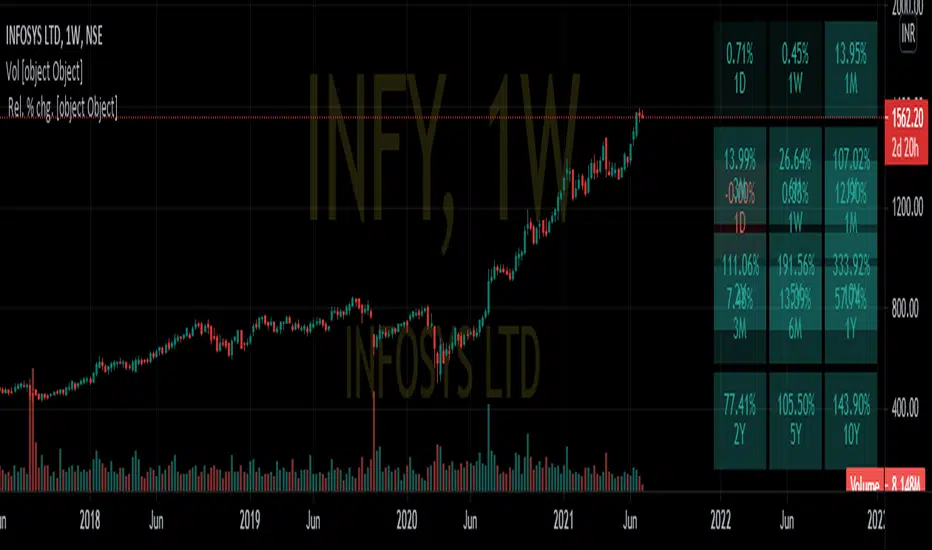
Nifty Relative PerformanceDISCRIPTION:-
This indicator is used to determine relative performance of a stock based on different time intervals as well as compared to benchmark indices as Nifty 50,Nift IT, Nifty auto etc.
USE CASE SCENARIO:-
The top right table provide performance of stock based on different interval
while the bottom table depicts its relative performance compared to an index
eg:-
INFY compared to Nifty 50
&
INFY compared to Nifty IT
DISCLAIMER:-
if using an android device kindly toggle full-screen mode and view it horizontally
In desktop full screen mode may provide better comprehensive view
BankNifty - VWAP + StdDev Bands- By Default the script draws Daily VWAP for Bank Nifty based on Futures Volume or underlying Index Stocks based on user input
- Optionally one may Anchor it to Week/Month etc or anchor it from a particular Time.
- It also draws 3 Standard Deviation Bands from the VWAP based on User Input.
- Optionally draws Previous VWAP Close for and Bullish or Bearish Move.
- It works with NIFTY 50 as well but only using Futures Volume(Pine limitation to number of security calls) . Please change the Symbol and Futures Volume symbol to "NSE:NIFTY" and "NSE:NIFTY1!" NSE:BANKNIFTY NSE:NIFTY

Bank Nifty DashboardThis shows a performance glance of Dow, India Vix and Major Constituents of Bank Nifty. Which will help to take quick decision.
Style settings
Normalized Change Mode: Allows the user to access a different interpretation of the indicator by showing the normalized first differences of each indicator in the dashboard instead of their sign
Dashboard Location: Location of the dashboard on the chart
Dashboard Size: Size of the dashboard on the chart
Text/Frame Color: Determines the color of the frame grid as well as the text color
Bullish Cell Color: Determines the color of cell associated with a rising indicator direction
Bearish Cell Color: Determines the color of cell associated with a decreasing indicator direction
Cell Transparency: Transparency of each cell
Usage
This will help to monitor the banks Performance on various time frames . You can change the stock list according to your usage/Index.
All showing in green indication strong momentum.

Trade Vertex - Bank Nifty Volume IndicatorNSE:BANKNIFTY
We all know that the value of an Bank Nifty is derived from top banking sector underlying stocks.
The value of Bank Nifty is calculated from free float market capitalization.
Using the same formula, I made an indicator on the bases of weighted volume of each stock.
This indicator will help you to plot Volume on Bank Nifty.
Wide BarsSimple scripts show the wide range bars within in the look back period, visualizing the bigger momentum.
Added four exponential moving averages which define the trend of the instrument.
Wide range candles in the direction of overall trend on higher timeframes; give confluence of higher participation in the same direction.
Note : Decent volume above the average volume with wide range candle adds more value.

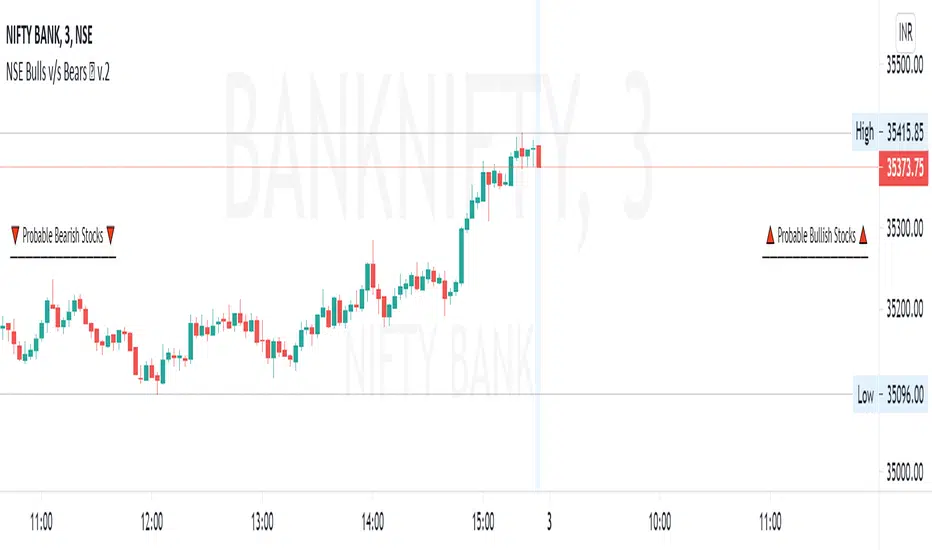
Nifty50 Bullish Bearish Scanner▪ How to use ?
The Screener has 40 stocks which are selected from NSE Nifty50 (list is given below) (cannot be editable) and after 9:15 am IST, it will scan most probable Bullish and Bearish stocks, both stocks will be labelled separately.
▪ Entry may be made at specified near the Stock name and target and SL is also mentioned nearby. Priority to be given to the stop-loss first. User can change profit percentage and Stop-loss percentage as per need, max. 10% can be done, default SL = 0.5% and Profit = 2%. Do use the indicator with other analysis, indicators, strategies, etc. Do not wait for target to hit, also use your calculations to book profit.
▪ How the figures are calculated ?
Conditions for Bullish and Bearish are calculated when trade day starts, and the default timeframe is for 1 Day (i.e.-Current Whole Day)
means the target and stop-loss are for intraday whole day, which can be changed to week, month, etc., Here Entry points are calculated depending upon the current days open price, with consecutive profit and stop-loss are calculated. The Percentage profit and stop-loss are
calculated including previous days price also, confusion to be avoided with figures.
▪ Caution :
If in morning any stock comes in any of list and if it goes from that list, that means the reversal took place for that stock(s) and stop-loss is hit. If any stock is opened Gap-Up or Gap-Down that it will come in either of the Bullish / Bearish stocks, then those stocks maybe
avoided.
▪ Which Nifty50 Stocks are included ?
Top 40 stocks from NSE Nifty50 are selected which are included are below =
ADANIPORTS, ASIANPAINT, AXISBANK, BAJAJ_AUTO, BAJFINANCE, BHARTIARTL, BPCL, BRITANNIA, CIPLA, DIVISLAB, DRREDDY,
EICHERMOT, GRASIM, HCLTECH, HDFC, HDFCBANK, HEROMOTOCO, HINDALCO, HINDUNILVR, ICICIBANK, INDUSINDBK, INFY
ITC, JSWSTEEL, KOTAKBANK, LT, M_M, MARUTI, RELIANCE, SBILIFE, SBIN, SUNPHARMA, TATACONSUM, TATAMOTORS, TATASTEEL
TCS, TECHM, TITAN, UPL, WIPRO.
▪ Indicator options :
Choice to hide bearish / bullish stocks labels, change background color of label, change text color of label, user can change position of label from the current bar, modify stop-loss and profit percentage.
▪ Alerts
You can create an alert from it easily. No additional configuration is required, message and alert on close is used the code.
The current timeframe candle is considered as alerts is set to once per bar close.
▪ Note: The initial load may be slow. If something doesn't seem to work, you can try the following:
- wait more time for it to load.
- hide & show or remove & add back to chart.
- don't add the indicator to chart multiple times in a short amount of time, as you may be rate limited
- Remember that majority of indicators fails in a sideways market, also every indicator is not 100% accurate.
▪ Disclaimer
Please remember that past performance may not be indicative of future results.
Due to various factors, including sudden changing market conditions, the indicator may not perform good.
This description and the indicator don’t provide any financial advice.
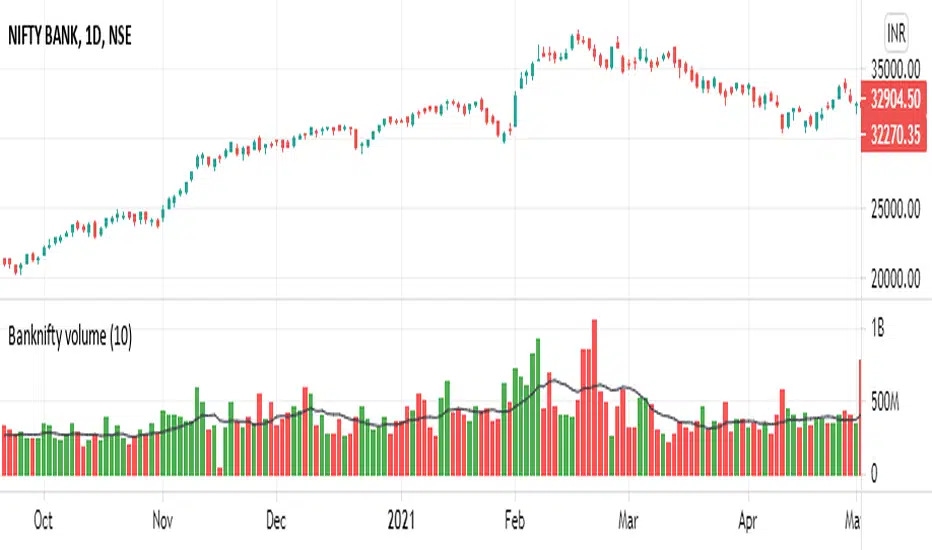
BankNifty Volume Indicator
KEY TAKEAWAYS
- Uses BankNifty Index Stocks Volume.
- BankNifty Volume Indicator is created by adding all BankNifty Stocks Volume together.
- BankNifty Volume will be an important indicator in BankNifty Index technical analysis because it is used to measure the relative significance of a market move.
- The higher the volume during a Banknifty index price move, the more significant the move and the lower the volume during a Banknifty index price move, the less significant the move.
- Moving Average is also added.
NSE:BANKNIFTY
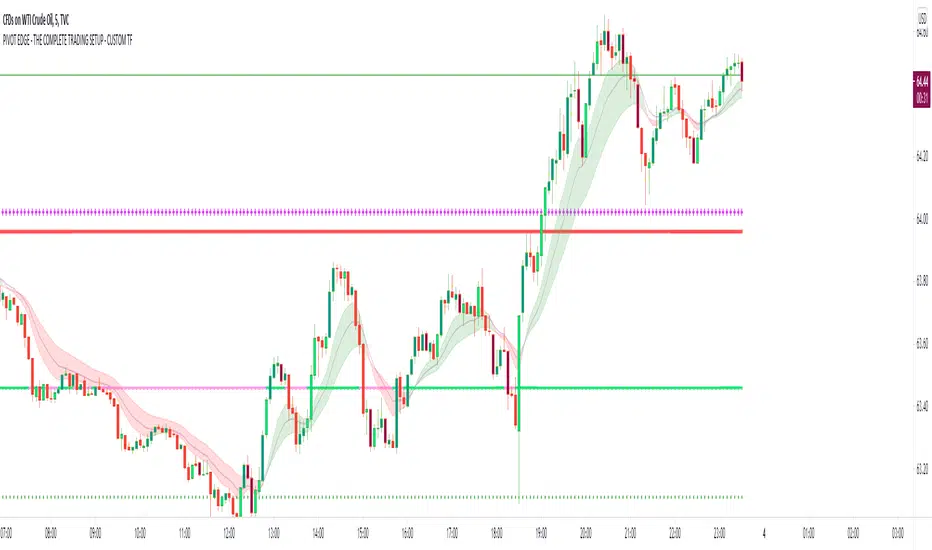
PIVOT EDGE - THE COMPLETE TRADING SETUP - CUSTOM TFIntroduction to the Indicator " PIVOT EDGE - The complete trading setup - CUSTOM TF " It means custom timeframe
The Foundation layout for this indicator is based on PIVOT's which are nothing but the most important levels that the price has respected in the past. The values for the pivots are derived from the key attributes of the price in any timeframe such as the OPEN, HIGH, LOW and CLOSE. These define the mood of the price and where it intends to move in relation to the previous range formed. Earlier HIGH - LOW i.e the RANGE indicates the possible movement that a stock can make in the current session and as per the calculated pivots we can possible find out the tentative supports and resistances. In addition to this indicator, It is advisable to use the price action theory which helps in taking a right decision for entries.
This indicator by itself is complete in nature, i.e it guides the user for possible entry levels and the projected targets that we can achieve and also the likely stop loss limit in case the price reverses. So beforehand even before entering into a trade position, the user can ascertain what can be his loss or max profit and then he can chose an optimum position size for favorable results.
The beauty of this Indicator lies in the fact that it can be used for all types of trading like Scalping, Intra day, Swing or Positional and Investments also. It works on all timeframes and across all market segments like EQUITY, COMMODITIES , FUTURES , OPTIONS , FOREX etc.
This indicator can be used for any exchange and any time zone also without any changes or adjustments needed.
Now let us understand the features of this Indicator in detail.
TIMEFRAME - It has options to choose between Day, week and month as timeframe. By default it is set to Day timeframe
DISPLAY MAJOR LEVELS - These are the important support and resistance levels calculated based on the past price data. Most important ones are marked in BOLD RED and BOLD GREEN between which the price tends to move generally.
Apart from these, We have breakout level marked in light green and if price breaks this level we can expect targets upto extended levels and beyond marked in blue.
we also have breakdown level marked in light red and if price breaks this level we can expect targets down up to extended levels and below it marked in blue.
In addition I have coded intermediate target levels that appear in light gray between the extended levels or blue lines. Sometimes when the gap between these targets are huge, price cannot reach the targets and reverses at these intermediate targets. You can use them as targets or trailing stop loss based on your plan
DISPLAY HIDDEN LEVELS - These levels are intermediate supports and resistances that can be used whenever the present day indicated range is very wide. Whenever we have an explosive moments in market the range of that day is very huge and so he next day support and resistance band becomes very wide indicating the sideways movement day within that range. And on those days we can switch on the hidden levels and the price respects these levels and most of the days it is inside this range only.
DISPLAY PREVIOUS HIGH / LOW / CLOSE - I have included Daily / Weekly and monthly levels. It is important to know the earlier highs / lows and close since price respects it very must just like support and resistance .
PEMA - This is an important EMA based indicator which potentially indicates curves of support and resistance during retracements or pullbacks. If the curves are breached then the trend is reversed and the price will tend to move to the next pivots .
IMPORTANT NOTE : This indicator does not guarantee any favorable results nor protect your from any loss. You own the complete risk of your trades. It is suggested that you use this indicator and do back testing for considerable period to understand how it works the the potential win rate it can give. If you have any doubts or need any clarifications of assistance in understanding, you can message me and I will try to help.
Happy and Safe trading - Mohan from PIVOT EDGE
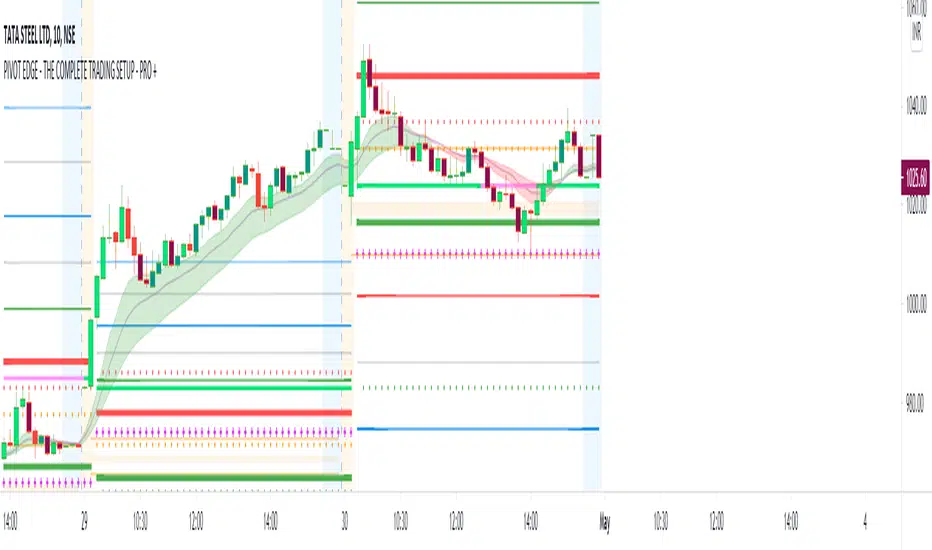
PIVOT EDGE - THE COMPLETE TRADING SETUP - PRO +Introduction to the Indicator " PIVOT EDGE - The complete trading setup - PRO+ "
The Foundation layout for this indicator is based on PIVOT's which are nothing but the most important levels that the price has respected in the past.The values for the pivots are derived from the key attributes of the price in any timeframe such as the OPEN, HIGH, LOW and CLOSE. These define the mood of the price and where it intends to move in relation to the previous range formed.Earlier HIGH - LOW i.e the RANGE indicates the possible movement that a stock can make in the current session and as per the calculated pivots we can possible find out the tentative supports and resistances. In addition to this indicator, It is advisable to use the price action theory which helps in taking a right decision for entries.
This indicator by itself is complete in nature, i.e it guides the user for possible entry levels and the projected targets that we can achieve and also the likely stop loss limit in case the price reverses. So beforehand even before entering into a trade position, the user can ascertain what can be his loss or max profit and then he can chose an optimum position size for favorable results.
The beauty of this Indicator lies in the fact that it can be used for all types of trading like Scalping, Intra day, Swing or Positional and Investments also. It works on all timeframes and across all market segments like EQUITY, COMMODITIES , FUTURES , OPTIONS , FOREX etc.
This indicator can be used for any exchange and any time zone also without any changes or adjustments needed.
Now let us understand the features of this Indicator in detail.
TIMEFRAME - It has options to choose between Day, week and month as timeframe. By default it is set to Day timeframe
DISPLAY MAJOR LEVELS - These are the important support and resistance levels calculated based on the past price data. Most important ones are marked in BOLD RED and BOLD GREEN between which the price tends to move generally.
Apart from these, We have breakout level marked in light green and if price breaks this level we can expect targets upto extended levels and beyond marked in blue.
we also have breakdown level marked in light red and if price breaks this level we can expect targets down up to extended levels and below it marked in blue.
In addition I have coded intermediate target levels that appear in light gray between the extended levels or blue lines. Sometimes when the gap between these targets are huge, price cannot reach the targets and reverses at these intermediate targets. You can use them as targets or trailing stop loss based on your plan
DISPLAY HIDDEN LEVELS - These levels are intermediate supports and resistances that can be used whenever the present day indicated range is very wide. Whenever we have an explosive moments in market the range of that day is very huge and so he next day support and resistance band becomes very wide indicating the sideways movement day within that range. And on those days we can switch on the hidden levels and the price respects these levels and most of the days it is inside this range only.
DISPLAY PREVIOUS HIGH / LOW / CLOSE - I have included Daily / Weekly and monthly levels. It is important to know the earlier highs / lows and close since price respects it very must just like support and resistance .
PEMA - This is an important EMA based indicator which potentially indicates curves of support and resistance during retracements or pullbacks. If the curves are breached then the trend is reversed and the price will tend to move to the next pivots .
VALUE AREA - One of the most important feature of this Indicator is this which is derived from the Volume profile concepts. It indicates the fair value area Indicated by orange band and the upper and lower limits indicated by orange lines. Whenever the price is overvalued or undervalued, it is pushed back to its fair value and we can judge the present price position in relation to the value area and then take position in anticipation of the price reaching its fair value area. This must be coupled with price action for favorable results.
IMPORTANT NOTE : This indicator does not guarantee any favorable results nor protect your from any loss. You own the complete risk of your trades. It is suggested that you use this indicator and do back testing for considerable period to understand how it works the the potential win rate it can give.
If you have any doubts or need any clarifications of assistance in understanding, you can message me and I will try to help.
Happy and Safe trading - Mohan from PIVOT EDGE
RR 2
Software signal with Trend of the market/Central Pivot Range combined with RR1 for better results.

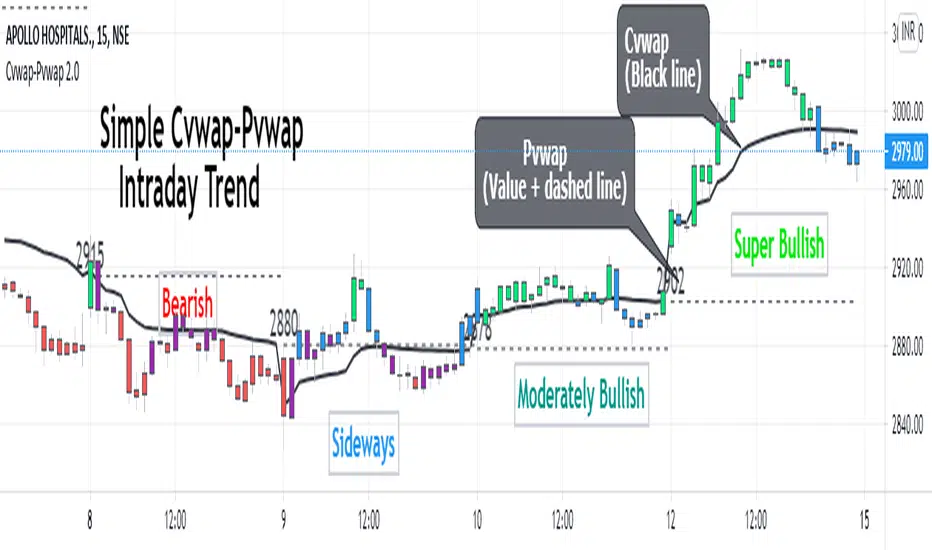
Cvwap-Pvwap 2.0A simple vwap based Intraday trend indicator.
Volume-Weighted Average Price (VWAP) - the average price weighted by volume, starts when trading opens and ends when it closes. This can help institutions buy or sell in large orders, without disturbing the market.
After buying or selling, institutions compare instrument price to closing VWAP values at end of the day.
For big financial institutions;
A buy order executed below the VWAP value, considered a good fill because the security was bought at a below average price.
A sell order executed above the VWAP would be deemed a good fill because it was sold at an above average price.
Simple price based moving average is not helpful for them; = as it doesn't incorporates volume traded. Hence - VWAP :)
So how it helps us in decoding the IntraDay-trend? - Through a 2 day vwap co-relation.
So, Closing value of previous day vwap = Pvwap
Today's running vwap = Cvwap
Defining the IntraDay Trend:
Moderately Bullish = candle closing price above Pvwap but below Cvwap
Super Bullish = Closing price is above both (Cvwap and Pvwap)
Moderately Bearish = Closing price is above Cvwap but below Pvwap
Super Bearish = Closing Price is below both (Cvwap and Pvwap)
A big gap between the Cvwap and the candle closing price defines the strong participation from institutions in that direction. (Strong Trend)
Moving with the smart money, in the overall trend is a wise decision for any intraday trader and this helps at its best.
PpSignal Impulse V1.20PpSignal impulse is based on the concept of relative strength index, Rsi its acronym in English.
Although the calculation is similar, it differs in how the force is calculated. To calculate the force we are based on the analysis of the trend through a WMA.
It is important to clarify that you must do a prior analysis of the asset that you are going to trade, such as resistance supports, channels, chart formations, etc.
Buy when the sign is white.
Sell when the signal is red.
You can also perform buy or sell boosts if you activate impulse 2 and 3.

MAST TrendHello Traders !!
This is a simple super trend based MAST trend.
By default the supertrend is 10 period with 3 ATR multiplier.
A moving average is used to benefit from the pullback entries.
Bullish Pullback : Price above Supertrend & below MA
Bullish: Price above Supertrend and above MA
Bearish pullback : Price below Supertrend & above MA
Bearish : Price below Supertrend & below MA
Refer to investopedia or any relevant articles for in detail about Supertrend.

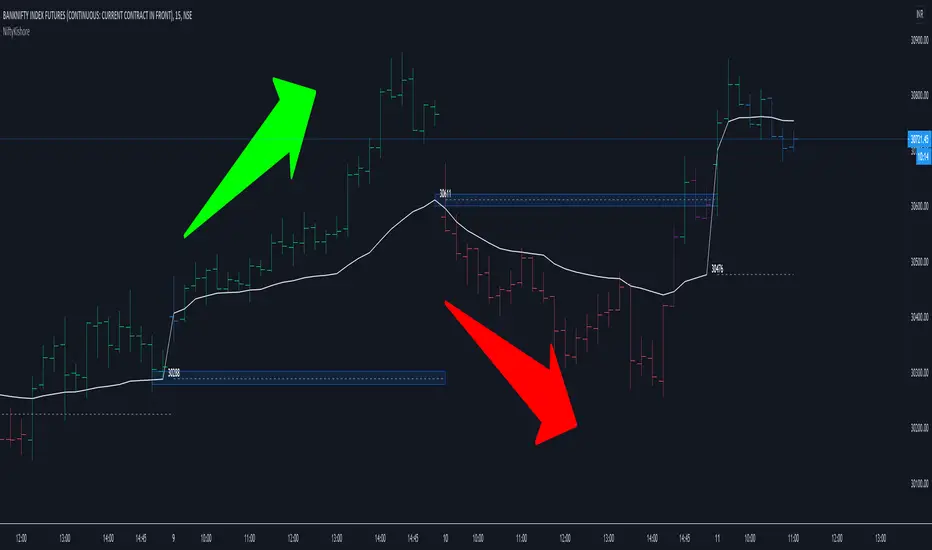
Vwap Pvwap Intraday Trend - NiftyKishoreHello Traders !!
This is a simple trend identification script which is based on the current vwap (Cvwap) and previous vwap (Pvwap).
Pvwap in the sense; previous day vwap closing value.
Bullish: price is closing above the current day vwap and previous day vwap(pvwap).
Bearish : Price is closing below the current day vwap and previous day vwap (pvwap).
Made a change to the barcolors as well :)
Bullish
Green Bar: close is above Pvwap and Cvwap.
Blue bar: close is above Pvwap but below Cwap.
Bearish
Red bar: close is below Pvwap and Cvwap.
Purple bar: close is below Pvwap but above Cvwap.
Simple but effective
Cheers !!
PpSignal Momentum TraderThis is a combination of the PERCENTAGE of PRICE OSCILLATOR (PPO) and Momentum.
When both oscillators are up in the same direction it is buying (green bottom and green oscillators), when both oscillators are down it is sell (red bottom and red oscillators. When they do not agree (silver bottom) it is to keep doing nothing .
You can also see the change in trend with the candles as well. same colors as the background and the oscillators.

pSignal CFB and Slope Trend Folow This indicator shows the trend of an asset (nifty, crypto, forex, stock, etc., taking as a starting point the volatility and direction of the market.
When the moving average slope crosses up CFB (see CFB explanation below) it is BUY.
When the Moving Average Slope crosses CFB down it is sell.
The system also has a support and resistance (daily, weekly, or mouth) identifier.
The alarm of resistance or support signal: When price close and volume break daily support or resistance the general system is a visual signal.
Bull Wick= the high price broke the resistance.
Bear wick = the low price broke the support.
Break Out color blue color = the close price and the volume broke the resistance.
Break Out color maroon color = the close price and the volume broke the support.
The system also has the Bollinger bands that show us the volatility of the market and when it is up or down. Read more about the use of the Bollinger band
CFB
his indicator was designed to filter out lower price actions for a clearer view of trends. Inspired by QQE's volatility filter, this filter applies the process directly to price rather than a smoothed RSI . Range Filter and bands are now calculated in a singular function. There are now two different calculation methods for the filter. Select the type you want to use through the "Filter type" entry. Type 1 is the original formula. Multiple range size methods are now available.
You can choose between the following scales:
- Points
- Pips (Works best with currency pairs, obviously)
- Ticks -% of the price - ATR - Average change (default. This is the original sizing method). - Standard Deviation
- Absolute (absolute numerical value)
- Smoothing with the range elder is now optional, and you can specify its smoothing length.
Smoothing only affects dynamic scales (ATR, average change, and standard deviation).
- Filter movement can now be determined using highlights or closing price. This can be specified through the input.

PpSIgnal Quantile Band 4.0Quantile band: In statistics and the theory of probability, quantiles are cutpoints dividing the range of a probability distribution into contiguous intervals with equal probabilities, or dividing the observations in a sample in the same way.
Quantitative Qualitative Estimation is based on a rather complex calculation of the smoothed RSI indicators.
The QQE indicator consists of a smoothed Relative Strength Index ( RSI ) indicator and two volatility-based trailing levels (fast and slow). The Fast Trailing Level (TL) and Slow TL are constructed by calculating the ATR of the smoothed RSI over n-periods and then further smoothing the ATR using an additional n-periods Wilders smoothing function. This smoothed ATR of RSI is then multiplied by the Fast and Slow ATR Multipliers to calculate the final Fast and Slow Trailing Levels.
Buy when the Quantile band is green.
Sell when the Quantile band is red.
when the quantile band is gray hold

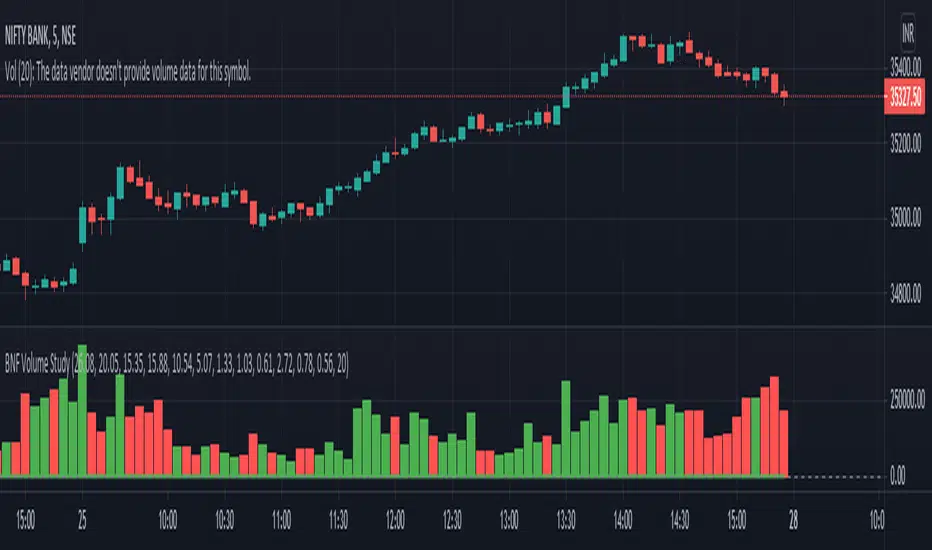
BANKNIFTY Auto-Trading Indicator based on Market InternalsNSE:BANKNIFTY
Dear Fellow Traders,
This indicator for BankNifty INTRADAY trading is based on Market Internals - Advance/Decline Volume and TICK
These Market Internals, also known as Breadth Tools helps in identifying the overall market sentiment.
Just doing some technical analysis on Price action doesn't provide good results.
Price action along with Volume gives a meaningful insight and helps in improving the accuracy.
But simple VOLUME information is not sufficient to take a directional view on the markets. A segmentation of POSITIVE and NEGATIVE volume gives a clear picture of the symbol movement.
We can get the volume information FOR ANY STOCKS anywhere. But, VOLUME INFORMATION FOR AN INDEX ALONG WITH POSITIVE AND NEGATIVE VOLUMES are not available in normal trading platforms. And this tool provides the exact feature.
In a nutshell,
1) THIS TOOL PROVIDES BUY/SELL INDICATIONS on the BANKNIFTY based on the underlying stocks' PRICE AND VOLUME
2) THE VOLUME INFORMATION IS BIFURCATED INTO POSITIVE AND NEGATIVE VOLUME , WHICH HELPS IN DECIDING THE MARKET DIRECTION.
P.S: This is an Invite-only indicator. Inbox me for getting access.

Bank Nifty VWAPBANK NIFTY INDICES IS WIEGHTAGE OF 12 STOCKS AS DECIDED BY EXCHANGE.
BANK NIFTY VWAP CALCULATES COMBINED VWAP OF THESE 12 STOCKS AND GENERATES VWAP FOR BANK NIFTY

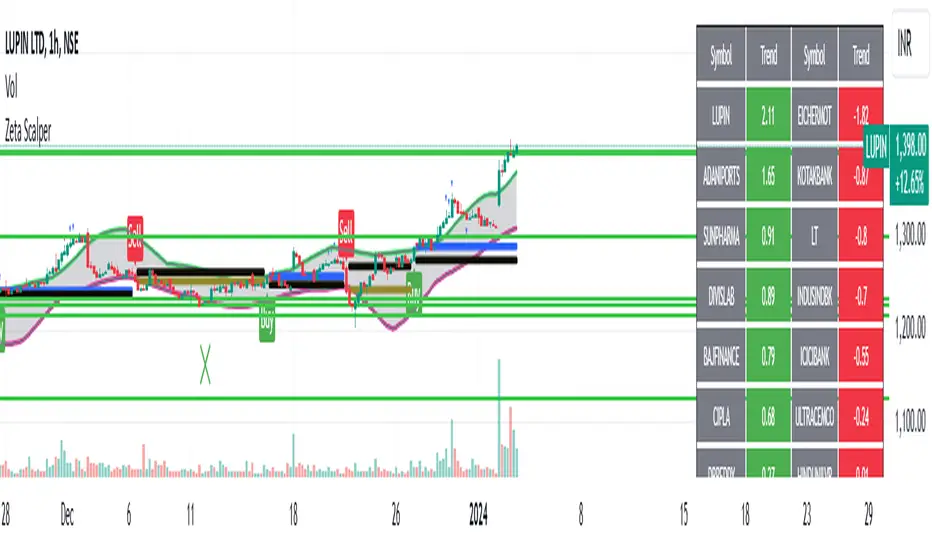
Zeta ScalperWhat is Scalping?
Scalping is a trading strategy aimed at profiting from quick momentum in a volatile index or stock.
Traders who use such strategies place anywhere from 10 to a few hundred trades in a single day.
The idea behind such type of trading is that small moves in an index or stock price are much easier to capture than the larger moves.
Traders who use such strategies are known as scalpers. When you take many small profits a number of times, say 10 points scalped 20 times per day, they can easily add up to large gains.
An Option Buyer's Biggest Enemy is Time Decay and when you scalp, you do not allow the time decay to eat your Option Premium as your Entry and Exit is often quick enough.
What is Zeta Scalper?
Zeta Scalper indicator is a momentum based indicator which tries to detect momentum based upon a number of Candle Stick Patterns.
When it thinks a move has the potential to turn into a big move, it generated its Buy/Sell Signals.
It is a well known fact that actual drivers of the market are Big Institutions, Mutual Funds & Big Guys with deep pockets.
They have large amounts of money to invest and they buy & sell in bulk.
When they buy, often their objective is to buy at lower levels (below average price of the day) & when they sell they sell at higher levels (above average price of the day).
Zeta Scalper seeks to detect this activity. When aggressive buying or selling starts where Buying & Selling Forces become unequal, the Price starts moving in one direction with candles making Higher Highs or Lower Lows.
Zeta Scalper detects these Higher Highs or Lower Lows and generates Buy or Sell signals when this happens.
In order to use this indicator, simply deploy this on your chart, and wait for Buy/Sell signals.
It works on all time frames including 1 min. 3min. 5min. & 10min. etc.
When a Buy Signal is followed by Sell signal (let it be after 3 - 4 candles or after many candles) or vice-versa, you have to switch your position to make most of the reverse move.
It is a general purpose indicator and may be used on stocks, commodities and currencies alike and is not meant for any specific market.
How to Take Buy/Sell Entry with Zeta Scalper?
Whenever you see a Buy Signal, mark its closing price with a horizontal line and as soon as a candle breaks this candle's High, it is time for you to take Entry.
Your STOP LOSS could be just 0.5% below your Entry Price, hence, no big loss even if things go wrong.
Keep moving your STOP LOSS up as the price moves in your favour and when market turns around and you see a SELL signal, it is time to book your BUY position profit and take Entry on SELL Side now and so on.
How to get this indicator?
This is invite-only indicator. Get in touch with us using information given below in Signature field to try this tool FREE.
BANKNIFTY - Anchored VWAP
An attempt to make Anchored VWAP for NSE:BANKNIFTY from Volume of underlying securities.
Notes :
- To cross check one may verify by changing Symbol to any stock and use in-built VWAP indicator
- Works only with BANKNIFTY and stocks. Does not work with other NSE Indices
