Day and DateA simple indicator that show day and date at the start of each day. This is usefull in case you are downloading charts or get confused when studying past charts for expiry and non expiry day actions.
BANKNIFTY

NSE/BSE Derivative - Next Expiry Date With HolidaysNSE & BSE Expiry Tracker with Holiday Adjustments
This Pine Script is a TradingView indicator that helps traders monitor upcoming expiry dates for major Indian derivative contracts. It dynamically adjusts these expiry dates based on weekends and holidays, and highlights any expiry that falls on the current day.
⸻
Key Features
1. Tracks Expiry Dates for Major Contracts
The script calculates and displays the next expiry dates for the following instruments:
• NIFTY (weekly expiry every Thursday)
• BANKNIFTY, FINNIFTY, MIDCPNIFTY, NIFTYNXT50 (monthly expiry on the last Thursday of the month)
• SENSEX (weekly expiry every Tuesday)
• BANKEX and SENSEX 50 (monthly expiry on the last Tuesday of the month)
• Stocks in the F&O segment (monthly expiry on the last Thursday)
2. Holiday Awareness
Users can input a list of holiday dates in the format YYYY-MM-DD,YYYY-MM-DD,.... If any calculated expiry falls on one of these holidays or a weekend, the script automatically adjusts the expiry to the previous working day (Monday to Friday).
3. Customization Options
The user can:
• Choose the position of the expiry table on the chart (e.g. top right, bottom left).
• Select the font size for the expiry table.
• Enable or disable the table entirely (if implemented as an input toggle).
4. Visual Expiry Highlighting
If today is an expiry day for any instrument, the script highlights that instrument in the display. This makes it easy to spot significant expiry days, which are often associated with increased volatility and trading volume.
⸻
How It Works
• The script calculates the next expiry for each index using built-in date/time functions.
• For weekly expiries, it finds the next occurrence of the designated weekday.
• For monthly expiries, it finds the last Thursday or Tuesday of the month.
• Each expiry date is passed through a check to adjust for holidays or weekends.
• If today matches the adjusted expiry date, that row is visually emphasized.
⸻
Use Case
This script is ideal for traders who want a quick glance at which instruments are expiring soon — especially those managing options, futures, or expiry-based strategies.
Reversal Strength Meter – Adib NooraniThe Reversal Strength Meter is an oscillator designed to identify potential reversal zones based on supply and demand dynamics. It uses smoothed stochastic logic to reduce noise and highlight areas where momentum may be weakening, signaling possible market turning points.
🔹 Smooth, noise-reduced stochastic oscillator
🔹 Custom zones to highlight potential supply and demand imbalances
🔹 Non-repainting, compatible across all timeframes and assets
🔹 Visual-only tool — intended to support discretionary trading decisions
This oscillator assists scalpers and intraday traders in tracking subtle shifts in momentum, helping them identify when a market may be preparing to reverse — always keeping in mind that trading is based on probabilities, not certainties.
📘 How to Use the Indicator Efficiently
For Reversal Trading:
Buy Setup
– When the blue line dips below the 20 level, wait for it to re-enter above 20.
– Look for reversal candlestick patterns (e.g., bullish engulfing, hammer, or morning star).
– Enter above the pattern’s high, with a stop loss below its low.
Sell Setup
– When the blue line rises above the 80 level, wait for it to re-enter below 80.
– Look for bearish candlestick patterns (e.g., bearish engulfing, inverted hammer, or evening star).
– Enter below the pattern’s low, with a stop loss above its high.
🛡 Risk Management Guidelines
Risk only 0.5% of your capital per trade
Book 50% profits at a 1:1 risk-reward ratio
Trail the remaining 50% using price action or other supporting indicators

Reversal Scalping Ribbon - Adib NooraniThe Reversal Scalping Ribbon is a trend-following overlay tool designed to visually identify potential reversal zones based on price extremes and dynamic volatility bands. It calculates adaptive upper and lower bands using price action and custom ATR logic, helping traders quickly assess market direction and possible turning points
🔹 Volatility-adjusted bands based on price highs/lows
🔹 Color-coded ribbons to indicate trend bias and potential reversal shifts
🔹 No repainting, works on all timeframes and assets
🔹 Visual-only display, no trade signals — supports discretion-based entries
This ribbon is designed for scalpers and intraday traders to spot reversal setups with clarity. It enhances your trading by showing real-time market bias without unnecessary distractions. By focusing on probabilities, it helps to improve decision-making in fast-paced environments
How to use the indicator efficiently
For Reversal Trading:
Buy: When price closes below the green ribbon with a red candle, then re-enters with a green candle. Enter above the high of the green candle with a stop loss below the lowest low of the recent green/red candles
Sell: When price closes above the red ribbon with a green candle, then re-enters with a red candle. Enter below the low of the red candle with a stop loss above the highest high of the recent red/green candles
Risk Management:
Limit risk to 0.5% of your capital per trade
Take 50% profit at a 1:1 risk-reward ratio
For the remaining 50%, trail using the lower edge of the green band for buys and the upper edge of the red band for sells

JJ Highlight Time Ranges with First 5 Minutes and LabelsTo effectively use this Pine Script as a day trader , here’s how the various elements can help you manage trades, track time sessions, and monitor price movements:
Key Components for a Day Trader:
1. First 5-Minute Highlight:
- Purpose: Day traders often rely on the first 5 minutes of the trading session to gauge market sentiment, watch for opening price gaps, or plan entries. This script draws a horizontal line at the high or low of the first 5 minutes, which can act as a key level for the rest of the day.
- How to Use: If the price breaks above or below the first 5-minute line, it can signal momentum. You might enter a long position if the price breaks above the first 5-minute high or a short if it breaks below the first 5-minute low.
2. Session Time Highlights:
- Morning Session (9:15–10:30 AM): The market often shows its strongest price action during the first hour of trading. This session is highlighted in yellow. You can use this highlight to focus on the most volatile period, as this is when large institutional moves tend to occur.
- Afternoon Session (12:30–2:55 PM): The blue highlight helps you track the mid-afternoon session, where liquidity may decrease, and price action can sometimes be choppier. Day traders should be more cautious during this period.
- How to Use: By highlighting these key times, you can:
- Focus on key breakouts during the morning session.
- Be more conservative in your trades during the afternoon, as market volatility may drop.
3. Dynamic Labels:
- Top/Bottom Positioning: The script places labels dynamically based on the selected position (Top or Bottom). This allows you to quickly glance at the session's start and identify where you are in terms of time.
- How to Use: Use these labels to remind yourself when major time segments (morning or afternoon) begin. You can adjust your trading strategy depending on the session, e.g., being more aggressive in the morning and more cautious in the afternoon.
Trading Strategy Suggestions:
1. Momentum Trades:
- After the first 5 minutes, use the high/low of that period to set up breakout trades.
- Long Entry: If the price breaks the high of the first 5 minutes (especially if there's a strong trend).
- Short Entry: If the price breaks the low of the first 5 minutes, signaling a potential downtrend.
2. Session-Based Strategy:
- Morning Session (9:15–10:30 AM):
- Look for strong breakout patterns such as support/resistance levels, moving average crossovers, or candlestick patterns (like engulfing candles or pin bars).
- This is a high liquidity period, making it ideal for executing quick trades.
- Afternoon Session (12:30–2:55 PM):
- The market tends to consolidate or show less volatility. Scalping and mean-reversion strategies work better here.
- Avoid chasing big moves unless you see a clear breakout in either direction.
3. Support and Resistance:
- The first 5-minute high/low often acts as a key support or resistance level for the rest of the day. If the price holds above or below this level, it’s an indication of trend continuation.
4. Breakout Confirmation:
- Look for breakouts from the highlighted session time ranges (e.g., 9:15 AM–10:30 AM or 12:30 PM–2:55 PM).
- If a breakout happens during a key time window, combine that with other technical indicators like volume spikes , RSI , or MACD for confirmation.
---
Example Day Trader Usage:
1. First 5 Minutes Strategy: After the market opens at 9:15 AM, watch the price action for the first 5 minutes. The high and low of these 5 minutes are critical levels. If the price breaks above the high of the first 5 minutes, it might indicate a strong bullish trend for the day. Conversely, breaking below the low may suggest bearish movement.
2. Morning Session: After the first 5 minutes, focus on the **9:15 AM–10:30 AM** window. During this time, look for breakout setups at key support/resistance levels, especially when paired with high volume or momentum indicators. This is when many institutions make large trades, so price action tends to be more volatile and predictable.
3. Afternoon Session: From 12:30 PM–2:55 PM, the market might experience lower volatility, making it ideal for scalping or range-bound strategies. You could look for reversals or fading strategies if the market becomes too quiet.
Conclusion:
As a day trader, you can use this script to:
- Track and react to key price levels during the first 5 minutes.
- Focus on high volatility in the morning session (9:15–10:30 AM) and **be cautious** during the afternoon.
- Use session-based timing to adjust your strategies based on the time of day.

Stock_Cloud-EMA,VWAP,ST Indicator_V1Stock_Cloud V1 - EMA, VWAP, SuperTrend Strategy Indicator
This indicator combines three powerful technical indicators (EMA, VWAP, and SuperTrend) to create a comprehensive trading system that helps identify high-probability trading setups when all components align.
Strategy Components & Logic:
• EMA (Exponential Moving Average): Acts as a dynamic support/resistance and trend direction indicator
• VWAP (Volume Weighted Average Price): Provides important institutional price levels and volume-based trend strength
• SuperTrend: Offers trend direction and potential reversal points
Why These Components Work Together:
1. EMA filters out market noise while maintaining responsiveness to price changes
2. VWAP adds volume-based price validation, especially useful for intraday trading
3. SuperTrend confirms trend direction and potential reversal points
4. When all three indicators align, it creates a high-probability setup
Signal Generation:
• Bullish Signal: Generated when price crosses above all three indicators (EMA, VWAP, and SuperTrend turns bullish)
• Bearish Signal: Generated when price crosses below all three indicators (EMA, VWAP, and SuperTrend turns bearish)
• Background color changes help visualize the current market condition
Settings:
- EMA Length: 20 (default, adjustable)
- SuperTrend Period: 10 (default, adjustable)
- SuperTrend Multiplier: 3.0 (default, adjustable)
How to Use:
1. Look for potential entries when all three indicators align
2. Small triangles mark key entry points when alignment occurs
3. Use background color as additional confirmation
4. Monitor price action relative to all three indicators for exit signals
Best Timeframes:
Works well on all timeframes, but particularly effective on 5-minute to daily charts for stocks and indices.
Note: This indicator combines traditional technical analysis tools in a unique way to provide clear, actionable signals. Always use proper risk management and consider other factors like market conditions and support/resistance levels.
Created by Stock_Cloud
Version 2.0

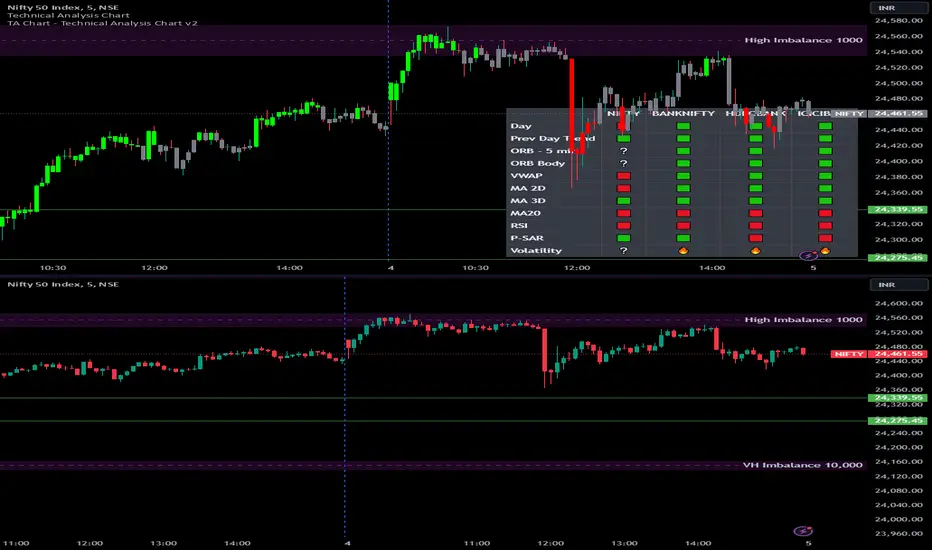
Options Series - Technical Analysis Chart➤ Simple Technical Chart Only:
➤ With MA-20 Overlay and Volatility background bars:
➤ With RSI Candles:
⭐ Overview and How It Works:
This script provides a multi-asset analysis tool to assess various market conditions across four symbols simultaneously. It combines several indicators such as daily price change, Moving Averages (MA), Bollinger Bands (BB), Parabolic SAR, RSI, and VWAP to generate buy/sell signals and trend indicators. Its strength lies in the layered use of indicators to enhance signal reliability, making it valuable for traders needing cross-validation in decision-making.
⭐ Key Features and Functionality:
The script evaluates each symbol's price against various indicators and conditions:
Daily Price Conditions: It checks if each symbol’s close price is above or below the previous day’s open, close, and intra-day ranges, forming a foundational bullish/bearish condition.
Range Breakout 1st 5min Candle (ORB): Opening Range Breakout levels are calculated and compared with current close prices, detecting breakout/breakdown conditions.
ORB Body: This basically calculates the previous day Daily candle body size, if todays Daily candle body size is greater than previous day, then we can say that we are having good momentum else its likely to be in-sidebar trading.
Moving Averages (MA): It leverages EMA-20, 2-day, and 3-day exponential moving averages to gauge short to medium-term trends.
RSI and VWAP: Relative Strength Index (RSI) determines overbought or oversold conditions, while VWAP compares prices to volume-weighted levels.
Bollinger Bands and Trend Analysis: Detects volatility and potential breakout conditions.
Concept of ORB Body:
Current_PrevDay_Body = (math.max(var_Current_PrevD_Open, var_Current_PrevD_Close) - math.min(var_Current_PrevD_Open, var_Current_PrevD_Close))
Current_Upper_ORB = var_Current_D_Open + Current_PrevDay_Body
Current_Lower_ORB = var_Current_D_Open - Current_PrevDay_Body
Current_TodayDay_Body = math.max(var_Current_D_Open, var_Current_Close) - math.min(var_Current_D_Open, var_Current_Close)
Current_ORBBody = Current_TodayDay_Body > Current_PrevDay_Body
Current_Upper_ORB_bull = (var_Current_Close > Current_Upper_ORB)
Current_Lower_ORB_bear = (var_Current_Close < Current_Lower_ORB)
🎨 Visualizations and User Experience:
The script can dynamically display colored backgrounds indicating trends when conditions are met. For example, the bgcolor function changes the background when certain trend-based criteria are satisfied, offering visual cues to users. Additionally, the checkbox input toggles trend bar visualizations, enhancing user experience by providing a quick visual reference without needing to interpret individual data points manually.
RSI-Based Candle Coloring:
➤ The script customizes candle colors based on RSI thresholds, specifically defining upper (60) and lower (40) RSI levels. When the RSI value exceeds the upper threshold, candles are colored as bullish (green), and if it falls below the lower threshold, candles are colored as bearish (red). Neutral RSI values result in a default color (gray).
➤ This setup offers a visually intuitive way to identify potential trend directions based on RSI levels, making it ideal for traders looking to gauge momentum visually.
⭐ Settings and Customization:
With multiple user-configurable inputs, the script allows for tailored analysis. Customizable parameters, such as enabling/disabling trend bars and setting various look-back periods for indicators like Bollinger Bands and Moving Averages, make it adaptable to various trading styles and preferences. It also allows users to modify visual elements like colors and styles, improving flexibility.
⭐ Uniqueness of the Concept:
The unique aspect of this script is its multi-symbol approach combined with complex conditions. By comparing not only one but four symbols simultaneously, it provides a broader market view and allows traders to correlate signals across different assets, offering a potential edge for diversified or comparative strategies. Additionally, the incorporation of ORB and multi-timeframe MAs gives it a robustness often lacking in simpler single-symbol scripts.
🚀 Conclusion:
This script is a powerful multi-indicator tool suited for traders looking for a comparative, multi-symbol analysis. With features like ORB, Bollinger Band-based trend detection, and MA cross-verification, it can assist traders in identifying and validating trend signals across assets. The user-friendly visualizations and customizable settings further enhance its usability, making it versatile for various trading strategies and preferences.
Relative volume zone + Smart Order Flow Dynamic S/ROverview:
The Relative Volume Zone + Smart Order Flow with Dynamic S/R indicator is designed to help traders identify key trading opportunities by combining multiple technical components. This script integrates relative volume analysis, order flow detection, VWAP, RSI filtering, and dynamic support and resistance levels to offer a comprehensive view of the market conditions. It is particularly effective on shorter timeframes (M5, M15), making it suitable for scalping and day trading strategies.
Key Components:
1. Relative Volume Zones:
• The script calculates the relative volume by comparing the current volume with the average volume over a defined lookback period (volLookback). When the relative volume exceeds a specified multiplier (volMultiplier), it indicates a high volume zone, signaling potential accumulation or distribution areas.
• Purpose: Identifies high-volume trading zones that may act as significant support or resistance, indicating possible entry or exit points.
2. Smart Order Flow Analysis:
• The indicator uses Volume Delta (the difference between buying and selling volume) and a Cumulative Delta to detect order imbalances in the market.
• Order Imbalance is identified using a moving average of the Volume Delta (orderImbalance), which helps highlight hidden buying or selling pressure.
• Purpose: Reveals market sentiment by showing whether buyers or sellers dominate the market, aiding in the identification of trend reversals or continuations.
3. VWAP (Volume Weighted Average Price):
• VWAP is calculated over a default daily length (vwapLength) to show the average price a security has traded at throughout the day, based on both volume and price.
• Purpose: Provides insight into the fair value of the asset, indicating whether the market is in an accumulation or distribution phase.
4. RSI (Relative Strength Index) Filter:
• RSI is used to filter buy and sell signals, preventing trades in overbought or oversold conditions. It is calculated using a specified period (rsiPeriod).
• Purpose: Reduces false signals and improves trade accuracy by only allowing trades when RSI conditions align with volume and order flow signals.
5. Dynamic Support and Resistance Levels:
• The script dynamically plots support and resistance levels based on recent swing highs and lows (swingLookback).
• Purpose: Identifies potential reversal zones where price action may change direction, allowing for more precise entry and exit points.
How It Works:
• Buy Signal:
A buy signal is generated when:
• The price enters a high-volume zone.
• The price crosses above a 5-period moving average.
• The cumulative delta shows more buying pressure (cumulativeDelta > SMA of cumulativeDelta).
• The RSI is below 70 (not in overbought conditions).
• Sell Signal:
A sell signal is generated when:
• The price enters a high-volume zone.
• The price crosses below a 5-period moving average.
• The cumulative delta shows more selling pressure (cumulativeDelta < SMA of cumulativeDelta).
• The RSI is above 30 (not in oversold conditions).
• Dynamic Support and Resistance Lines:
Drawn based on recent swing highs and lows, these lines provide context for potential price reversals or breakouts.
• VWAP and Order Imbalance Lines:
Plotted to show the average traded price and highlight order flow shifts, helping to validate buy/sell signals.
How to Use:
1. Apply the Indicator:
Add the script to your chart and adjust the settings to match your trading style and preferred timeframe (optimized for M5/M15).
2. Interpret the Signals:
Use the buy and sell signals in conjunction with dynamic support/resistance, VWAP, and order imbalance lines to identify high-probability trade setups.
3. Monitor Alerts:
Set alerts for significant order flow events to receive notifications when there is a positive or negative order imbalance, indicating potential market shifts.
What Makes It Unique:
This script is unique because it combines multiple market analysis tools — relative volume zones, smart order flow, VWAP, RSI filtering, and dynamic support/resistance — to provide a well-rounded, multi-dimensional view of the market. This integration allows traders to make more informed decisions by validating signals across various indicators, enhancing overall trading accuracy and effectiveness.

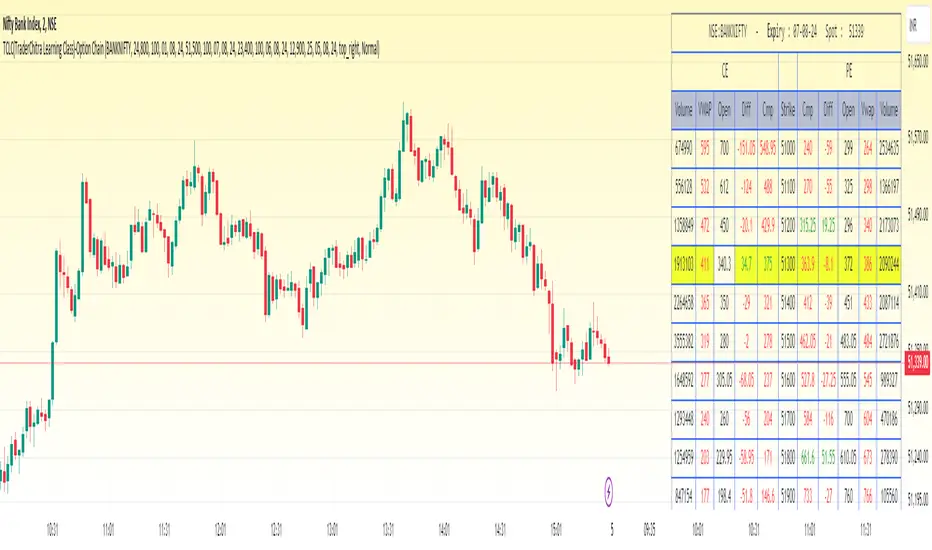
TCLC(TraderChitra Learning Class)-Option ChainThis indicator plots the Option chain data of the following instruments and columns..
It plots 11 rows ,
5 Rows above the input strike price
1 Row for the input strike price
5 Rows below the input strike price
Instruments :
1. NIFTY
2. BANKNIFTY
3. FINNIFTY
4. MIDCPNifty
Columns :
1. StrikePrice
2.CMP
3.Volume
4.VWAP
5.Diff (Open-Close)
Traders need to change the expiry date to check the premium of the corresponding instruments...
There are few key things,
1. Rows in yellow are marked as ATM strike price
2. Cell values in red / green indicates the prices are trading above / below the VWAP
The prices are expected to be bullish when cmp trades above VWAP and we can gauge the trend
The column Volume provides the details in which strike price more traders are actively traded..
The far month contracts can also be changed in the settings and it helps the swing/positional traders
The Strike price can be modified to check the appropriate strikes
Inside Bar Setup [as]Inside Bar Setup Indicator Description
The **Inside Bar Setup ** indicator is a powerful tool for traders to identify and visualize inside bar patterns on their charts. An inside bar pattern occurs when the current candle's high is lower than the previous candle's high, and the current candle's low is higher than the previous candle's low. This pattern can indicate a potential breakout or a continuation of the existing trend.
Key Features:
1. **Highlight Inside Bar Patterns:**
- The indicator highlights inside bar patterns with distinct colors for bullish and bearish bars. Bullish inside bars are colored with the user-defined bull bar color (default lime), and bearish inside bars are colored with the user-defined bear bar color (default maroon).
2. **Marking Mother Candle High and Low:**
- The high and low of the mother candle (the candle preceding the inside bar) are marked with horizontal lines. The high is marked with a green line, and the low is marked with a red line.
- These levels are labeled as "Range High" and "Range Low" respectively, with the labels displayed a few bars to the right for clarity. The labels have a semi-transparent background for better visibility.
3. **Target Levels:**
- The indicator calculates and plots potential target levels (T1 and T2) for both long and short positions based on user-defined multipliers of the mother candle's range.
- For long positions, T1 and T2 are plotted above the mother candle's high.
- For short positions, T1 and T2 are plotted below the mother candle's low.
- These target levels are optional and can be toggled on or off via the input settings.
4. **Customizable Inputs:**
- **Colors:**
- Bull Bar Color: Customize the color for bullish inside bars.
- Bear Bar Color: Customize the color for bearish inside bars.
- **Long Targets:**
- Show Long T1: Toggle the display of the first long target.
- Show Long T2: Toggle the display of the second long target.
- Long T1: Multiplier for the first long target above the mother candle's high.
- Long T2: Multiplier for the second long target above the mother candle's high.
- **Short Targets:**
- Show Short T1: Toggle the display of the first short target.
- Show Short T2: Toggle the display of the second short target.
- Short T1: Multiplier for the first short target below the mother candle's low.
- Short T2: Multiplier for the second short target below the mother candle's low.
5. **New Day Detection:**
- The indicator detects the start of a new day and clears the inside bar arrays, ensuring that the pattern detection is always current.
#### Usage:
- Add the indicator to your TradingView chart.
- Customize the inputs to match your trading strategy.
- Watch for highlighted inside bars to identify potential breakout opportunities.
- Use the marked range highs and lows, along with the calculated target levels, to plan your trades.
This indicator is ideal for traders looking to capitalize on inside bar patterns and their potential breakouts. It provides clear visual cues and customizable settings to enhance your trading decisions.
Note:
This indicator is based on famous 15 min inside bar strategy shared by Subashish Pani on his youtube channel Power of stocks. Please watch his videos to use this indicator for best results.

NSE Option Chain
This Indicator show Options Data on signal dashboard , that help trader to analyse the market.
Options data consist of two things , Call and Put.
Every Strike has its Call and Put price.
So if user Opens any chart which is traded in options , dashboard will show total 16 Call and 16 Put strikes
8 Above from ATM and 8 Below from ATM.
On left hand side of dashboard there is Call data and on right side there is Put data.
Call side datas are , Call LTP which is latest price of that call strike , Call Chg which is change in points from previous day close and third is Call % which is % change from previous day close.
Same is on put side.
Color code is done based on positive or negative of data. If change or % is negative then color is red else green.
ATM strike data is plotted in bold
Inputs :
Spot Symbol Input for Option dashboard
Expiry date of that option contract
Strike interval between 2 strikes
Reference ATM strike ( user should keep this input as current ATM strike )
How to Use :
If dashboard shows call side is negative and put side is positive then that means market Bearish , because falling market leads to falling price of call and increase in price of Put.
Similarly if put is negative and call is positive then market is bullish.
This dashboard give trend conformation , trader should take other conformation also before taking trade.

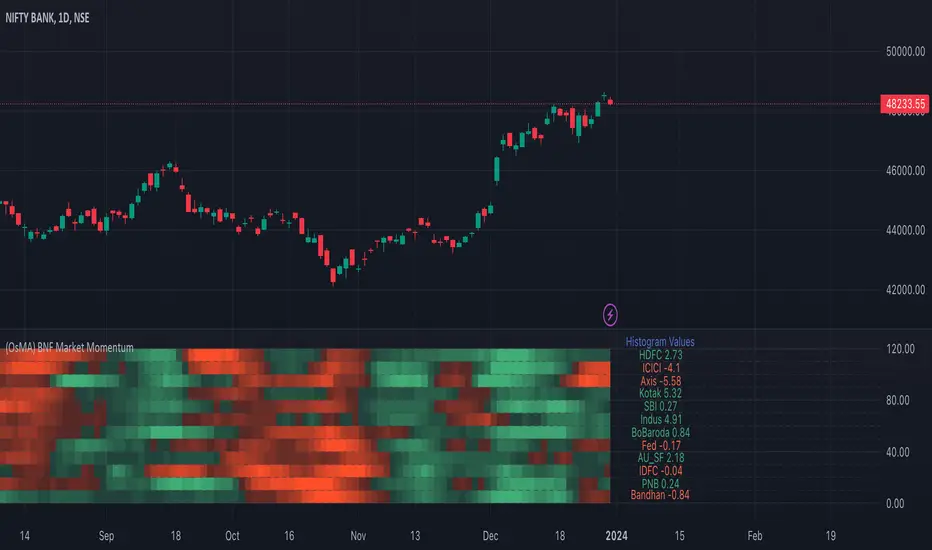
Bank Nifty Market Breadth (OsMA)This indicator is the market breadth for Bank Nifty (NSE:BANKNIFTY) index calculated on the histogram values of MACD indicator. Each row in this indicator is a representation of the histogram values of the individual stock that make up Bank Nifty. Components are listed in order of its weightage to Bank nifty index (Highest -> Lowest).
When you see Bank Nifty is on an uptrend on daily timeframe for the past 10 days, you can see what underlying stocks support that uptrend. The brighter the plot colour, the higher the momentum and vice versa. Looking at the individual rows that make up Bank Nifty, you can have an understanding if there is still enough momentum in the underlying stocks to go higher or are there many red plots showing up indicating a possible pullback or trend reversal.
The plot colours are shown as a percentage of the current histogram value taken from MACD from the highest histogram value of the previous 200 bars shown on the current timeframe. Look back value of 200 bars was chosen as it provided a better representation of the current value from its peak over the recent past(previous 200 bars), on all timeframes. Histogram value do grow/fall along with the underlying stock price, so choosing the chart's all-time high/low value as peak was not ideal. Labels on the right show the current histogram value.
Base Code taken from @fengyu05's S&P 500 Market Breadth indicator.
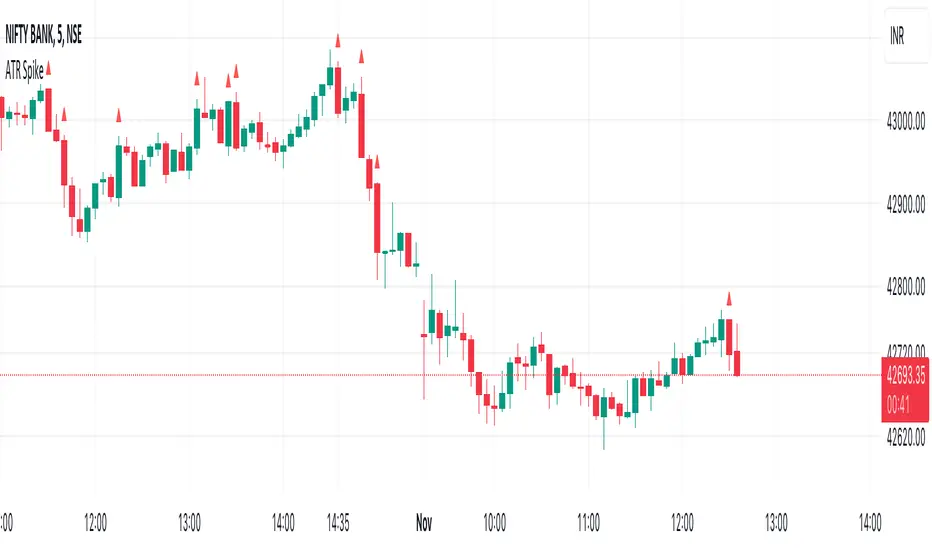
ATR SpikeALWAYS TRADE THE DIRECTION OF THE TREND
This indicator is useful for 5-minute Bank Nifty intraday trading.
It compares the Open-Close value for a 5-minute bar with the current ATR value.
When a bar has higher than the ATR value then it means that the current bar has a higher Open-Close than the ATR.
This means that after a period of dull action, some action has taken place.
And more action will follow in the direction of the immediate trend.
It signals the start of momentum which I look for as a intraday trader.
Feel free to experiment and change values as it suits you.
I use it on Bank Nifty only on 5 minute timeframe with 14 period ATR.
DJ Soori Trading StrategyThe strategy combines three indicators: Exponential Moving Average (EMA), Weighted Moving Average (WMA), and Average Directional Index (ADX).
The EMA and WMA are used to track the average price over different time periods.
The ADX measures the strength of a trend in the market.
The strategy generates buy signals when the EMA is higher than the WMA and the ADX is above a certain threshold. It suggests a potential uptrend.
It generates sell signals when the EMA is lower than the WMA and the ADX is above the threshold. It suggests a potential downtrend.
The strategy also considers whether the ADX is rising or falling to indicate the strength of the trend.
The EMA, WMA, and ADX values are plotted on the chart.
Buy and sell signals are shown as labels on the chart, indicating "Buy (Strong)" or "Buy (Weak)" for buy signals, and "Sell (Strong)" or "Sell (Weak)" for sell signals.

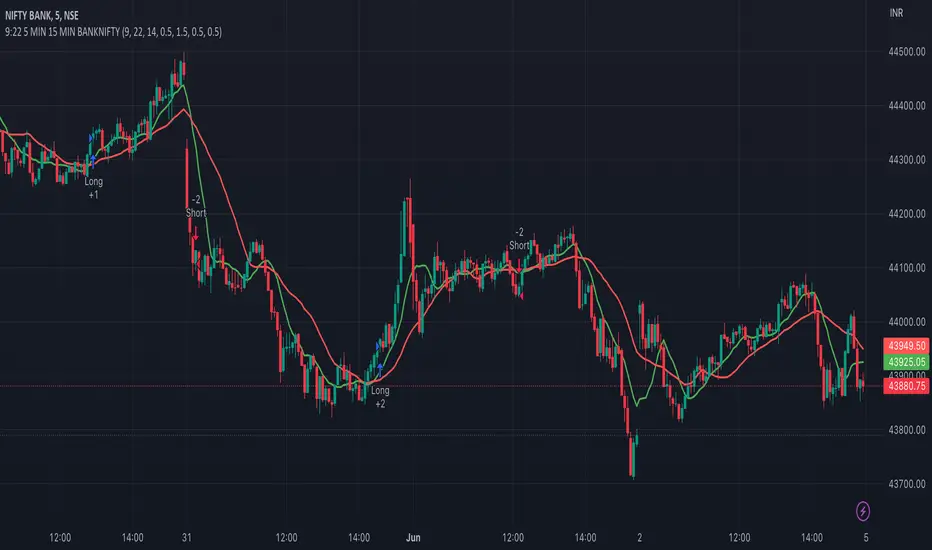
9:22 5 MIN 15 MIN BANKNIFTY9:22 5 MIN 15 MIN BANKNIFTY Strategy with Additional Filters
The 9:22 5 MIN 15 MIN BANKNIFTY Strategy with Additional Filters is a trend-following strategy designed for trading the BANKNIFTY instrument on a 5-minute chart. It aims to capture potential price movements by generating buy and sell signals based on moving average crossovers, breakout confirmations, and additional filters.
Key Features:
Fast MA Length: 9
Slow MA Length: 22
ATR Length: 14
ATR Filter: 0.5
Trailing Stop Percentage: 1.5%
Pullback Threshold: 0.5
Minimum Candle Body Percentage: 0.5
Use Breakout Confirmation: Enabled
Additional Filters:
Volume Threshold: Set a minimum volume requirement for trades.
Trend Filter: Optionally enable a trend filter based on a higher timeframe moving average.
Momentum Filter: Optionally enable a momentum filter using the RSI indicator.
Support/Resistance Filter: Optionally enable a filter based on predefined support and resistance levels.
Buy and Sell Signals:
Buy Signal: A buy signal is generated when the fast moving average crosses above the slow moving average, with additional confirmation from breakout and volume criteria, along with optional trend, momentum, and support/resistance filters.
Sell Signal: A sell signal is generated when the fast moving average crosses below the slow moving average, with similar confirmation and filtering criteria as the buy signal.
Exit Strategy:
The strategy employs a trailing stop-loss mechanism based on a percentage of the average entry price. The stop-loss is dynamically adjusted to protect profits while allowing for potential upside.
Please note that this strategy should be thoroughly backtested and evaluated in different market conditions before applying it to live trading. It is also recommended to adjust the parameters and filters according to individual preferences and risk tolerance.
Feel free to customise and adapt the description as needed to suit your preferences and the specific details of your strategy.
Bank nifty puller and Dragger Hello Guys
using the below script you can check the nifty bank puller and draggers at live
how to use it?
it's straightforward
in the table, we will see the points contribution by each bank to Bank nifty
graph shows the overall strength of the buyers and sellers
using graphs also you can trade
but If you want to use a graph please note these important points
1:when the evergreen line cut the red line from below to top (cross-over) it says that buyers are strong but sometimes cross-over may fail and fall again
2: same things happen with the red line also
3: sometimes the graph shows that's a big difference between the red line and the green line that the market opened gap up gap down ( its difficult to define ) will update soon
4:when the market consolidates red and green lines will be very near to each other
5: when the green line is upper side the buyers are strong when the red line is upside sellers are strong (but sometimes it may mislead please be careful )
using the table you can check the overall view of all important banks
according to the time frame, data will be shown
this image shows the break out at 12.45 pm
2nd image shows the consolidation face of the market
this image shows that directly after opening the market sellers became stronger
this is how you can use the indicator
you can use graph or you can use table to get the over all view of the Bank nifty

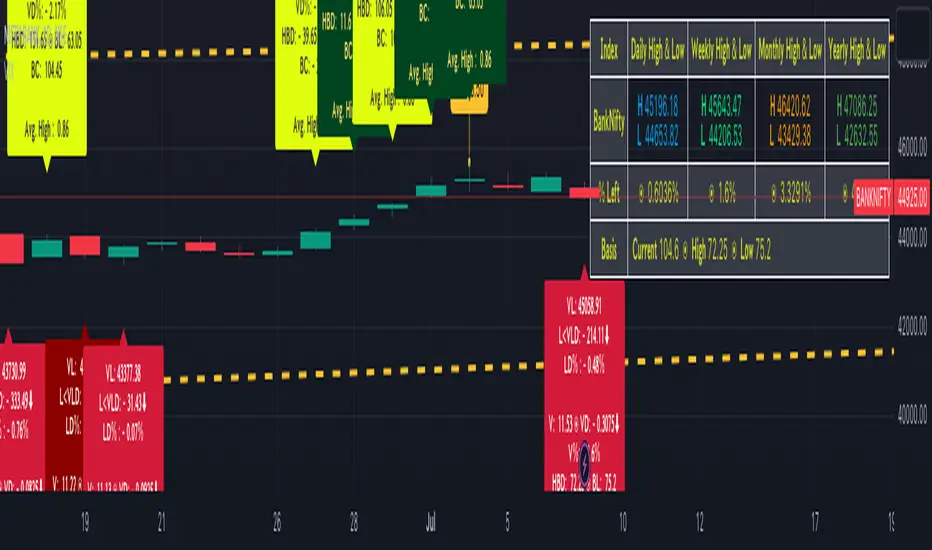
BankNifty targets using VIX Version 2Original Idea Credit: Verified Market Waves
Hi,
After watching different videos online on how to get targets of BankNifty & Nifty decided to write this small script using VIX.
Nothing great but I really like the concept of getting high and low targets for the day or weekly or monthly or yearly.
What does the script do
1. We get closing of India Vix & BankNifty and Nifty
2. We get square root of Daily (365 days) | Weekly (52) | Monthly (12) & Yearly (1)
3. We divide India Vix closing with different square root to get a decimal value.
4. We use the derived value from step 3 which is used as % to calculate high and low values on BankNifty close price.
Small explanation via below screen shot to understand how to use it.
As always it comes with source code so you can modify as per your requirement.
Hope it helps 👍
FRAMA & CPMA Strategy [CSM]The script is an advanced technical analysis tool specifically designed for trading in financial markets, with a particular focus on the BankNifty market. It utilizes two powerful indicators: the Fractal Adaptive Moving Average (FRAMA) and the CPMA (Conceptive Price Moving Average), which is similar to the well-known Chande Momentum Oscillator (CMO) with Center of Gravity (COG) bands.
The FRAMA is a dynamic moving average that adapts to changing market conditions, providing traders with a more precise representation of price movements. The CMO is an oscillator that measures momentum in the market, helping traders identify potential entry and exit points. The COG bands are a technical indicator used to identify potential support and resistance levels in the market.
Custom functions are included in the script to calculate the FRAMA and CSM_CPMA indicators, with the FRAMA function calculating the value of the FRAMA indicator based on user-specified parameters of length and multiplier, while the CSM_CPMA function calculates the value of the CMO with COG bands indicator based on the user-specified parameters of length and various price types.
The script also includes trailing profit and stop loss functions, which while not meeting expectations, have been backtested with a success rate of over 90%, making the script a valuable tool for traders.
Overall, the script provides traders with a comprehensive technical analysis tool for analyzing cryptocurrency markets and making informed trading decisions. Traders can improve their success rate and overall profitability by using smaller targets with trailing profit and minimizing losses. Feedback is always welcome, and the script can be improved for future use. Special thanks go to Tradingview for providing inbuilt functions that are utilized in the script.

AI-Bank-Nifty Tech AnalysisThis code is a TradingView indicator that analyzes the Bank Nifty index of the Indian stock market. It uses various inputs to customize the indicator's appearance and analysis, such as enabling analysis based on the chart's timeframe, detecting bullish and bearish engulfing candles, and setting the table position and style.
The code imports an external script called BankNifty_CSM, which likely contains functions that calculate technical indicators such as the RSI, MACD, VWAP, and more. The code then defines several table cell colors and other styling parameters.
Next, the code defines a table to display the technical analysis of eight bank stocks in the Bank Nifty index. It then defines a function called get_BankComponent_Details that takes a stock symbol as input, requests the stock's OHLCV data, and calculates several technical indicators using the imported CSM_BankNifty functions.
The code also defines two functions called get_EngulfingBullish_Detection and get_EngulfingBearish_Detection to detect bullish and bearish engulfing candles.
Finally, the code calculates the technical analysis for each bank stock using the get_BankComponent_Details function and displays the results in the table. If the engulfing input is enabled, the code also checks for bullish and bearish engulfing candles and displays buy/sell signals accordingly.
The FRAMA stands for "Fractal Adaptive Moving Average," which is a type of moving average that adjusts its smoothing factor based on the fractal dimension of the price data. The fractal dimension reflects self-similarity at different scales. The FRAMA uses this property to adapt to the scale of price movements, capturing short-term and long-term trends while minimizing lag. The FRAMA was developed by John F. Ehlers and is commonly used by traders and analysts in technical analysis to identify trends and generate buy and sell signals. I tried to create this indicator in Pine.
In this context, "RS" stands for "Relative Strength," which is a technical indicator that compares the performance of a particular stock or market sector against a benchmark index.
The "Alligator" is a technical analysis tool that consists of three smoothed moving averages. Introduced by Bill Williams in his book "Trading Chaos," the three lines are called the Jaw, Teeth, and Lips of the Alligator. The Alligator indicator helps traders identify the trend direction and its strength, as well as potential entry and exit points. When the three lines are intertwined or close to each other, it indicates a range-bound market, while a divergence between them indicates a trending market. The position of the price in relation to the Alligator lines can also provide signals, such as a buy signal when the price crosses above the Alligator lines and a sell signal when the price crosses below them.
In addition to these, we have several other commonly used technical indicators, such as MACD, RSI, MFI (Money Flow Index), VWAP, EMA, and Supertrend. I used all the built-in functions for these indicators from TradingView. Thanks to the developer of this TradingView Indicator.
I also created a BankNifty Components Table and checked it on the dashboard.

BankNifty_CSMLibrary "BankNifty_CSM"
TODO: add library description here
getLtp_N_Chang(openPrice, closePrice, highPrice, hl2Price, lowPrice, hlc3Price, bankNiftyClose)
Parameters:
openPrice (float)
closePrice (float)
highPrice (float)
hl2Price (float)
lowPrice (float)
hlc3Price (float)
bankNiftyClose (float)

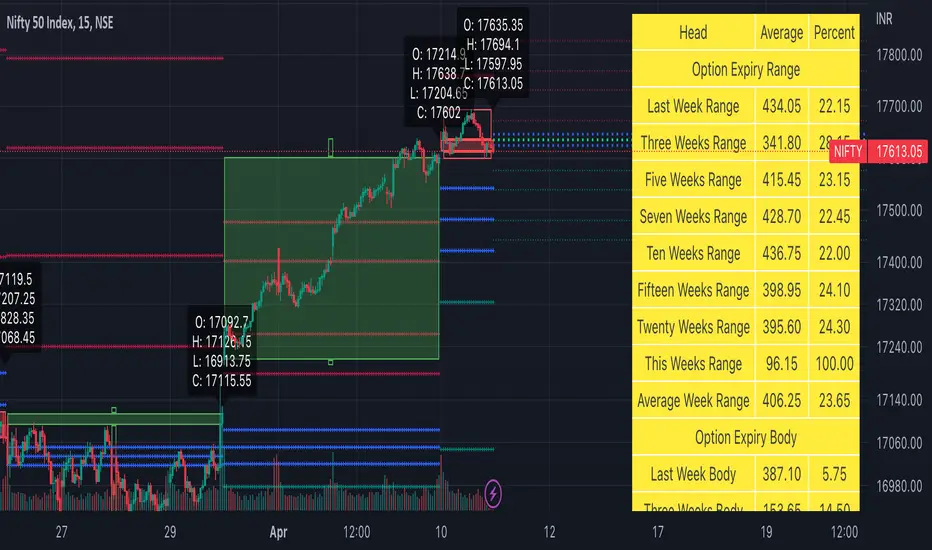
Weekly Options Expiry Candle V.2In India Weekly options expire on Thursday and that creates a different price action candle than the week timeframe.
My previous script Weekly Options Expiry Candle has some limitations. This script overcame those limitations and added some features.
You can use this in any intraday time frame candle.
It will show:
All expiry candle in box format
Expiry OHLC label
Pivot (Floor or Fibonacci) based on expiry OHLC data
Developing Expiry candle and Pivot
A table showing expiry range(high-low) and Expiry body abs(open-close) stats.
You can turn on or off any feature.
Please let me know if you found this script useful or have any questions or suggestions.
NSE:BANKNIFTY
NSE:NIFTY
Strategy: Range BreakoutWhat?
In the price action, levels have a significant role to play. Based on the price moving above/below the levels - the underlying instrument shows some price-action in the direction of breakout/breakdown.
There are plenty of ways level can be determined. Levels are the decision point to take a trade or not. But if we make the level derivation complex, then the execution may get hamper.
This strategy script, developed in PineScript v5, is our attempt at solving this problem at the core by providing this simple, yet elegant solution to this problem.
It's essentially an attempt to Trade Simple by drawing logical (horizontal) lines in the chart and take actions, after multiple associated parameters confirmation, on the breakout / breakdown of the levels.
How?
Let us explain how we are drawing the levels.
We are depending on some of the parameters as described below:
Open Range : During intraday movement, often if prices move beyond a particular level, it exibits more movement in the same swing in same direction. We found out, through our back testing for Indian Indices like NSE:NIFTY , NSE:BANKNIFTY or NSE:CNXFINANCE the first 15m (i.e 09:15 AM to 09:30 AM, IST) is one of such range. For Indian stocks, it is 9:15 to 9:45. And for MCX MCX:CRUDEOIL1! it's 5:00 pm to 6:00 pm. There are our first levels.
PDHCL : Previous Day High, Close, Low. This is our next level
VWAP : The rolling VWAP (volume weighted average price)
In the breakout/breakdown of the Open Range and Previous Day High/Low, we are taking the trade decisions as follows using CEST principle:
C onditions :
If current bar's (say you are in 5m timeframe) closing is broken out the Open Range High or Previous Day High, taken a Buy/Long decision (let's say buying a Call Option CE or selling a Put Option PE or buying the future or cash).
If current bar's (say you are in 5m timeframe) closing is broken down the Open Range Low or Previous Day Low, taken a Sell/Short decision (let's say buying a Put Option CE or selling a Call Option PE or selling the future or cash).
Additionally, and optionally (default ON, one can turn off): we are checking various other associated multiple confirmations as follows:
1. Momentum : Checking 14-period RSI value is more than 50 or less than 50 (all parameters like period, OB, OS ranges are configurable through settings)
2. Current bar's volume is more than the last 20 bars volume average. How much more - that multiplier is also configurable. (default is 1)
3. The breakout candle is bullish (green) or bearish (red).
E ntry :
All of these happens only on the closing of the candle . Means: Non Repainting! .
Clearly in the chart we are showing as green up arrow BO (breakout for buy) and red down arrow BD (breakdown for sell) to take your decision process smooth.
So, on the closing of the decision BO/BD candle we are entering the trade (with a thumping heart and nail biting ...)
S top Loss :
We are relying on the time tasted (last 40 years) mechanism of Average True Range (ATR) of default 14 period. This default period is also configurable.
So for Long trades: the 14 period ATR low band is the SL.
For Short trades: the 14 period ATR high band is the SL.
T arget :
We are depending on the thump rule of 1:2 Risk Reward. It's simple and effective. No fancy thing. We are closing the trade on double the favorable price movement compared to the SL placed. Of course, this RR ratio is confiurable from the settings, as usual.
What's Unqiue in it?
The utter simplicity of this trading mechanism. No fancy things like complex chart pattern, OI data, multiple candlestick patterns, Order flow analysis etc.
Simple level determination,
Marking clearly in the chart.
Making each parameter configurable in Settings and showing tooltip adjacent to the parameter to make you understand it better for your customization,
Wait for the candle close, thus eliminating the chances of repainting menace (as much as possible)
Additional momentum and volume check to trade entry confirmation.
Works with normal candlestick (nothing special ones like HA ...)
Showing everything as a Summary Table (which, again can be turned off optionally) overlaying at the bottom-right corner of the chart,
Optionally the Summary Table can be configured to alert you back (say you get it notified in your email or SMS).
That way, a single, simple, effective trade setup will ease your journey as smooth sail as possible.
Mentions
There are plenty of friends from whom time to time we borrowed some of the ideas while working closely together over last one year.
From tradingview community, we took the spirit of @zzzcrypto123 awesome work done long back (in 2020) as the indicator "ORB - Opening Range Breakout". (We tried to reach him for his explicit consent, unable to catch hold of him).
Some other publicly available materials we have consulted to get the additional checks (like RSI, volume).
Lat word
Use it please and thank you for your constant patronage in following us in this awesome platform. Let's keep growing together.
Disclaimer :
This piece of software does not come up with any warrantee or any rights of not changing it over the future course of time.
We are not responsible for any trading/investment decision you are taking out of the outcome of this indicator.

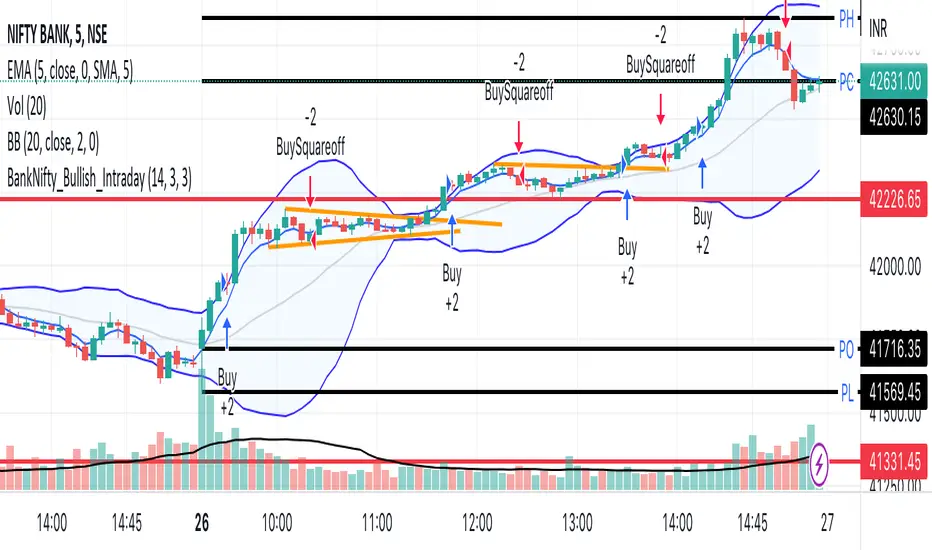
BankNifty_Bullish_Intraday
The script uses following mechanism to give a signal of BUY if multiple parameters evaluated are all passed.
ENTRY-
1. 5 min MACD should be more than its previous tick
2. 15 min MACD should be more than its previous tick
3. 60 min MACD should be more than its previous tick
4. ADX should be more than 12
5. RSI should be more than 60
6. Stochastic %k should have cross over with %d
7. Bollinger band upper band value should be more than previous tick
EXIT
If the 5 min bar price closes below 5 min EMA , it gives an exit signal.