BankNifty-15min Intraday-High Risk-R-AlgoAI-Final Copy// This script is for educational and informational purposes only.
// It does not constitute financial or investment advice.
// Trading involves substantial risk and may not be suitable for all investors.
// Always do your own research or consult with a licensed financial advisor
// before making any trading or investment decisions.
// The author is not responsible for any losses incurred using this script.
⚡ Overview:
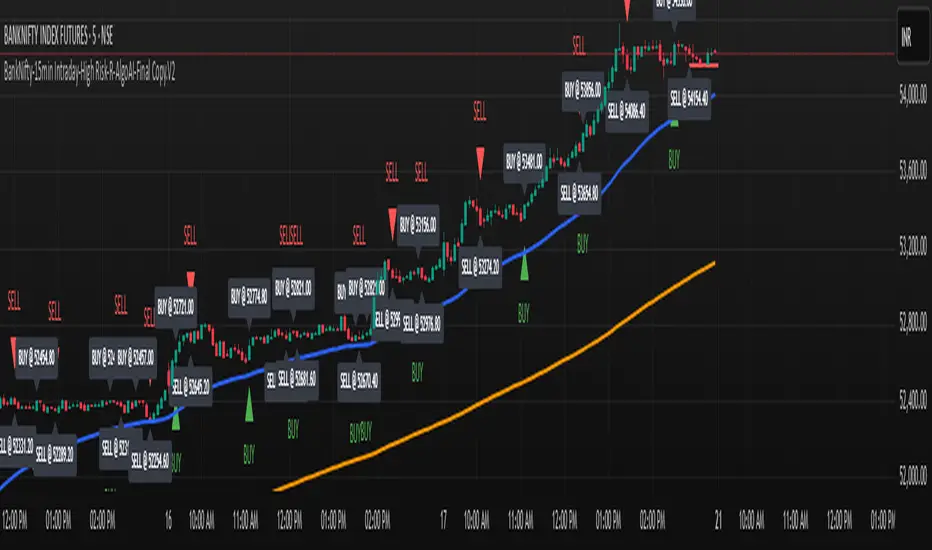
This script is a technical indicator designed for intraday trading on the Bank Nifty future chart using the 15-minute timeframe. It uses a combination of normalized buy and sell pressure along with a Hull Moving Average (HMA) smoothing method and volume-based normalization to detect potential buy and sell signals.
💡 Main Concept:
Buy and Sell Pressure Calculation:
The script calculates:
bp (Buy Pressure): close - low
sp (Sell Pressure): high - close
These values are smoothed using a custom Hull Moving Average (HMA) function, designed to reduce lag and react quicker to price changes compared to traditional moving averages.
📊 Normalized Signals:
Buy and Sell pressures are normalized against their HMA smoothed values.
Volume normalization is also applied to adjust for the effect of market activity on the pressure signals.
📌 Signal Logic:
A Buy Signal is generated when:
Only one signal per day is allowed to avoid signal spamming.
A Sell Signal is generated under the opposite conditions:
One sell signal per day.
🧾 Visual Output:
When a signal is triggered, the script:
Draws a horizontal line at the signal price (with labels like BUY @ or SELL @).
Plots triangle markers on the chart to highlight buy (green) or sell (red) signals.
Deletes or extends lines at the end of each day to maintain visual clarity.
📈 Additional Features:
EMA 50 & EMA 200:
Plots two common Exponential Moving Averages (50-period and 200-period) for trend visualization.
⚠️ Important Notes:
This script is meant for educational and research purposes only.
It is designed for high-risk intraday trading.
Signals are based on historical behavior and should not be treated as financial advice.
No stop-loss or take-profit logic is included — traders should manage risk independently.
✅ Summary:
This indicator offers a simple visual and quantitative approach to spot potential intraday turning points for Bank Nifty future on a 15-minute chart, with clear buy and sell markers. It combines volume, price pressure, and moving average smoothing to filter out random price movements.
Bankniftyanalysis
Relative volume zone + Smart Order Flow Dynamic S/ROverview:
The Relative Volume Zone + Smart Order Flow with Dynamic S/R indicator is designed to help traders identify key trading opportunities by combining multiple technical components. This script integrates relative volume analysis, order flow detection, VWAP, RSI filtering, and dynamic support and resistance levels to offer a comprehensive view of the market conditions. It is particularly effective on shorter timeframes (M5, M15), making it suitable for scalping and day trading strategies.
Key Components:
1. Relative Volume Zones:
• The script calculates the relative volume by comparing the current volume with the average volume over a defined lookback period (volLookback). When the relative volume exceeds a specified multiplier (volMultiplier), it indicates a high volume zone, signaling potential accumulation or distribution areas.
• Purpose: Identifies high-volume trading zones that may act as significant support or resistance, indicating possible entry or exit points.
2. Smart Order Flow Analysis:
• The indicator uses Volume Delta (the difference between buying and selling volume) and a Cumulative Delta to detect order imbalances in the market.
• Order Imbalance is identified using a moving average of the Volume Delta (orderImbalance), which helps highlight hidden buying or selling pressure.
• Purpose: Reveals market sentiment by showing whether buyers or sellers dominate the market, aiding in the identification of trend reversals or continuations.
3. VWAP (Volume Weighted Average Price):
• VWAP is calculated over a default daily length (vwapLength) to show the average price a security has traded at throughout the day, based on both volume and price.
• Purpose: Provides insight into the fair value of the asset, indicating whether the market is in an accumulation or distribution phase.
4. RSI (Relative Strength Index) Filter:
• RSI is used to filter buy and sell signals, preventing trades in overbought or oversold conditions. It is calculated using a specified period (rsiPeriod).
• Purpose: Reduces false signals and improves trade accuracy by only allowing trades when RSI conditions align with volume and order flow signals.
5. Dynamic Support and Resistance Levels:
• The script dynamically plots support and resistance levels based on recent swing highs and lows (swingLookback).
• Purpose: Identifies potential reversal zones where price action may change direction, allowing for more precise entry and exit points.
How It Works:
• Buy Signal:
A buy signal is generated when:
• The price enters a high-volume zone.
• The price crosses above a 5-period moving average.
• The cumulative delta shows more buying pressure (cumulativeDelta > SMA of cumulativeDelta).
• The RSI is below 70 (not in overbought conditions).
• Sell Signal:
A sell signal is generated when:
• The price enters a high-volume zone.
• The price crosses below a 5-period moving average.
• The cumulative delta shows more selling pressure (cumulativeDelta < SMA of cumulativeDelta).
• The RSI is above 30 (not in oversold conditions).
• Dynamic Support and Resistance Lines:
Drawn based on recent swing highs and lows, these lines provide context for potential price reversals or breakouts.
• VWAP and Order Imbalance Lines:
Plotted to show the average traded price and highlight order flow shifts, helping to validate buy/sell signals.
How to Use:
1. Apply the Indicator:
Add the script to your chart and adjust the settings to match your trading style and preferred timeframe (optimized for M5/M15).
2. Interpret the Signals:
Use the buy and sell signals in conjunction with dynamic support/resistance, VWAP, and order imbalance lines to identify high-probability trade setups.
3. Monitor Alerts:
Set alerts for significant order flow events to receive notifications when there is a positive or negative order imbalance, indicating potential market shifts.
What Makes It Unique:
This script is unique because it combines multiple market analysis tools — relative volume zones, smart order flow, VWAP, RSI filtering, and dynamic support/resistance — to provide a well-rounded, multi-dimensional view of the market. This integration allows traders to make more informed decisions by validating signals across various indicators, enhancing overall trading accuracy and effectiveness.

EMA+ATR Scalping Indicator by TradeTechIndicator Description: “EMA+ATR Scalping Indicator by Tradetech”
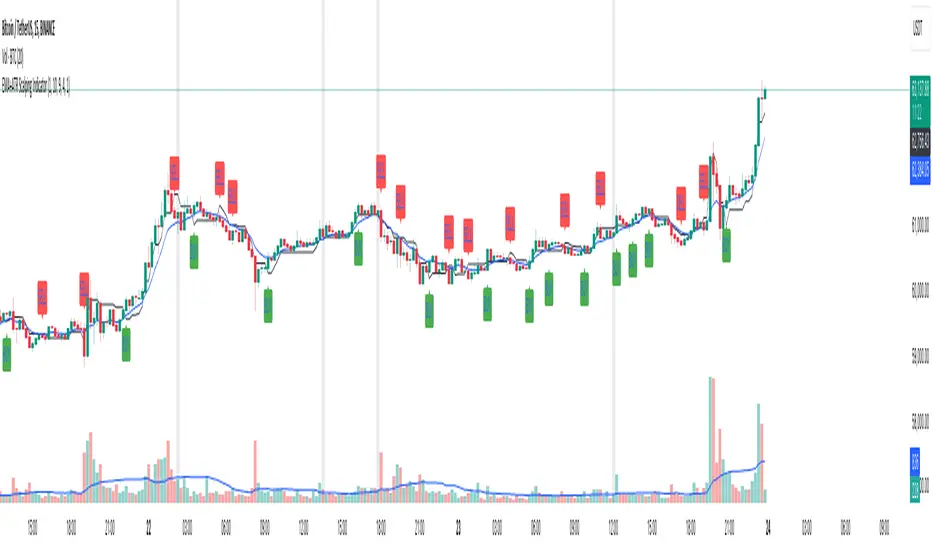
The “EMA+ATR Scalping Indicator” is a powerful tool designed to help traders identify optimal entry and exit points in the market, focusing on high-probability scalping opportunities. This indicator combines the strength of the Exponential Moving Average (EMA) with the Average True Range (ATR) to generate precise signals, aiming to maximize profits while minimizing risk.
Key Features:
• Sensitivity Key Value: Allows customization of the ATR multiplier, fine-tuning the trailing stop level for different market conditions.
• ATR Calculation: Measures market volatility over a specified period, dynamically adjusting the trailing stop to capture significant price moves while reducing noise.
• EMA for Confirmation: The 20-period EMA is used as a trend filter, ensuring that trades are aligned with the prevailing market direction.
• Trade Cooldown Period: Prevents over-trading by enforcing a minimum number of bars between consecutive trades, reducing the likelihood of whipsaws.
• Flat ATR Threshold: Identifies periods of low volatility (flat ATR), during which trading is avoided to protect against false signals.
Trading Logic:
• Entry Signals: The indicator generates long signals when the price crosses above the ATR trailing stop or breaks out consecutively in an uptrend, with the EMA confirming the bullish trend. Short signals are generated when the price crosses below the ATR trailing stop or consecutively breaks out in a downtrend, with the EMA confirming the bearish trend.
• Exit Signals: The exit points are defined by the ATR trailing stop, which adjusts dynamically with market conditions, ensuring that profits are locked in as the trend evolves.
• No Trading Zone: When the ATR is flat, indicating low volatility, the indicator displays a “No Trading Zone” to prevent taking positions in uncertain market conditions.
Why Combine EMA + ATR?
The combination of EMA and ATR in this indicator is crucial for several reasons:
1. Trend Identification (EMA): The EMA acts as a reliable trend filter, ensuring that trades are taken in the direction of the prevailing trend. By doing so, the indicator avoids taking trades against the momentum, which could result in lower probability setups.
2. Volatility-Based Trailing Stop (ATR): The ATR provides a volatility-adjusted stop-loss level, which is essential in scalping strategies where market conditions can change rapidly. This allows the trailing stop to widen during periods of high volatility and tighten during low volatility, optimizing the trade management process.
3. Enhanced Accuracy: By combining the EMA and ATR, the indicator filters out noise and avoids entering trades during flat market conditions, where the probability of false signals is higher. This synergy between trend and volatility creates a more robust and accurate scalping tool.
4. Dynamic Trade Management: The use of ATR for setting trailing stops ensures that the trade exits are dynamic and adaptable to current market conditions, maximizing the potential for capturing significant moves while minimizing drawdowns.
Overall, the EMA + ATR combination within the “EMA+ATR Scalping Indicator” provides a well-rounded approach to scalping, balancing trend-following with volatility management for more consistent trading results.
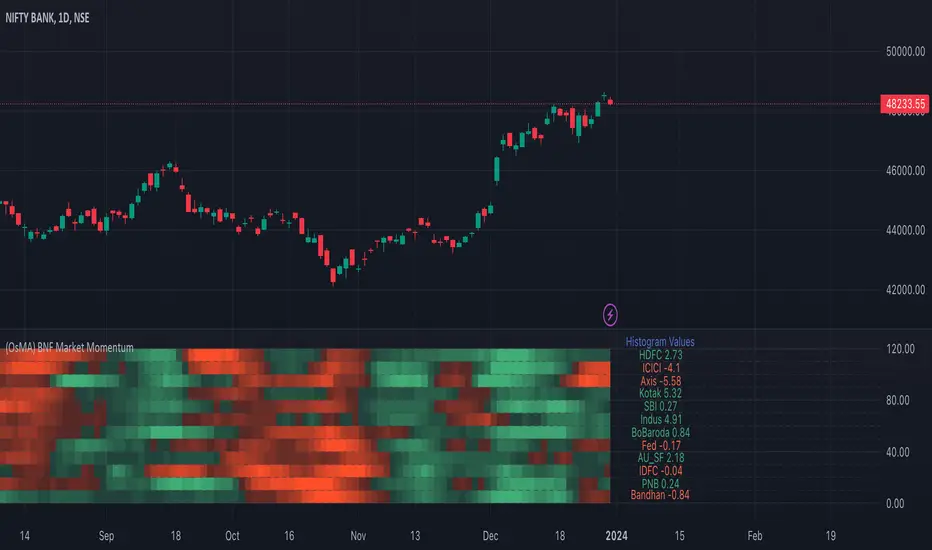
Bank Nifty Market Breadth (OsMA)This indicator is the market breadth for Bank Nifty (NSE:BANKNIFTY) index calculated on the histogram values of MACD indicator. Each row in this indicator is a representation of the histogram values of the individual stock that make up Bank Nifty. Components are listed in order of its weightage to Bank nifty index (Highest -> Lowest).
When you see Bank Nifty is on an uptrend on daily timeframe for the past 10 days, you can see what underlying stocks support that uptrend. The brighter the plot colour, the higher the momentum and vice versa. Looking at the individual rows that make up Bank Nifty, you can have an understanding if there is still enough momentum in the underlying stocks to go higher or are there many red plots showing up indicating a possible pullback or trend reversal.
The plot colours are shown as a percentage of the current histogram value taken from MACD from the highest histogram value of the previous 200 bars shown on the current timeframe. Look back value of 200 bars was chosen as it provided a better representation of the current value from its peak over the recent past(previous 200 bars), on all timeframes. Histogram value do grow/fall along with the underlying stock price, so choosing the chart's all-time high/low value as peak was not ideal. Labels on the right show the current histogram value.
Base Code taken from @fengyu05's S&P 500 Market Breadth indicator.
NITS - NIFTY INTRADAY TRADING SYSTEMNSE:NIFTY
Hello Traders..!
This is another indicator / system to make use for NIFTY & BANK NIFTY Intra day trading.
This is my Gift to the traders for this New Year 2024. Use this to your Edge and make some profits. All explained below.
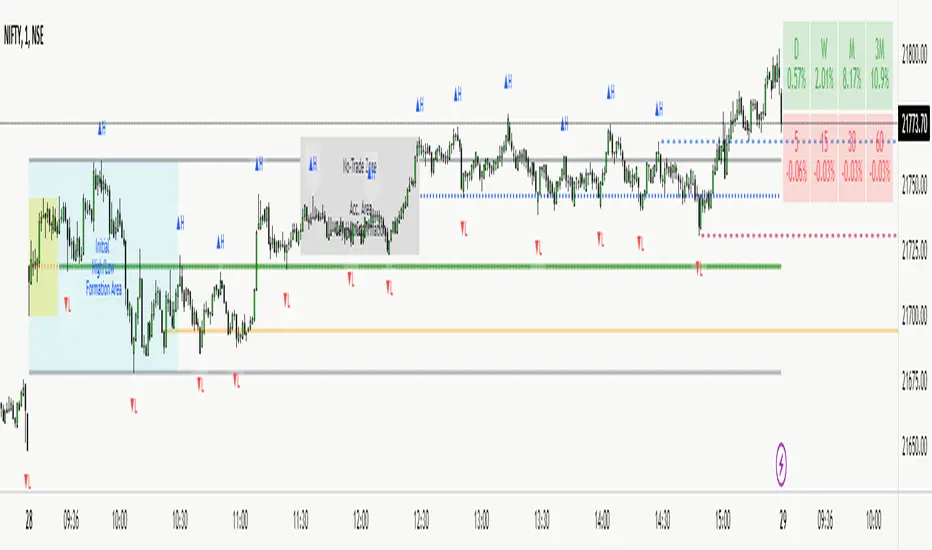
NIFTY INTRA-DAY TRADING SYSTEM
Explanation of Arrays:
-------------------------------
## FIRST 15 MIN SESSION BOX ##
From 09:15 to 09:30 where the initial orders will get collected and Auction takes place.
DO NOT engage into any trade in this session. Let the Box develop.
## INITIAL HIGH / LOW FORMATION SESSION ##
This session is from 09:15 to 10:30.
We can observe the Initial High or Low being formed for the day, that is VALID TILL 11:30.
## NO-TRADE ZONE / ACC. AREA / DAY’S H OR L CONFIRMATION SESSION ##
From 11:30 to 12:30
90% of time this is the session where the whole Day’s High or Low will get confirmed. Sometimes the market may violate this Session!
DO NOT engage into any fresh trade in this area.
Once the box is developed, you can see the Mid price line will be formed which is valid for the afternoon Trading session till 15:30.
## SIGNAL LINE, MIDDLE PRICE LINE, SESSION HIGH LOW LINES ##
Middle Price Line – the dotted line (Red colour) is Mid Price Line for the Initial session box. This acts as an important price level for the whole day.
Signal Line – the Solid line that will form after 10:30. Consider this price line as very important price line to which the price reacts with a good momentum, either break through or rejection and valid for the whole trading day.
Session High Low price line – high and low prices of the Initial session box which acts as a good Support / Resistance / Target / Stop loss. Even previous session’s price lines can also be used for the current day too.
## TREND BOX ##
Multi-Time frame trend box will show the real-time trend on different time frames. This box will be very helpful in trade decision. Please note that at least THREE HIGHER TIME FRAME TRENDS must be in the same direction to support your trade criteria for the better confirmation.
## VOLUME IMBALANCE ##
These orange coloured boxes are very tiny imbalances between prices that were formed during price movements. Algorithm will try to fill these imbalances on its way of filling orders. These price imbalances can be used for our edge while taking trades.
SOME TIPS:
---------------------------
1) Avoid Break out trades
2) Always trade the pull backs
3) Keep your Stops above / below the KEY LEVELS
4) Always follow the Higher Time frame trend while taking a trade.
If you trade in 1m TF consider 5m trend
If you trade in 5m TF consider 1H or 15m trend
5) Consider the higher TF closure of prices only, to validate the break out.
6) Trade what you see, market can do anything it wants.
7) Do not worry about losses. It happens and that is the business.
8) End your trading week in green no matter how big or small the profit is. Consistency is the key this business.
9) Keep in mind that the Market does two things only, either it will FILL THE GAP or GRAB THE LIQUIDITY. Just plan your trades accordingly. Liquidity levels like Previous Session / Day / Week / highs and lows.
10) The Market is a continuous business. It does not end for the specific day. It will not end its Buy or Sell model unless it completes its cycle, hence TRADE WHAT YOU SEE and not WHAT YOU THINK!
11) Unless the key swing high / low is broken and closed, DO NOT consider that move as a reversal. Consider that as a Liquidity grab. And it will continue in its previous trend.
HOW TO TAKE TRADE USING NITS: (one of the Techniques)
--------------------------------------------------------------------------------
As explained above, Do not engage in trade for the first 15 minutes.
Once the 15m box forms then look for divergence between NIFTY and BANK NIFTY.
Both Indices are supposed to trade in the same direction but at key levels and times, these instruments will make DIVERGENCE with its Highs and Lows.
Ex: one Index will make LOW AND LOWER LOW and at the same time other will make LOW AND HIGHER LOW. This deflection can be used for taking Buy Trades.
Ex:
If the Divergence forms at the Bottom then the market will move upwards.
If the Divergence forms at the Top then the market makes down move.
To confirm this divergence, the price will move away from that deflected Lows or Highs.
-----------------------------------
POINTS TO OBSERVE
------------------------------------
Mostly the first 15 min range that forms will either be very large candles or normal candles with rejection wicks or Shaved bar (open and H/L same)
Whenever you observe a very large wide range bars within the 15min range, consider the Day’s high and Low is already formed. And the market will be hovering inside that range only. Very useful for taking 50 points scalping here and there by using the signal line and middle line or Acc box mid line. In this scenario you have three important info of the day, OPEN HIGH & LOW established already, The market will only look for its close.
Ex:
If the market trades with normal candles, then consider your trades in two parts.
From 09:30 to 11:30 and from 12:30 to 15:30 as 11:30 to 12:30 will confirm the current day’s High / Low hence do not take a fresh position within that time.
1) Initial session trade – If the price does not break and close the 15 min range high/low, consider it is going to reverse and continue its trend till 10:30
Ex:
2) Mid session Trade – mostly the market accumulates positions and collects orders between 11:30 to 12:30 for the afternoon session. Once the session box is developed, the middle price line will form. Wait for the market breakout and close off this session’s high or low in Higher TF. The market will continue in the direction of breakout from this session and continue till 15:30. Hence wait for pull back till its mid price / high or low price lines of this Acc box and take trade in the initial breakout direction keeping stop above or below the session’s high or low.
Ex:
## Fixed Range Volume Profile as a Tool ##
-----------------
Note:
-----------------
Kindly do not ask for any codes or script details. The one technique what I explained (Divergence method) is more than enough for making a consistent earnings. Please study and back test / forward test for yourself for atleast 2 weeks time. Every traders aspect and mindset is different in seeing the market movements. Please design your own methodology and CONSIDER this as a BUSINESS..!
JUST.....
Believe the System
Be patient
Be Disciplined &
Be a Successful Earner..!!
LET YOUR ENDS MEET
(Hope I explained well)
Bull Bear Zones for Bank Nifty and Nifty IndexThis indicator will automatically plot daily Bullish and Bearish Zones. Also this indicator mainly works in the Nifty and Bank Nifty Intraday trades. Preferred time frames (3/5/15 Mins)
Calculation
Take Last 5 days O H L C then find H-O and H-L, take average of the difference of H-O and H-L then Minimum Value then the average difference is added with the day opening to get the bullish zone and the average is subtracted from the opening price to get the bearish zone
Long Trade
Buy above the bullish zone line or Buy near the bearish support levels when it takes support
Example 1 (Buy above Bullish Zone)
Short Trade
Sell below the bearish zone line or Sell when there is a rejection from the bullish zone
Example 1 (Sell Below Bearish Zone)
No Trade Zone
If the market move between the zones then, the momentum is very week.
Example 1

BankNifty_CSMLibrary "BankNifty_CSM"
TODO: add library description here
getLtp_N_Chang(openPrice, closePrice, highPrice, hl2Price, lowPrice, hlc3Price, bankNiftyClose)
Parameters:
openPrice (float)
closePrice (float)
highPrice (float)
hl2Price (float)
lowPrice (float)
hlc3Price (float)
bankNiftyClose (float)

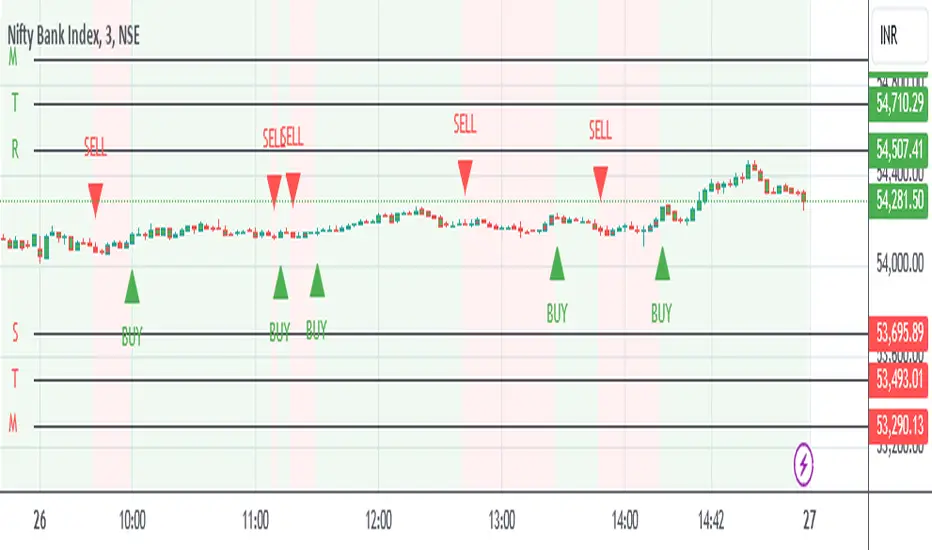
Banknifty BrahmāstraBanknifty Brahmastra Indicator is a Basic Simulating Indicator.
This indicator is built for capturing trend using average to plot buy / sell signal on chart.
Banknifty Brahmastra Indicator integrates visual labels to easily interpret signal for common people.
This indicator is also provide simple color code while trend continuations into candle colour along with background colour for confronts with trading decisions.
This basic indicator can use as an entry / exit reference points into complex strategies.
This Indicator can be used for any stocks and indexes but Indian traders can use this for especially into bank nifty futures & options to get maximum positive result decisions.
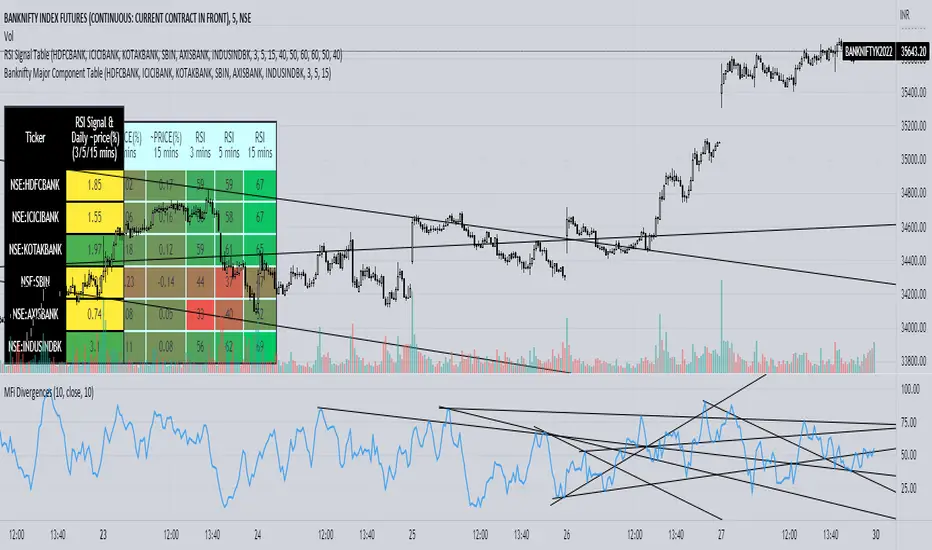
Banknifty Major Component TableThe table presented here is comprised of major Banknifty Index constituents showing price change in percentage terms and RSI value of three different timeframes to gauge overall Banknifty sentiment. This table is primarily created to cater scalpers and day traders. It helps traders to see market activity at a glance.
Nifty and Bank Nifty Dashboard V2This shows a performance glance of Dow and major Constituents of NSE:NIFTY or NSE:BANKNIFTY . This is an enhancement to the Bank nifty dashboard published earlier.
Usage
• Customizable Table and Style settings
• Customizable Indicator Settings
• Customizable Time frame of Indicators in Table. Can change to higher or lower TF other than the chart time frame
• Customizable Input symbols. Can modify with the Scripts you want to track.
• The Last row will be the current script viewed in charts.
• Can enable or disable indicators on the chart like ST, SMA, VWAP.
• Strong Volume Indication at bottom based on the average volume inputs for Nifty, Bank Nifty and for other stocks volume > 20 ma(volume)
• Displays bank nifty stocks if Bank nifty is the open chart else it will display top Nifty Stocks.
• This will help to monitor the performance of various scripts.
• Can change the stock list according to usage/Index.
• It will show all the symbols if Additional Symbols is selected.
Buy-Sell Signal
• Volume > Average Volume, it Shows #
• ST – Buy - Price > Super trend (10,2) and vice versa
• SMA – Buy - Price > MA and vice versa
• RSI – Buy – RSI > 50, Sell – RSI < 40
• ADX: Buy - ADX > 25, DMI+ Above DMI - and vice versa
• Previous day High low is not considered for buy or sell score calculation. This is just for additional observation.
• ATR will be highlighted when change > 0.75 of the average true range of daily price.
Strong colours will be shown for respective boxes when some additional conditions satisfy.
Style settings
Dashboard Location: Location of the dashboard on the chart
Dashboard Size: The size of the dashboard on the chart
Text/Frame Color: Determines the colour of the frame grid as well as the text colour
Bullish Cell Color: Determines the colour of cell associated with a rising indicator direction
Bearish Cell Color: Determines the colour of cell associated with a decreasing indicator direction
Cell Transparency: Transparency of each cell

RankDelta - Ranks - v1.0Market Intelligence Summary
Conditions for Buy
VWAP: Price trading above VWAP
Alligator: Price is trading above Lips which is trading above Teeth which is trading above Jaw
ST (21,1): Price is trading above Super trend (21,1)
ST (14,2): Price is trading above Super trend (14,2)
ST (10,3): Price is trading above Super trend (10,3)
RS: Comparison of stocks vs respective index.
If the % change of banks stocks over the given timeframe is more than Banknifty index then it is “Buy” Signal
Similarly, if the % change of IT stocks over the given timeframe is more than NIFTY IT index then it is “Buy” Signal
If the % change of NIFTY constituent (RIL, HDFC) over the given timeframe is more than NIFTY index then it is “Buy” Signal
Conditions for Sell
VWAP: Price trading below VWAP
Alligator: Price is trading below Lips which is trading below Teeth which is trading below Jaw
ST (21,1): Price is trading below Super trend (21,1)
ST (14,2): Price is trading below Super trend (14,2)
ST (10,3): Price is trading below Super trend (10,3)
RS: Comparison of stocks vs respective index.
If the % change of banks stocks over the given timeframe is less than Banknifty index then it is “Sell” Signal
Similarly, if the % change of IT stocks over the given timeframe is less than NIFTY IT index then it is “Sell” Signal
If the % change of NIFTY constituent (RIL, HDFC) over the given timeframe is less than NIFTY index then it is “Sell” Signal

BANK NIFTY Constituents Technical Rating [tanayroy]Banknifty comprises 12 companies listed on the National Stock Exchange of India (NSE). Movement of Banknifty depends on these stocks. The script depicts Technical rating and price change stats of Banknifty constituents.
I have calculated the weight factor using annual floating stock stats available in Tradingview. So, it may differ considerably from the actual weight. It is just for reference.
I have found this useful in my trading.
Please like, share, and comment.

NIKI MSS BANKNIFTYThis is the strategy version of my old indicator NIKI BANKIFTY. It is more suitable for day trading with a 5 min chart. It is more profitable in BANKNIFTY future. It is based on multiple Supertrend, moving average, Donchain channel, and linear regression. The background color indicates the main trend and the color of the candle represents a short-term trend. The label with TA and SL represents more profitable entry positions. The label RE: LE and RE: SE stands for re-entry positions or signals with less accuracy. Consider the direction of the linear regression line to take trades on re-entry positions. The yellow candle indicates the entry and the blue candle represents the target or stop-loss.
The backtest results are based on BANKNIFTY last year's data. It has an initial capital of 100000 and the size of the lot is 1. The target is 0.3% and stop-loss is 1.5%. It exactly not following the stop loss, the trade will exit based on the Donchain channel breakout. It appears on the chart as a blue candle. The commission paid is 20 cash per trade and the slippage is 5 ticks per trade. Some of the Indian broker's commission is only 10 cash per trade. Adjust the commission as per your broker. Trades are conducted based on the intraday time in India set from 9.20 am to 2.25 pm. All positions will get square off at 3.00 pm. It will execute a maximum of 4 trades per day. All other parameters are suitable for Robo trading with Indian stock brokers.
Contact us using the link given below to obtain access to this indicator.

BANKNIFTY Auto-Trading Indicator based on Market InternalsNSE:BANKNIFTY
Dear Fellow Traders,
This indicator for BankNifty INTRADAY trading is based on Market Internals - Advance/Decline Volume and TICK
These Market Internals, also known as Breadth Tools helps in identifying the overall market sentiment.
Just doing some technical analysis on Price action doesn't provide good results.
Price action along with Volume gives a meaningful insight and helps in improving the accuracy.
But simple VOLUME information is not sufficient to take a directional view on the markets. A segmentation of POSITIVE and NEGATIVE volume gives a clear picture of the symbol movement.
We can get the volume information FOR ANY STOCKS anywhere. But, VOLUME INFORMATION FOR AN INDEX ALONG WITH POSITIVE AND NEGATIVE VOLUMES are not available in normal trading platforms. And this tool provides the exact feature.
In a nutshell,
1) THIS TOOL PROVIDES BUY/SELL INDICATIONS on the BANKNIFTY based on the underlying stocks' PRICE AND VOLUME
2) THE VOLUME INFORMATION IS BIFURCATED INTO POSITIVE AND NEGATIVE VOLUME , WHICH HELPS IN DECIDING THE MARKET DIRECTION.
P.S: This is an Invite-only indicator. Inbox me for getting access.

Aditya Banknifty-2 IndicatorThis indicator is designed for Banknifty which is traded on NSE(India). It works best in 1-M and 5-M time-frame. You can always experiment with any other time-frame with various combinations of settings.
Green Line- Buy Trigger Line
Red Line- Sell Trigger Line
Period: No. bars for look-back period.
Trade Trigger Type:
1. ATR Based – Trade will be initiated based on ATR values.
For 1M time-frame: Trigger ATR Bars=7
ATR Multiplier = 3.1
For 5M time-frame: Trigger ATR Bars=7
ATR Multiplier = 0.5
2. Fixed - – Trade will be initiated based on particular fixed value.
3. % of Close - Trade will be initiated based on % of Close of script.
Take Partial Profit: Whether to book partial or not.
Partial Profit Points: It always better to book partial profit after getting into the trade. We can book 1 quantity after our partial profit target is hit by making Order Size=2 and let the remaining quantity in the trade until the reversal of trend.
Disclaimer: This script/strategy is for educational purpose and individual use only. The author of this script/strategy will not accept any liability for loss or damage as a result of reliance on the information contained in the charts. Please be fully informed regarding the risks and costs associated with trading the financial markets.
This is a premium indicator so send me a private message for access.
Use the link below to obtain access to this indicator.
