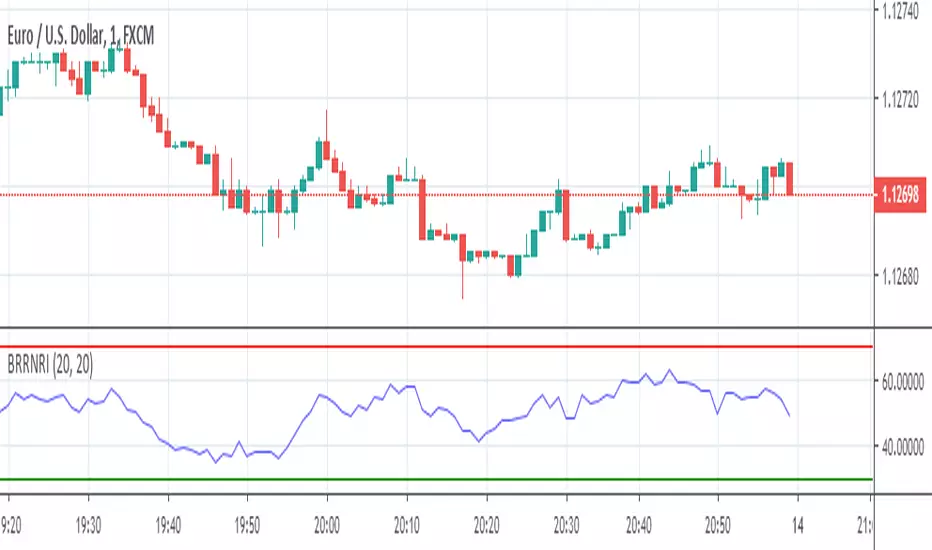
BINARY RR NON REPAINTING INDICATOR
Hello Binary Options traders, do you worry about loss in binary? now no need to worry, search my page in Fb, named "IQ Option Traders PK " ,like my page and send me a message, i will send you details of my strategy free of cost.
or comment below i will respond you.
thanks
Binary
yutas_BOindicator2βVer1.0
High-low sign indicator for binary option only. (β version)
バイナリーオプション専用ハイローサインインジケーター。 (ベータバージョン)

yutas_BOindicator_β1Ver1.0
High-low sign indicator for binary option only. (β version)
バイナリーオプション専用ハイローサインインジケーター。 (ベータバージョン)


SlingerMust be added an Ichimoku Clound with the following entries
Conversion Line Periods __4
Base Line Periods _______ 26
Lagging Span 2 Periods___ 52
Displacement __________ 26
Turn off from chart
-Conversion Line
-Base Lina
-Lagging Span
Must add 1 EMA 25
Instructions, USE FOR BINARY AT TRENDING CHARTS
5MIN
BUY
Price must be OVER Ichimoku Clound, EMA 25 and pulled back to the GREEN lines
SELL
Price must be BELOW Ichimoku Cloud, EMA 25 and pulled back to the GREEN lines
ENTRY
As it comes back moving up or down after touching the green line(s)
I may update the script later and add all at the same so you don't have to add the EMA 25 and the Ichimiku Cloud

UltraInstintoTraderthe ultra instinct trader is the most powerful tool basedin the ultimate form of goku, u can use this script to do very fast trading also binary options and get a lot of profitttt


NADEX Binary OptionsAlright guys, I finally nailed NADEX Binary options!
You can use my indicator for any timeframe.
I use primarily it for 5 minutes NADEX binary options.
How do you use it?
============================
1. Watch out for a gray arrow on one minute chart, that tells you that there might be a chance of reversal.
2. Once you get a gray arrow on the chart, wait for red or green arrows depending on trends.
3. Once you get a red/green signal arrow, check following two things:
First, blue circles lines are flat or not too slanted.
Second, red line is flat or little bit slanted.
4. If all the above conditions, met then put the order in on NADEX 5 minute binary options.
Red arrow => SELL signal
Green arrow => BUY signal
Money Management:
1. I enter a pending order at $35 ITM for sell orders and $65 for buy orders. (if you loose, you loose $65).
2. Once the order is filled, I do not wait for expiry. I exit out trend if I make 25 dollars. I put take profit orders at $10 for sell orders and $90 on buy orders.
That's it!
Email me at bhaveshjpatel2003@gmail.com to get an access to my system.

yutas_BOindicator2Ver .1.0
High-low sign indicator for binary option only.
バイナリーオプション専用ハイローサインインジケーター。
yutas_BOindicatorVer .1.0
High-low sign indicator for binary option only.
バイナリーオプション専用ハイローサインインジケーター。

B3 FisherTransform TraderB3 Fisher Transform Trader ~ As you may have found, Fisher Transform (FT) is not an easy beast to tame. However, I have never seen an indicator so consistently early to a move, so, I had to pry into it some more. I tend to stick with indicators that work on many symbols and time-frames, but FT isn't one of them. For starters, I only had a small amount of success in back-tests and only with stocks not futures. I did find however that when set to 9-10 and tightly trailed with a signal average and then put to a intermediate chart like 2h to day bars, it seems to have a nice sweet space in back-tests. I found this to work in multiple platforms, and after plenty of testing, I came up with a few personal tweaks to the indicator. Then walking forward the tests have played out like the back-testing, which is key!
Each symbol you trade will have a sweet spot bar interval in that intermediate area, so long as you keep the input setting to 9-10 for the FT and 2-3 for the signal average length. You are welcome to test well beyond these parameters . :)
Here is a quick view of the success the system has had trading AAPL in binary long or short at all times fashion over the last 10 years.
virtuosotrader.files.wordpress.com
~B3

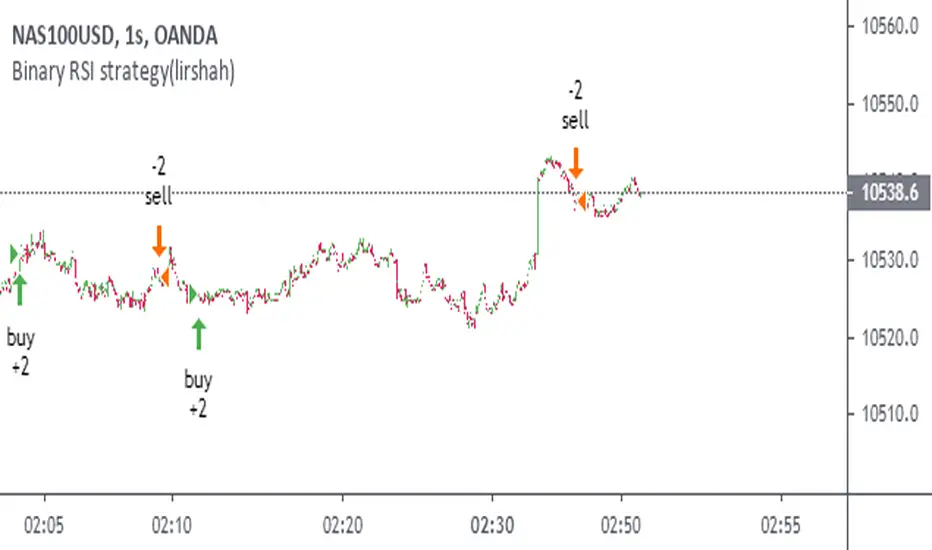
Binary RSI strategy(lirshah)Binary Rsi is one of the greatest strategies published by lirshah programming team.
it has a good operation on H2 ,H1, and M15 charts.
its better to say that this strategy can act such a money machine and
has a good result on almost all crypto currency pair:
LTCUSD – ETHUSD –BTCUSD- XBTUSD - ZECUSD –ETHBTC and …
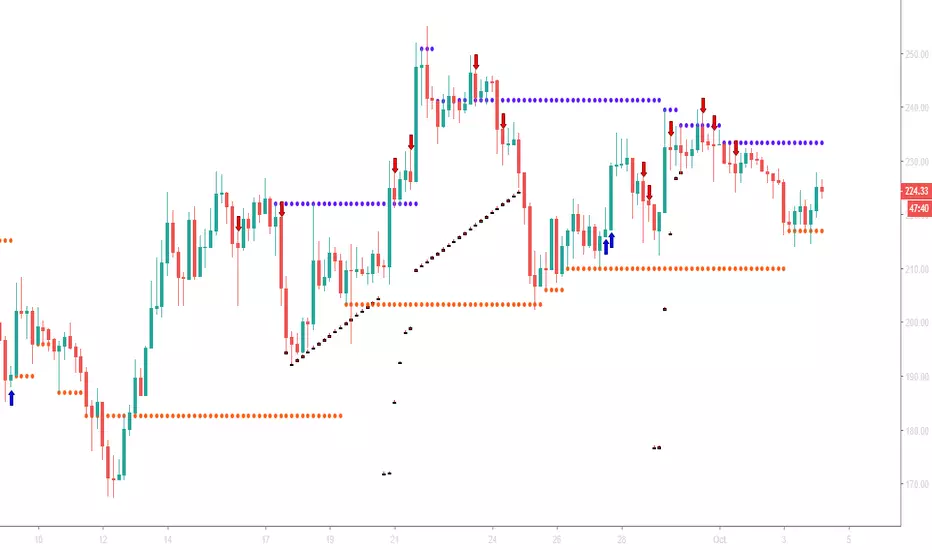
TradeMiner S9This is the first TradingView indicator EVER to include dynamic support and resistance lines from upper or lower diagonal highs and lows in real-time.
Note: This indicator has been built using Pinescript V2
Like and Share for access and more awesome indicators!
A blue arrow appears only in a red bar and under these conditions:
Closing Score Trigger (CS < 50)
On Balance Volume, Accumulation/Distribution, and Chaikin Money Flow Combination (OBV/AD /CMF > 0)
Chaikin Money Flow (CMF <-0.05)
A blue horizontal line will be drawn when CMF > 0.05 indicates a sale of the position.
A red arrow appears only in a green bar and under these conditions:
Closing Score Trigger (CS > 50)
On Balance Volume, Accumulation/Distribution, and Chaikin Money Flow Combination (OBV/AD/CMF < 0)
Chaikin Money Flow (CMF > 0.05)
A red horizontal line will be drawn when CMF <-0.05 indicates a sale of the position.
A new condition called " leaniency " has been added that allows all these conditions to be fulfilled within multiple bars so that the occurrence occurs more frequently. This will result in more signals appearing. Setting leniency to " 1 " means that all four conditions must occur in a single bar, while " 5 " means that all four conditions must occur within 5 bars.
Find lifetime access to the indicator here: www.kenzing.com
BTC

binary RSI(lir)
binary RSI oscillator is a powerful oscillator which shows the major trend according to momentum and volume

binary RSI(lir)binary RSI oscillator is a powerful oscillator which shows the major trend according to momentum and volume,

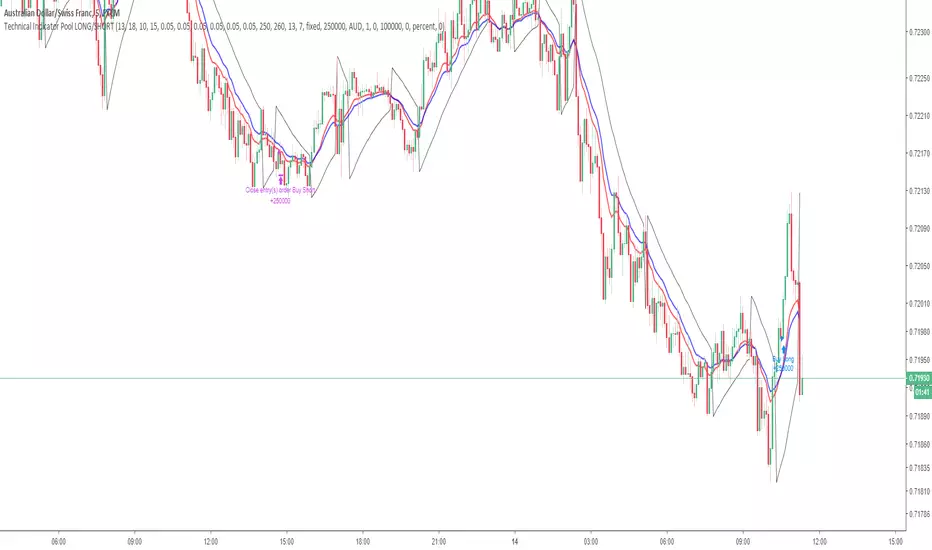
Technical Indicator PoolThis is for Bundle holders who want to use the Technical Indicator Pool for scalping binary options.
Understanding the Technical Indicator Pool
The Technical Indicator Pool is a strategy that operates on the premise that when many technical indicators project the same sentiment, they are concurrently more precise. The technical indicator pool contains five indicators
1. Small MACD Moving Average (SFMA) (10,15)
2. Large MACD Moving Average (LFMA) (13,18)
3. Parabolic Stop and Reverse (PSAR) (0.05, 0.05, 0.05)
4. Relative Strength Index (RSI) (14, 70, 30)
5. H/L Pivot (13)
When all five indicators project the same sentiment within a defined period (known as BarPeriod), an order is placed in the direction of sentiment.
Note:
Due to the nature of the indicator pool, such as the moving averages within the MACD and RSI as well as the High/Low Pivot, false positives may occur before the bar has closed within the time stamp.
This point of reference is to be used in combination with an arsenal of trading tools and should not be used as direct investment advice.
Option strategies should always include stop losses.
This strategy operates using a lot size of 2.5.
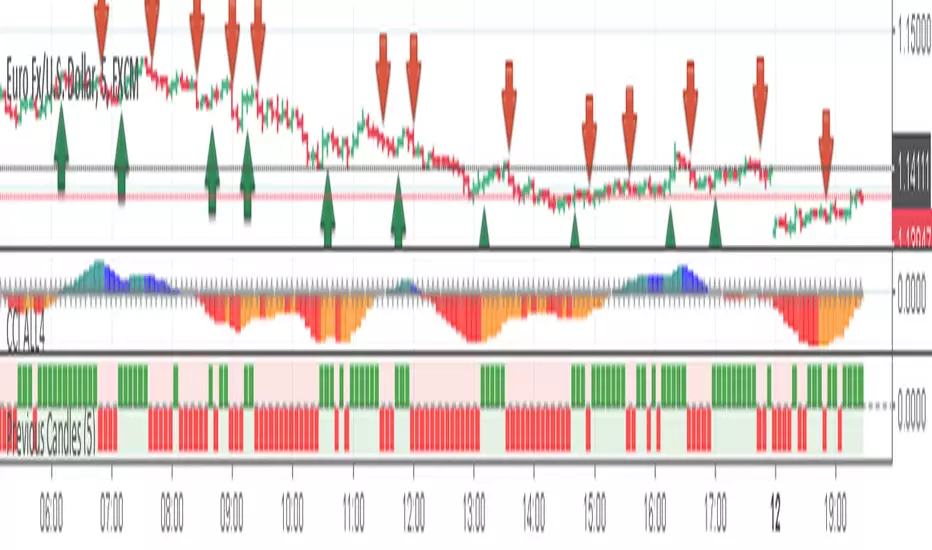
Previous CandlesThis is an indicator based on the average of the maximum and minimum of the past candle, and there is another strategy that makes the filter, it is very good for binary options, if you combine our indicator CCI and All4 it gets even better!
Currency: Any pair.
TimeFrame: 5m
Execute order: You can enter 1 minute or 5 minutes.
In the graph below the ICC, you can see the green and red squares, it works as follows.
Before giving any input you have to enter the change of a color.
Example: It was red and now it's green, so you could give the entry, but you must have at least 3 squares of red before, if only 1 squared has appeared, the hit percentage will be low!
The CCI indicator is for confirmation.
Any doubt I am available!
Note: This indicator does not make magic nor is it a holy grall, it is only an indicator to aid in binary operations!