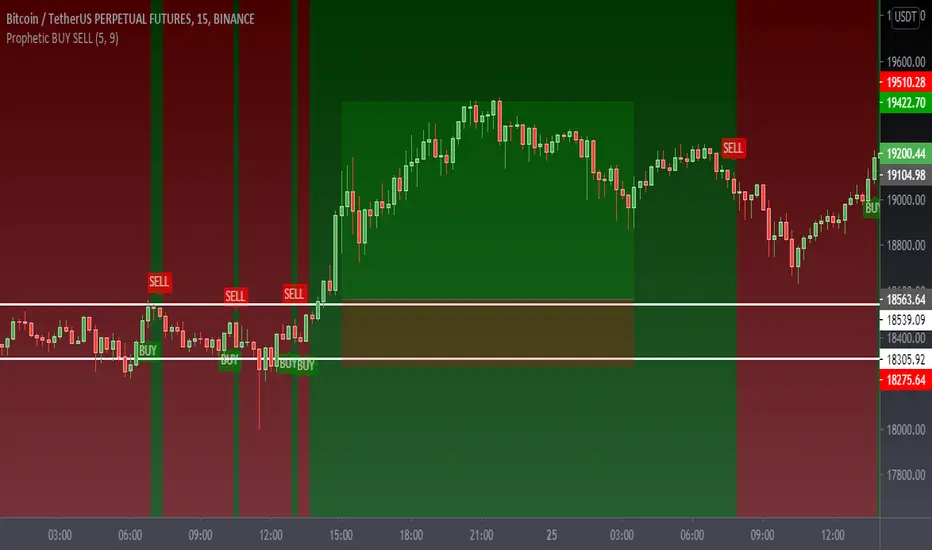
Prophetic BUY SELL IndicatorThis premium indicator will help you to do quick scalping on Cryptocurrencies, Forex, and Stocks.
This indicator is very simple to understand.
Green BUY Alert - Buy Signal Market is up
Red SELL Alert - Sell Signal Market is down
Caution:- Do not use it during market being choppy or sideways
Once the BUY signal appears the background changes green and same with SELL it turns red
can change the color according to requirements
It also has a moving average which also changes the color as the candles close above the MA or the below Default color are green and red
Please Like Share and Follow and if required please contact:- @mobudd (TELEGRAM)
or Ping me on trading view
Guys, It takes effort so please do not ask for free access.
You're always welcome to share any type of suggestion & feedback.
Bitcoin (Mata Wang Kripto)
[5F] Total circulating Bitcoin-═════════════════════════-
📋 Description :
This script displays several informations about Bitcoin :
the maximum number of Bitcoin
number of mined BTC
number of unmined BTC
calcul them in %
shows the previous halving date
📆 Note : need to be in dayli resolution or higher
Thanks to all Pinecoders who share their work with the community.
-═════════════════════════-

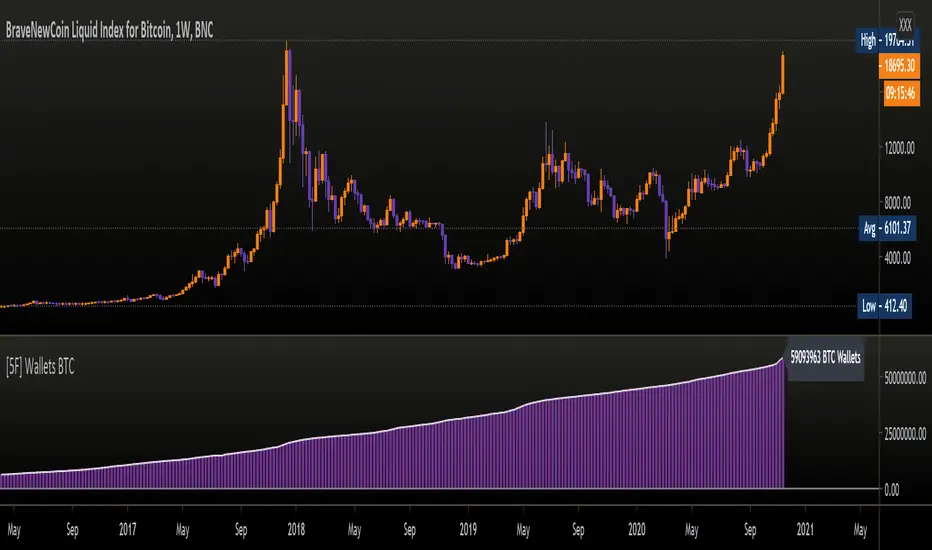
[5F ] Number of Bitcoin wallets-═════════════════════════-
This is a simple script that displays the total number of Bitcoins wallets based on the data provided by Quandl.
Use it in dayli resolution minimum
Refresh every day
Thanks to all Pinecoders who share their work with the community.
-═════════════════════════-
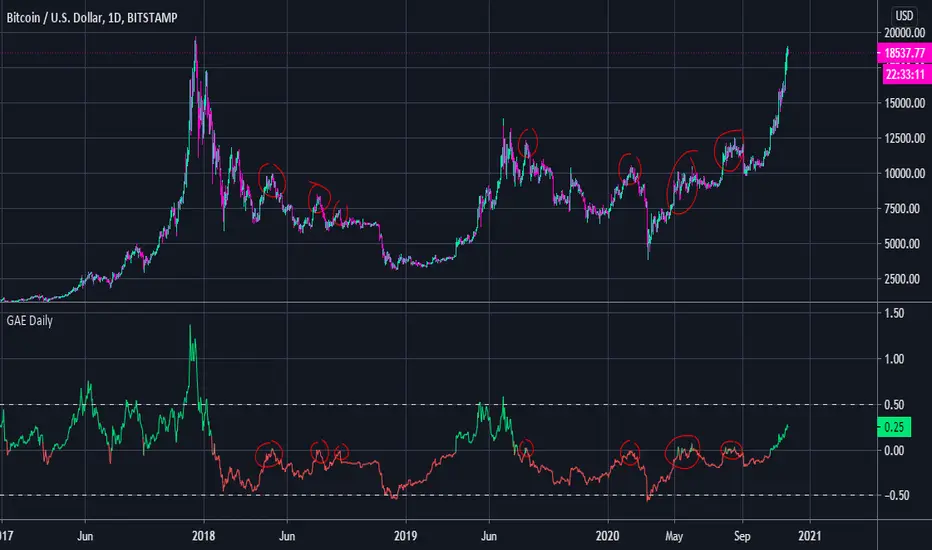
General Accumulation Evaluation BULL or BEAR Daily TrendGeneral Accumulation Evaluation by Lordchicken aka Chikun
This indicator is ONLY useful on the daily time frame and ONLY on BTC.
It will show you the general trend of BTC.
Basic:
X > 0 = Bullish trend
X < 0 = Bearish trend
X > 0.5 = Overbought
X < -0.5 = Oversold
Advanced:
If X < 0 and tries to go above 0 that's a good place to short
The end of a Bull/Bear trend is often shown with a strong reaction of X going above/beneath 0.
[5F] Aggregated Volume Spot BTC 10 Exchanges-══════════════════════════════-
10 exchanges aggregated spot volume of Bitcoin.
You can choose which exchanges to display.
Each color characterizes an exchange.
Sorry for my bad english
Note : The list of exchanges in the infopanel is always the same, even if you disable exchanges. If I have the time, I will try to fix this.
Here are the listed exchanges :
- Okex
- Huobi
- Binance
- Bitfinex
- Bitstamp
- Coinbase
- FTX
- Kraken
- Gemini
- Phemex
Thanks to all Pinecoders who share their work with the community.
-══════════════════════════════-

GBTC & BTCE Premium Indicator- This indicator illustrates the premium of GBTC and the European equivalent, BTCE. Relative to the spot price of Bitcoin
- It represents the premium investors are willing to pay to be able to gain exposure to Bitcoin . Whilst holding them in an investment vehicle such as a 401k or an ISA.
- The premiums can be plotted. GBTC vs BTCUSD and BTCE vs BTCEUR
OR
- The "real price" of BTCUSD , GBTC and BTCE (denominated in USD) can be plotted against each other

Percent Drop from Highest HighBuy and hold investors may decide to use trailing stops to protect profits and capital from market crashes, especially during bull markets.
The purpose of this indicator is to hep investors to identify a location to place them. The indicator plots the highest high from 'x' bars ago. It then plots a trailing stop loss 'y' percent below that line.
The indicator enables its users to input different 'x' and 'y' values to observe what they think works best for them in different markets.
Users might choose to pair the indicator with trend confirming indicators, such as moving average cross overs, to determine that the market is trending and not ranging.
There is no magic in this indicator, only maths. Like every indicator, it has no ability to predict anything. Just because the market is doing one thing now, it might do something different later. The past does not equal the present nor the future. Make your own decisions and be responsible for them.
All the best to you and your family.

S2F Price LevelsThis is the indicator that plots Bitcoin's Stock to Flow model price and its significant levels.
Grey: S2F price
Green: S2F bottom (S2F multiple of 0.5)
Blue: S2F mode (S2F multiple of 0.67)
Red: S2F top

MACD with 3 strategiesMACD WITH 3 STRATEGIES
- Macd line change colour when cross the signal line
- Background Color change colour based on a moving average, on settings the value of the moving average can be changed 50,100,150,200
- Strategy one based on Macd lines with bar changing colours
- Strategy two based on Macd lines but with a different method
- Strategy three based on two other trending indicators
This indicator can be used to spot trends and changing of direction of the market and with the bar coloured its easier to identify them.
The strategy one can be used as confirmation of a trend or as changing direction integrated with other indicators like Rsi , Stochastic, Supertrend , Bollinger band, with ema option mode works better.
The strategy two can be use together with the back ground colour: When is red and the candles are red can be identified as strong drown trend.
When is green and the candles are green can be identified as strong up trend.
The strategy three can be used after checked the strategy two for more confirmation for a trend.
VERY IMPORTANT WHEN YOU TRY A NEW STRATEGY TEST IT IN A DEMO ACCOUNT FOR AT LEAST 3 MONTHS
Every donations will be devolved to cancer research and you ll have one month free trial.
If you want to purchase this indicator 30% will be devolved to cancer research.
Please leave a comment or message me if you want you have two weeks trial.
Enjoy!
Pixel ArtHaving Fun with Arrays.
I couldn't load all of the images into their respective arrays without getting an "Internal Pine error" So I commented out some of them. You can pop them back in, but make sure to disable another in its place.
Vader
Pine Logo
&hearts
Bitcoin
pAulse

Bitcoin Top Finder by DataDaterBitcoin Top Finder is an indicator that detects the absolute top of BTCUSD in each bull cycle (red line). It is also helpful in detecting bottoms of cycle (blue). It is based on cost of electricity and mining hash rate.
If you'd like access to this script, please send me a direct message.


Multi Time Frame Buy&Sell V4.0 [ALERTSETUP]Hi guys,this indicator Developed for Intraday and multi Time Frame Trading. Note: Invite only Script.Request to me Access permission to test this.
*** THIS IS STUDY VERSION ***
Time Frame : can use for 15 min / 30 min / 1h / 4h time
15 min configuration is best result for bitcoin and ethereum .
This can be used : Crypto Currency/ Bitcoins / ethereum ,Forex,currencies ,Index ,Commodity Gold / silver , Oil Market and in Equity / Futures
ETHUSDT Futures 15min
BTCUSDT Futures 15min:
GOLD /USD FOREX 15min:
HOW IT WORKS:
this indicator analyze EMA&SMA support and resistance then combine with pivot point and fibo levels is used to calculate the signals.and finally show entry label on
chart with target point and stop loss
HOW TO USE:
Creating a signal is as simple as adding the indicator called to your chart(buy or sell)label and background color change ( green=buy / red = sell)
green line is target and black line is stop loss.
in top of setting page you can see noise filter option . that can change it to get better result and reduce noise. in setting can set 3 target level and stoploss
NOT:all information show to info panel in chart.
strategy tester : enabled .All you can test this in live market in any segment.
NOT: can to change noise filter in setting setup until to get best result.
Choose any Date Month Year to Current Date and check the results below in the Strategy Tester.
REPAINT/NO REPAINT : No Repaint ,entery labal(buy or sell) and Background Color wont change. In the current candle position wait for the candle to close to see the
stability.
"Set alert": Select "Once per bar close" for your alert options.
There are 5 alerts:
- BUY
- SELL
- BUY OR SELL (for free TV users)
- take profit
- stop loss
To Get access - Send me a private chat message in tradingview.com to get access.Or request in comment section below.
Review and Feedback.Thank you!
Any issues report to me to Fix.Thank you!
Use the link below to obtain access to this indicator:

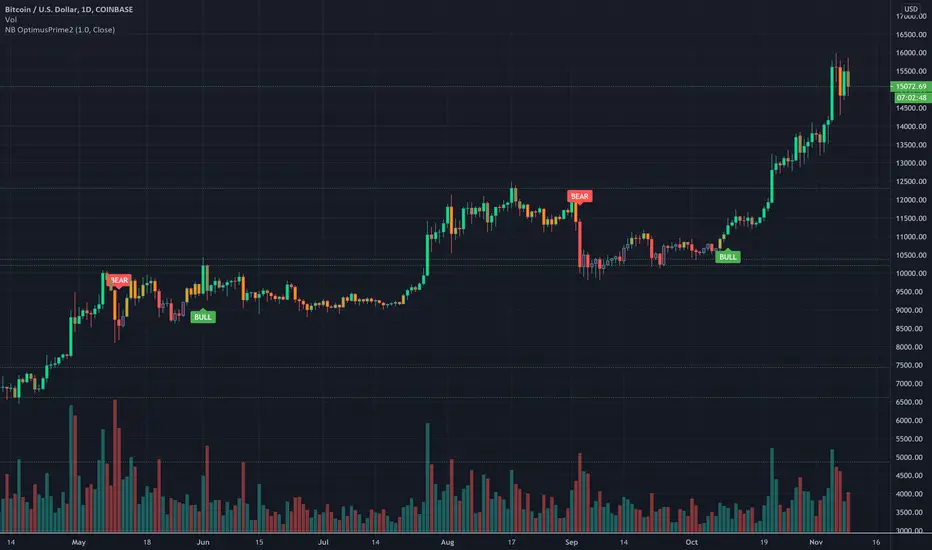
NB OptimusPrime2Hello Everyone,
Welcome to NB Optimus Prime 2.
This is an educational indicator that makes two colorful calls in your chart thus :
Red = Bear
Green = Bull
The calls are meant to indicate potential downtrends and uptrends respectively.
The signals are made based on aggregated Index prices and moving averages which are then smoothened out. Volume is used to gage momentum of the trend which is then shown by colors on the candle stick. This indicator is best used in combination with other traditional indicators i.e MACD , RSI and other tools that are available on TradingView.
Even though this indicator was designed with Cryptocurrency in mind, it can also be used for Stocks and Forex. I created this for my crypto community as a way to introduce them to trading with indicators.
It should be noted that this indicator should not be considered financial advice in any way or form. This is just an indicator. Please use it responsibly.
PM me to obtain access to this indicator and I will be happy to help you.
BTC & ETH Alert SystemWith Tradingview's free plan, only one alert is allowed. The purpose of this indicator is to allow for two alerts--one for BTC and one for ETH.
How to use the alert system:
1. Set the desired value for BTC and ETH that you want to be alerted for
2. Set an alert on the indicator by clicking the three ellipses and then "Add Alert"
3. Set the alert to go off if the value of the indicator is greater than 0.
The example is of BTC using an alert of $10,000 and an alert of ETH at $2,000 (untriggered)
The script can be easily modified to be used for different assets

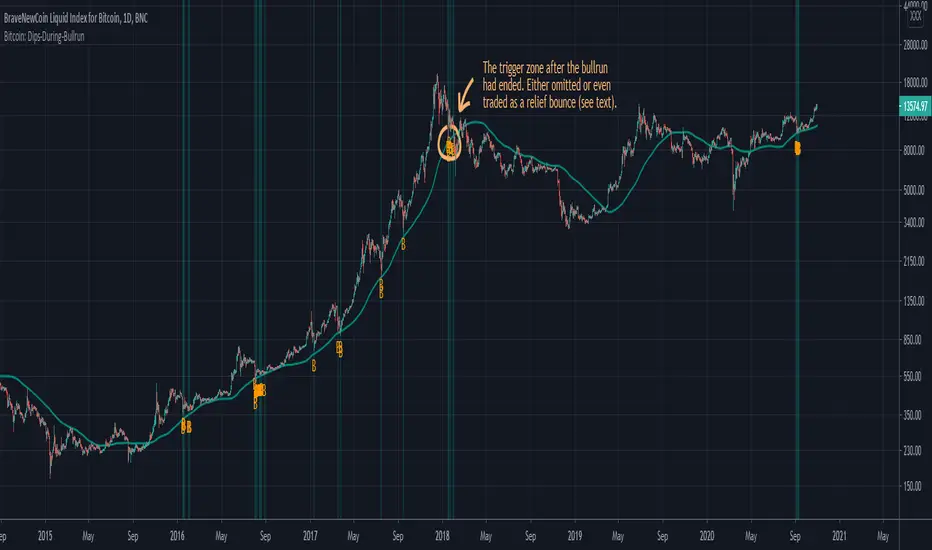
Bitcoin: Dips During BullrunThis script is designed to show dips during Bitcoin bull markets, assuming that Bitcoin finds its local low points in that market phase mostly around the MA(20W=140D) while having a low RSI value. Some other condition is also used to really only trigger after a distinct uptrend has begun. This indicator should only be used on the daily (D) timeframe, and preferably for the BraveNewCoin Liquid Index for Bitcoin (BLX). It's mostly for convenience as people could also just track the MA and the RSI closely, and additionally watch for evidence of a starting bull market. It is yet to be seen if Bitcoin really finds its local bottoms in this bull cycle based on those rules, but the latest price action looks promising. The indicator triggered a few weeks ago, so that the start of the next parabolic run of Bitcoin might be just around the corner.
Note that this algorithm is rather rudimentary, and it will also trigger in one more zone after the bullrun has already ended (marked on the chart above), as the first retest of the MA(20W) shows similar behaviour in the RSI as during bullrun dips. However with other indicators DeanTrader provides (as e.g. the "Bitcoin: Price Action Integrals", and the "Bitcoin: Top & Bottom Mini-Algo" indicators), it should be possible to determine when the bullrun has roughly ended to then discard this indicator until the next bull phase starts sometime in the future. Also some people might even want to trade the relief bounce based on that after-bullrun trigger.
You can hide the MA, as well as the green overlay and/or the plotted "B"s, if you only want to see some part of this indicator on your chart.
For access please contact me via DM on TradingView or on Twitter (linked on my TradingView profile and in my signature).
TBT Stop Loss Hunting AlertPurpose:
The TBT Stop Loss Hunting Alert is a simple early warning system that indicates when Bitcoin could have unexpected volatility (in either direction) within a 24 to 48 hour time frame as you can see above (indicated by the red bar/column in the indicator lane). By knowing when there could be possible upcoming volatility for the price of Bitcoin, traders can take preventative measures to protect open positions to preserve profits.
Time Frame:
While you can view this indicator on any time frame, it was originally created with the 6-hour time frame in mind. Because of this, the indicator can be set to "same as symbol" (the indicator will adapt to any time frame you use) or "6 hours" (the original and intended time frame). Please understand that the alert will show "noise" (false positive signals) on faster (lower) time frames. This is another reason to keep the indicator on the 6-hour time frame in its settings.
Metrics:
The TBT Stop Loss Hunting Alert looks at sudden/unexpected changes in price action, volatility, and volume.
Realistic Expectations:
While this indicator is effective in alerting users when there could be sudden volatility for Bitcoin, note that there is no way to know which way Bitcoin will move after the alert is triggered. The frequency of alerts is few and far between, but in a way this is a good thing. When the signal is triggered, it is a great early warning system to remember to be careful for the next 24 to 48 hours.

TBT ForecasterThe TBT Forecaster is a visual representation of the "weather forecast" for the crypto market, mainly Bitcoin and ALT coins.
Purpose:
The reason behind creating this indicator is to help give crypto traders a sense of what to expect in crypto currency markets. In general, crypto markets (ALT coins) are extremely dependent on the price action and sentiment of Bitcoin. By knowing what to expect for both BTC and ALT markets, crypto traders will have an edge on other traders by:
knowing when it's a good time to run BTC or stable coin pairs for bots on 3Commas
knowing when the ALT market is in a Bullish or Bearish mood
knowing if we're in a true ALT season or not
knowing if they should be focusing more on active trading on the BTC or stable coin market
Time Frame:
The TBT Forecaster can be viewed on any time frame, but it was originally designed to work off of the 6-hour time frame. Note that faster (higher) time frames can make the tool somewhat unreliable since faster (higher) time frames are subject to more sudden, volatile movements compared to the 6-hour or Daily time frames. To help users of the TBT Forecaster keep a healthy perspective, the indicator can be set to "same as symbol" (the indicator will adapt to any time frame you use) or "6 hours" (the original and intended time frame).
Metrics:
The two lines of the indicator represent Bitcoin (top) and ALT coins (below). The TBO Forecaster uses information derived from the price of Bitcoin, Bitcoin price volatility, moving averages, ATR (Average True Range), Bitcoin Dominance, and the ALT coin indexes (TOTAL2 and OTHERS). All of these metrics are combined and weighted into a system that quantifies the market sentiment for BTC and ALTs.
Sentiment:
The TBT Forecaster shows a gradient of market sentiment, from Bearish to Bullish. These market sentiment labels consist of a variety of different metrics that have to do with volume, price action, and several indices. The full gradient of sentiment is:
Bearish
Weak Bearish (ALT line only)
Neutral
Weak Bullish
Bullish
Realistic Expectations:
Note that it is impossible and unrealistic for the ALTs line to represent every single ALT coin/token/chart/symbol on every exchange. In my experience, there are always good charts to trade no matter what Bitcoin is doing. However, if we as traders know that ALTs are Bearish, then we can focus our efforts on trading Bitcoin (or just staying out of the ALT market until conditions change).
Use the link below to obtain access to this indicator

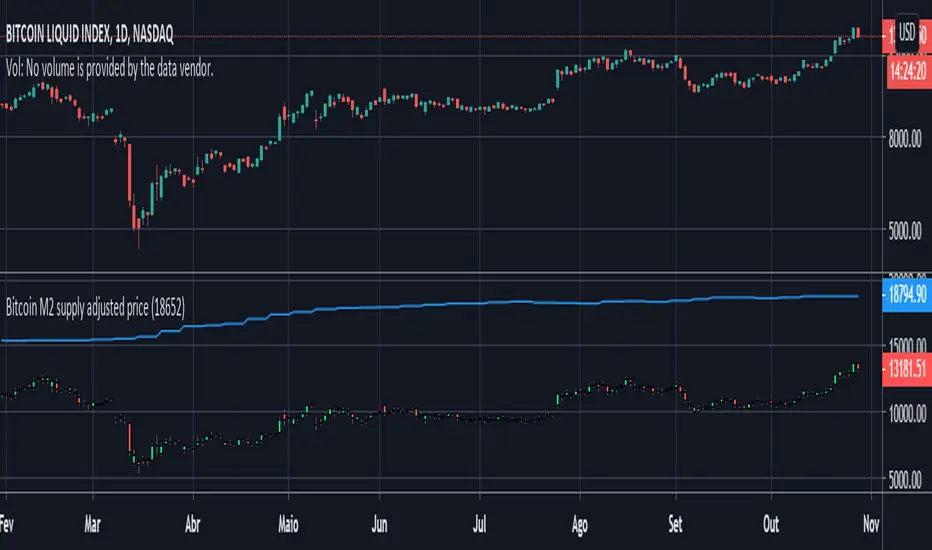
Bitcoin M2 supply adjusted priceThis script plots bitcoin candles adjusted by M2 supply (blue line), helping the trader to obtain insight of new support/resistance levels adjusted by M2 supply.
Note: As it was not possible to make the price adjust automatically by the last M2 value (pinescript limitation, I guess), the input parameter "M2Last" must be updated manually observing the last M2 value in blue curve.
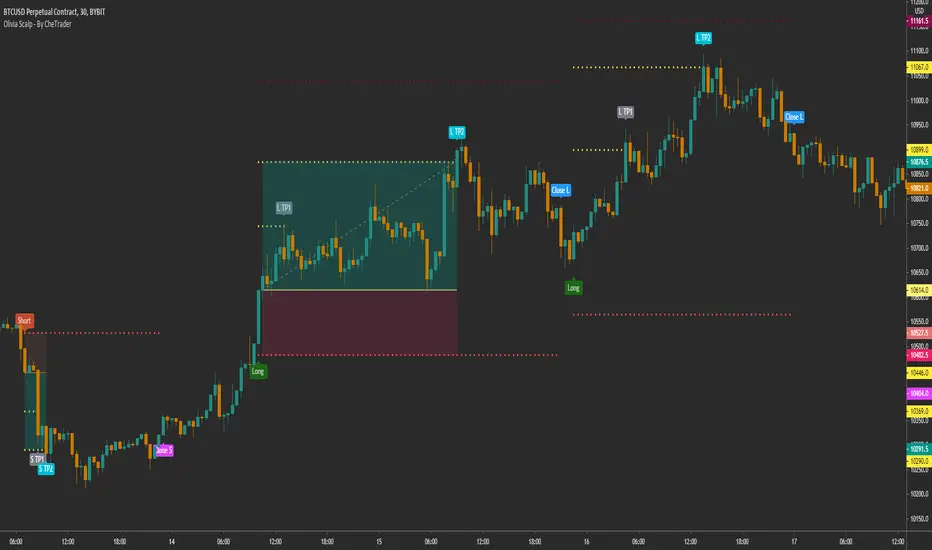
Olivia Scalp - By CheTrader
This is a complex strategy for Scalp that is fully configurable and can be automated
This script uses a combination of ma to detect the trend at a higher time frame, which can be defined by the user, as default set to 1D and 1M.
Triggers for long and short are given in a lower time frame, for example 30 minutes and are given by a combination of factors and oscillators. These include RSI, ADX, DMI
The script includes everything needed to follow the trade according to the habits of the trader.
This includes the option to use Take profit and Stop loss based on ATR that you can configure with the RR you like.
Similar to the risk-reward tool in tradingview.
You can also define a stop and take profit based on a percentage from the entry and also use a Trail stop, to finish the position when it is reached.
Each take profit and stop loss has a customized alarm so you can automate each action.
Also included is the option to use "advanced alerts"!
This is: You define how many seconds before you close the candle the alarm will be activated in TradingView. Very useful if you are going to automate, so that your alarm arrives just in time to your exchange.
Included:
Different trade entry options
Different forms of Take profit, included:
Take profit on squeeze candles
Take profit based on Risk-Benefit (RR)
Take profit a pre-determined %.
Different forms of Stop Loss, including
ATR-based stop loss
Trail stop loss (with option to use a trigger)
Stop loss a pre-determined %.
Contains a Risk Management section
May use a volatility filter
Statistics panel for backtest
Advanced alerts
As default is configured for BYBIT:BTCUSD 30 minutes
For access you can send a message or consult in my social networks.
Links in my tradingview signature (below).
Total Inflation ModelMeasure of the total economy wide inflation of the US Dollar.
Total Inflation = growth rate of money supply / economic output

[blackcat] L1 Bitcoin Guppy Whale Pump Dump OscillatorLevel: 1
Background
The Guppy Multiple Moving Average (GMMA) is a technical indicator that identifies changing trends, breakouts, and trading opportunities in the price of an asset by combining two sets of moving averages (MA) with different time periods. There is a short term group of MAs and a long term group of MAs.
One of the biggest differences between cryptocurrency and traditional financial markets is that cryptocurrency is based on blockchain technology. Individual investors can discover the direction of the flow of large funds through on-chain transfers. These large funds are often referred to as Whale. Whale can have a significant impact on the price movements of cryptocurrencies, especially Bitcoin . Therefore, how to monitor Whale trends is of great significance both in terms of fundamentals and technical aspects.
Function
L1 Bitcoin Guppy Whale Pump Dump Oscillator is innovative because it was moved from main chart to aux chart and the input source of Guppy moving average was changed in to bias rate of key EMAs. This makes it work as a Guppy oscillator. This Guppy oscillator was designed and optimized to detect whale pump and dump behavior for BTCUSD or BTCUSDT trading pairs. When whale pump is detected, yellow candles appear; when whale dump is detected, fuchsia candles appear.
Key Signal
di,d1~d8 ---> Guppy oscillator lines
pump --> whale pump detector
dump --> whale dump detector
Pros and Cons
Pros:
1. easy observe price trend
2. it detects whale pump and dump
Cons:
1. no explicit entries are disclosed
2. only optimized for Bitcoin usd/usdt trading pairs
Remarks
Courtesy of @LunaOwl " Rainbow Color Gradient" for colorful Guppy oscillator lines in this script
Readme
In real life, I am a prolific inventor. I have successfully applied for more than 60 international and regional patents in the past 12 years. But in the past two years or so, I have tried to transfer my creativity to the development of trading strategies. Tradingview is the ideal platform for me. I am selecting and contributing some of the hundreds of scripts to publish in Tradingview community. Welcome everyone to interact with me to discuss these interesting pine scripts.
The scripts posted are categorized into 5 levels according to my efforts or manhours put into these works.
Level 1 : interesting script snippets or distinctive improvement from classic indicators or strategy. Level 1 scripts can usually appear in more complex indicators as a function module or element.
Level 2 : composite indicator/strategy. By selecting or combining several independent or dependent functions or sub indicators in proper way, the composite script exhibits a resonance phenomenon which can filter out noise or fake trading signal to enhance trading confidence level.
Level 3 : comprehensive indicator/strategy. They are simple trading systems based on my strategies. They are commonly containing several or all of entry signal, close signal, stop loss, take profit, re-entry, risk management, and position sizing techniques. Even some interesting fundamental and mass psychological aspects are incorporated.
Level 4 : script snippets or functions that do not disclose source code. Interesting element that can reveal market laws and work as raw material for indicators and strategies. If you find Level 1~2 scripts are helpful, Level 4 is a private version that took me far more efforts to develop.
Level 5 : indicator/strategy that do not disclose source code. private version of Level 3 script with my accumulated script processing skills or a large number of custom functions. I had a private function library built in past two years. Level 5 scripts use many of them to achieve private trading strategy.

Ultimate VWAP Bands- Ultimate VWAP Bands is a script that helps to decide and further clarify areas of oversold and overbought conditions.
- For example, when the price is in the lowest band it is extremely oversold relative to the VWAP . Hence it should be considered a good place to buy with a high risk to reward payoff.
- Each band is set at a fixed offset away from the VWAP . The "VWAP Band Multiplier" adjusts this and is a key part of the script. This allows the indicator to be adjusted based on the assets volatility . For example, with Crypto. A multiplier of 1 would be strongly advised. Whilst a multiplier of 0.1-0.25 would be useful for currency pairs.
- This indicator can be used for all manners of trading. However, it is most effective when used for scalping and swing trading.
