Crypto Multi Exchange Volume (CMEV)Crypto Multi Exchange Volume (CMEV) aggregates and plots trading volumes for supported cryptoasset pairs over multiple different cryptoasset exchanges. For developers looking for more information and for those who want to compile their own version of CMEV, please check out my GitHub (jakobpredin/crypto-multi-exchange-volume).
Configuration
CMEV comes with two configurable settings - whether base volume or quote volume is plotted and the length of the volume's EMA. By default, the base volume is used for plotting and the length of the EMA is set to 12 periods.
Use cases
The indicator was primarily developed in order to be able to chart using the trading pair with the longest available trading history. Due to the fast-changing preferences of where cryptoassets are traded, volumes tend to be very inconsistent and can give a distorted picture of a pairs history. For illustration, check out the SC-BTC pair from Poloniex using their native volume and compare it to the CMEV volume.
The other use case is to be able to spot divergences in volume. A great example here is bitcoin's 2019 rally where volumes from derivatives exchanges are at all time highs but volumes from retail/spot exchanges are not.
Supported exchanges
CMEV currently supports asset pairs from the following exchanges:
Binance
Bitfinex
Bitstamp
Bittrex
Coinbase
Gemini
Kraken
Poloniex
Limitations
Because of the fact that CMEV is pulling data from from multiple different exchanges and is computationally intensive it can take a couple of seconds to load while charting certain cryptoasset pairs.
Additionally, due to Tradingview's various limitations only a certain number of pairs can be supported at a time. By default, only pairs with a BTC or USD quote are supported and many non-unique pairs with consistently low trading volumes have been removed. For a full explanation, please refer to the docs in my GitHub (jakobpredin/crypto-multi-exchange-volume).
Future of the project
I plan on supporting pairs from more exchanges in the future as I see fit and as they become available for charting on Tradingview. Further, I may develop a strategy script using CMEV as its core indicator.
I welcome everybody from the community to help me extend the functionality of CMEV in order to make investing in cryptoassets more transparent for everybody.
Bitcoin (Mata Wang Kripto)

A Simple Bitcoin Stock to Flow ModelThis is just a bit of fun. Stock to flow is a hot topic so I thought I'd mess around. Here is a model that is very closely based on the one available here: digitalik.net . I take no credit for the actual model.
It can be tuned with parameters a and b, but this is the best fit imo.
The model is a bit pointless as Tradingview doesn't let us run scripts on future candles, so no predictions.
The blue line is the actual model and the pink line is a 200 MA.
Run this script on the DAILY chart please ;)
Here's a close up of current action. Interesting maybe ;)

BTC 1D Alerts V1This script contains a variety of key indicator for bitcoin all-in-one and they can be activated individually in the menu. These are meant to be used on the 1D chart for Bitcoin.
1457 Day Moving Average: the bottom of the bitcoin price and arguably the rock bottom price target.
Ichimoku Cloud: a common useful indicator for bitcoin support and resistance.
350ma fibs (21 8 5 3 2 and 1.6) : Signify the tops of each logarthmic rise in bitcoin price. They are generally curving higher over the long term. For halvening #3, the predicted market crash would be after hitting the 350ma x3 fib. Also the 350 ma / 111 ma cross signifies bull market top within about 3 days as well. Using the combination of the 350ma fibs and the 350/111 crosses, reasonably identify when market top is about to occur.
50,120,200 ma: Common moving averages that bitcoin retests during bull market runs. Also, the 50/200 golden and death crosses.
1D EMA Superguppy Ribbons: green = bull market, gray is indeterminate, red = bear market. Very high specificity indicator of bull runs, especially for bitcoin. You can change to 3D candle for even more specificity for a bull market start. Use the 1W for even more specificity. 1D Superguppy is recommended for decisionmaking.
1W EMA21: a very good moving average programmed to be shown on both the daily and weekly candle time. Bitcoin commonly corrects to this repeatedly during past bull runs. Acts as support during bull run and resistance during a bear market.
Steps to identifying a bull market:
1. 50/200 golden cross
2. 1D EMA superguppy green
3. 3D EMA superguppy green (if you prefer more certainty than step 2).
4. Hitting the 1W EMA21 and bouncing off during the bull run signifies corrections.
Once a bull market is identified,
Additional recommended buying and selling techniques:
Indicators:
- Fiblines - to determine retracements from peaks (such as all time high or recent highs)
- Stochastic RSI - 1d, 3d, and 1W SRSI are great time to buy, especially the 1W SRSI which comes much less frequently.
- volumen consolidado - for multi exchange volumes compiled into a single line. I prefer buying on the lowest volume days which generally coincide with dips.
- MACD - somewhat dubious utility but many algorithms are programmed to buy or sell based on this.
Check out the Alerts for golden crosses and 350ma Fib crosses which are invaluable for long term buying planning.
I left this open source so that all the formulas can be understood and verified. Much of it hacked together from other sources but all indicators that are fundamental to bitcoin. I apologize in advance for not attributing all the articles and references... but then again I am making no money off of this anyway.

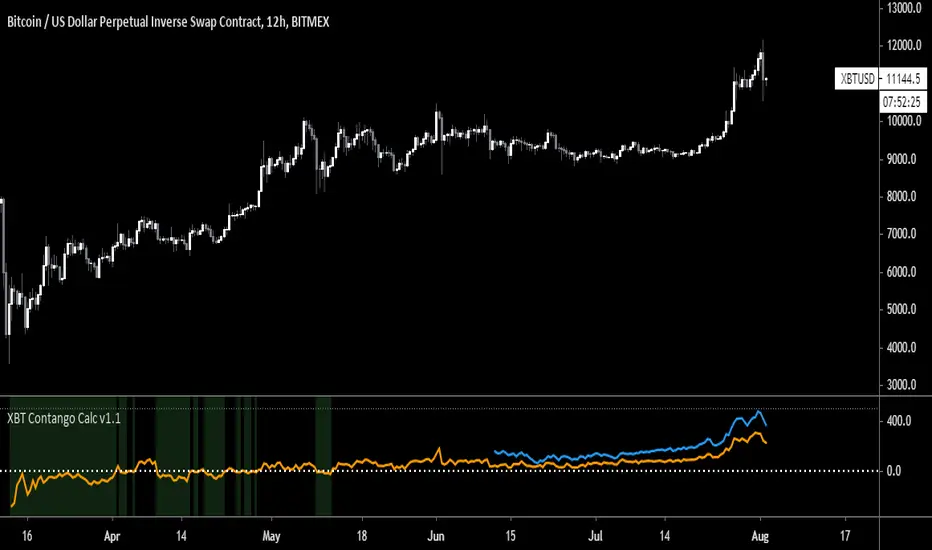
XBT Contango Calculator v1.1
This indicator measures value of basis (or spread) of current Futures contracts compared to spot. The default settings are specifically for Bitmex XBTU19 and XBTZ19 futures contracts. These will need to be updated after expiration. Also, it seems that Tradingview does not keep charts of expired contracts. If anyone knows how to import data from previous expired contracts, please let me know. This historical data could be valuable for evaluating previous XBT futures curves.
Also, VERY important to understand is this indicator only works with Spot Bitcoin charts (XBTUSD, BTCUSD, etc). If you add this to any other asset chart, it would not be useful (unless you changed settings to evaluate a different Futures product).
Contango and Backwardation are important fundamental indicators to keep track of while trading Futures markets. For a better explanation, Ugly Old Goat had done several medium articles on this. Please check out link below for his latest article on the subject...
uglyoldgoat.com
Notes on chart above should explain most of what you need to know on to use this indicator. The zero line is the spot price on the chart, so a positive value means Futures are trading at a premium (or in Contango). You can set a value of extreme Contango which will give an alert as red background (default setting is +$500). Green background will appear when Futures are trading at a discount to spot (Backwardation).
Hope some people get some use out of this. This is my first attempt at coding anything, so any feedback would be greatly appreciated!
BTC Donations: 3CypEdvBcvVHbqzHUt1FDiUG53U7pYWviV
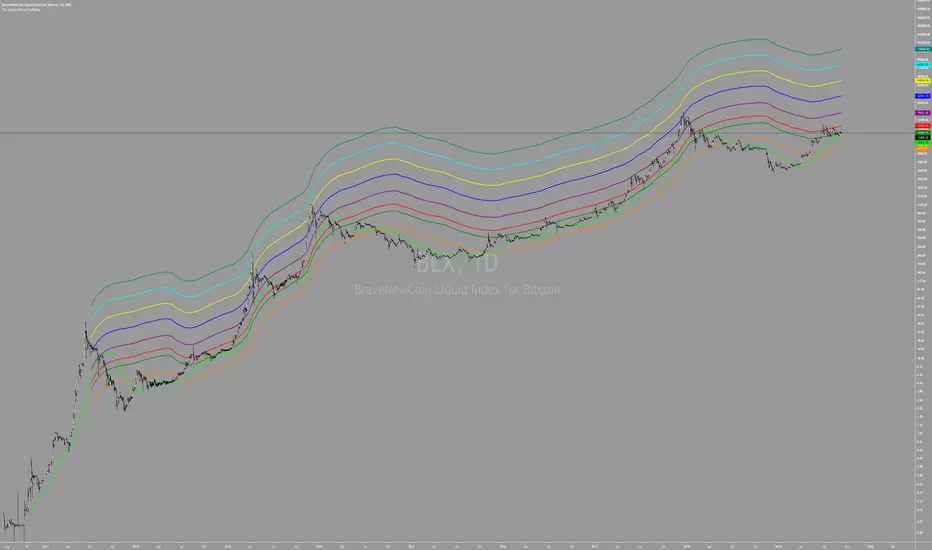
The Golden Ratio MultiplierBy Philip Swift
As Bitcoin continues to progress on its adoption journey, we learn more about its growth trajectory.
Rather than Bitcoin price action behaving like a traditional stock market share price, we see it act more like a technology being adopted at an exponential rate.
This is because Bitcoin is a network being adopted by society, and because it is decentralised money with limited supply, its price is a direct representation of that adoption process.
There are a number of regression analysis tools and stock to flow ratio studies that are helping us to understand the direction of Bitcoin’s adoption curve.
The new tool outlined in this paper brings an alternative degree of precision to understanding Bitcoin’s price action over time. It will demonstrate that Bitcoin’s adoption is not only following a broad growth curve but appears to be following established mathematical structures.
In doing so, it also:
Accurately and consistently highlights intracycle highs and lows for Bitcoin’s price.
Picks out every market cycle top in Bitcoin’s history.
Forecasts when Bitcoin will top out in the coming market cycle.
To begin, we will use the 350 day moving average of Bitcoin’s price. It has historically been an important moving average because once price moves above it, a new bull run begins.
more ...
medium.com
All rights reserved to Philip Swift (@PositiveCrypto)

Bitcoin Difficulty Ribbon [aamonkey]This is another tool to find big cycle bottoms that is very unknown yet effective.
The Difficulty Ribbon speaks to the impact of miner selling pressure on Bitcoin`s price action.
When network difficulty reduces its rate of climb, miners are going out of business, leaving only the strong miners who proportionally need to sell less of their coins to remain operational, this leads to less sell pressure and more room for bullish price action.
The best times to buy Bitcoin are zones where the ribbon compresses.
The ribbon consists of simple moving averages of Bitcoin network difficulty so the rate of change of difficulty can be easily seen.
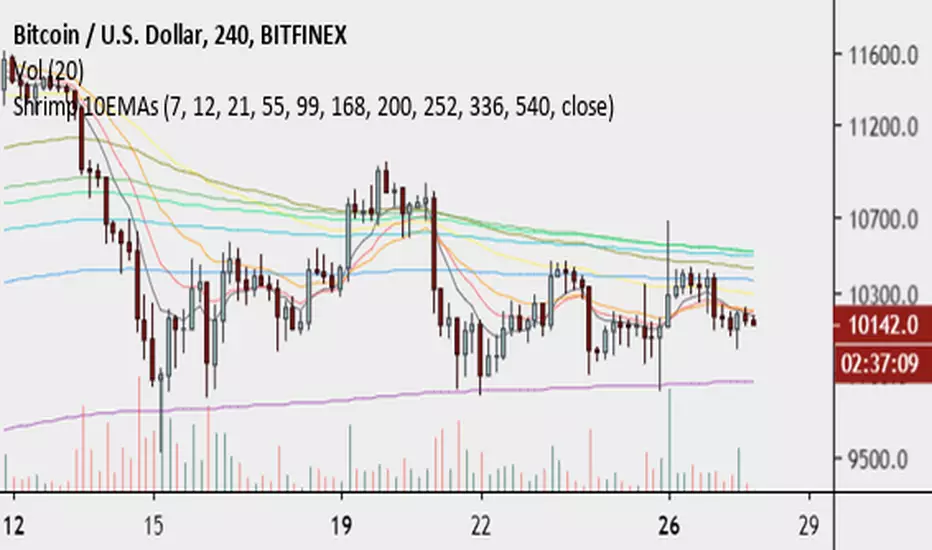
BullShrimp's 10EMAsA simple bundle of EMAs with some odd numbers that I found good confluence on 15min, 1h, 4h, 12h, 1d, 1w on BTC and on ALTS.
Works good for dynamic S/R on LTF and high probability target on MTF and HTF.
Try it out during your scans.
Lemme know what you think.
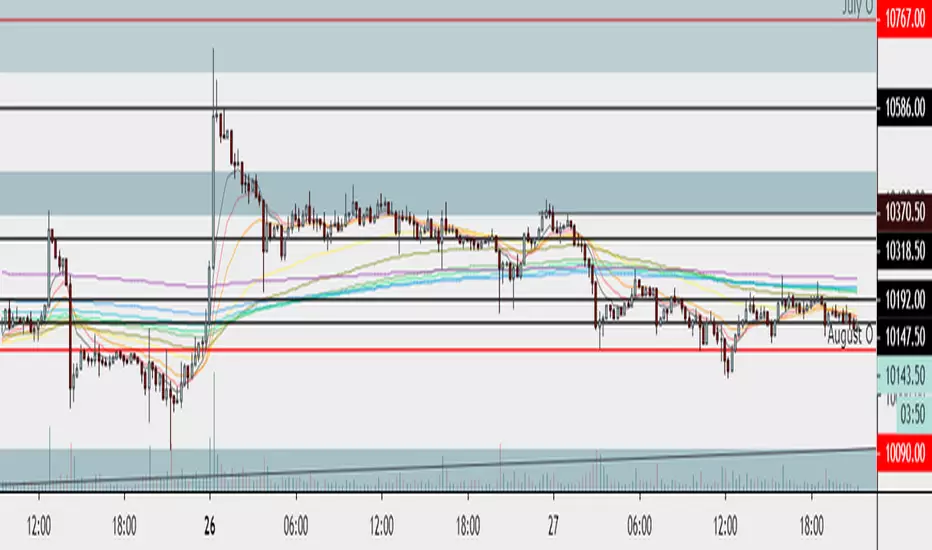
Shrimp 10EMAsA simple bundle of EMAs with some odd numbers that I found good confluence on 15min, 1h, 4h, 12h, 1d, 1w on BTC and on ALTS.
Works good for dynamic S/R on LTF and high probability target on MTF and HTF.
Try it out during your scans.
Lemme know what you think.
Your CRYPTO Screener - MACD 0 LAG editionHello traders
What's good?
1 - Quick introduction
This script is to demonstrate a proof-of-concept - showing you again what you thought wasn't possible might become (with some tricks) in the realm of possibles !!!.
I get requests for people who want a custom screener because the native TradingView Stocks/Forex/Crypto screeners don't allow to plug external indicators. (example: www.tradingview.com
This is entirely true and I have also good news for you, we can hack the system one more time. As Hackerman would say, "IT"S HACKING TIME !!!" (ref : KUNG FURY . (#geek #reference #done #for #today)
What if you could build your own personalized screener based on your custom indicator? "No Dave stop smoking, that's not possible, go back to eating your baguette". Say no more, let me present you my new script called YOUR CRYPTO Screener (MACD 0 LAG)
2 - What is a MACD ZERO LAG?
We'll all agree this indicator is NOT in the TradingView screeners so I'm not cheating here :)
A MACD ZERO LAG is a MACD that .... suspens.... wait for it.... DOES NOT lag.
The traditional MACD is based on exponential moving averages and as moving averages are lagging, then the MACD is lagging also. I'll spare you all the maths behind the MACD ZERO LAG but in short, this is a way more reactive indicator than the traditional MACD
I shared before the version that I personally use for my own trading : MACD 0 LAG nTREND coloring
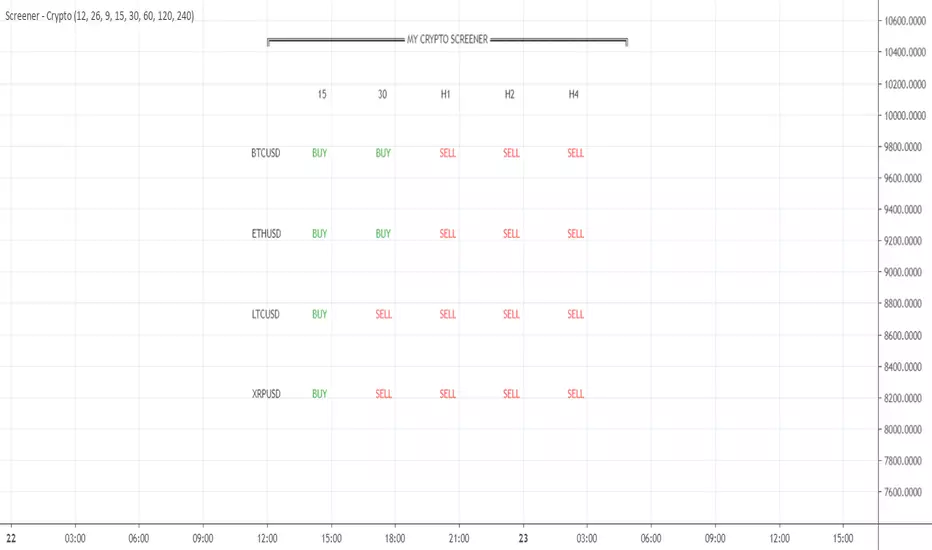
3 - Crypto Screener specifications
If I could do a screener as complete as the native one, this would be wonderful but ... we cannot and this is due to technical reasons. To call indicators from different timeframes, I have to use the security function. And we're limited to 40 security calls per indicator.
That explains why I selected 4 crypto assets and 5 timeframes and the MACD zero lag output for each asset/timeframe - which gives a total of 4 * 5 * 2 = 40
You'll be able to select from the interface the 5 timeframes that you want for your screener
In this script, you'll get a :
- BUY whenever the MACD ZERO LAG for your asset/timeframe is green.
- SELL whenever the MACD ZERO LAG for your asset/timeframe is red.
4 - Can you hack it even more?
If you want to add other timeframes or assets, you can either, change the code or add the indicator on another chart.
I made the source code generic enough so that you can update it yourself easily
Example:
Chart 1 will list BTCUSD, ETHUSD, LTCUSD, and XRPUSD in m5/m15/m30/H1/H4 and Chart2 could list BTCUSD, ETHUSD, LTCUSD and XRPUSD in H6/H8/H12/Daily, etc...
Once again the sky (and your computer RAM capacity) is the limit
5 - Can you super hack it even more?
1/ This script is only a proof-of-concept that you can build your own custom screener. Imagine having the Algorithm Builder and being able to connect it in a single click to a custom screener using your own configuration :)
How coooooooooooooooool would that be!!!
This screener version will be available on my website in a few weeks along with all the tools I'm spamming you about since the beginning of July (#shameless #self-advertising)
2/ For a nicer scripter, let's keep in mind that TradingView just enabled Webhooks this week. This will allow my company to offer custom screeners design and hosted on your own website. Those screeners will be for sure nicer than the indicator version
That's it for today and for this week
I won't even touch the laptop this weekend and will enjoy life a bit
Love you all
Dave
____________________________________________________________
Be sure to hit the thumbs up. Building those indicators take a lot of time and likes are always rewarding for me :) (tips are accepted too)
- If you want to suggest some indicators that I can develop and share with the community, please use my personal TRELLO board
- I'm an officially approved PineEditor/LUA/MT4 approved mentor on codementor. You can request a coaching with me if you want and I'll teach you how to build kick-ass indicators and strategies
Jump on a 1 to 1 coaching with me
- You can also hire for a custom dev of your indicator/strategy/bot/chrome extension/python
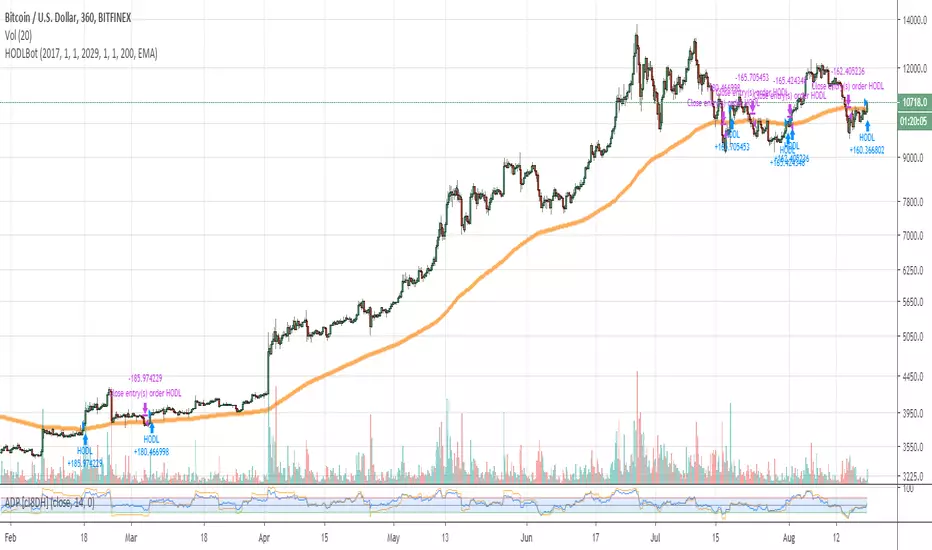
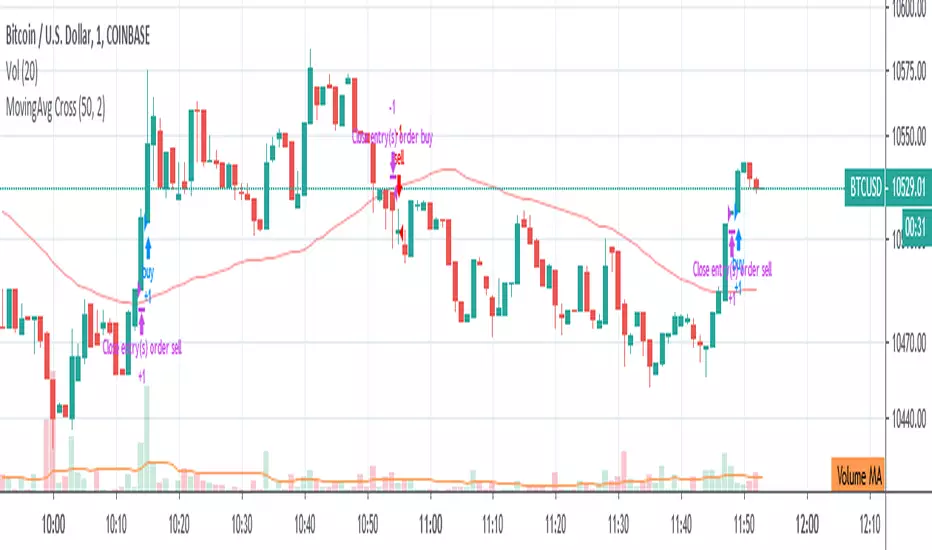
HODLBotHODLBot is a very simple script that HODLs BTC when price > 200 EMA on 6hr timeframe, and sells (closes long) when price < 200 EMA.
Designed to be used with just coins / not leveraged trading, to allow restful sleep knowing that you're not participating in brutal drawdowns like 2018 ^_^
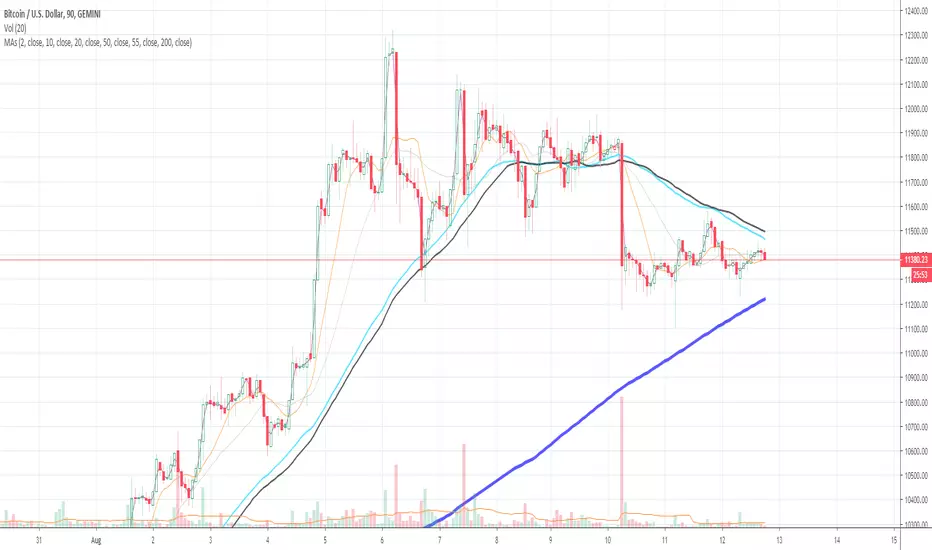
Moving Averages (2, 10, 20, 50, 55, and 200)This allows you to plot multiple moving averages under one indicator. This plots the 2, 10, 50, 55, and 200 moving average. You can turn each one off or on as needed through the settings gear icon.
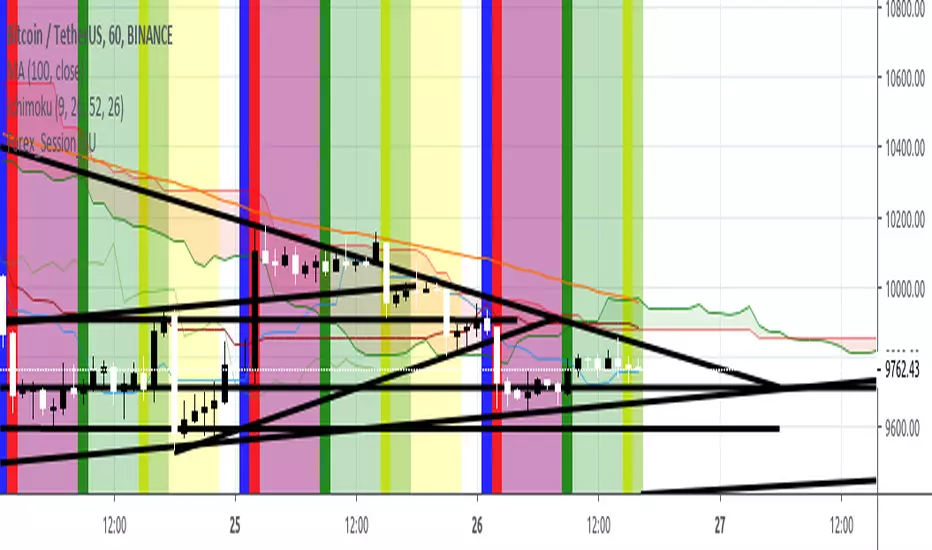
Tenkan Kijun Cross AlertTenkan Kijun cross alert, best used alongside a Volume indicator to help aid with finding those trend continuation patterns.
I prefer to use the Chaikin Money Flow, when it indicates and holds above the 0 line then you will bias Longs, and when below then you will Bias shorts
If you like this then please donate
BTC: 1LRbUgrkvFLQ5Mt7C62EJRD9aMvhDNT22K
ETH: 0xa509b89bccb788234278eFE63470c10946E26F3c
LTC: LV7MUr6arvCffS5N6pbTWgav5S3Yi1Eejp

Dollar Cost Average (Data Window Edition)Hi everyone
Hope you had a nice weekend and you're all excited for the week to come. At least I am (thanks to a few coffee but that still counts !!!)
This indicator is inspired from Dollar-Cost-Average-Cost-Basis
EDUCATIONAL POST
The educational post is coming a bit later this afternoon explaining how to use the indicator so I would advise to follow me so that you'll get updated in real-time :) (shameless self-advertising)
1 - What is Dollar-Cost Averaging (DCA)?
Dollar-Cost Averaging is a strategy that allows an investor to buy the same dollar amount of an investment on regular intervals. The purchases occur regardless of the asset's price.
I hope you're hungry because that one is a biggie and gave me a few headaches. Happy that it's getting out of my way finally and I can offer it
This indicator will analyse for the defined date range, how a dollar cost average (DCA) method would have performed vs investing all the hard earnt money at the beginning
2- What's on the menu today ?
Please check this screenshot to understand what you're supposed to see : CLICK ME I'M A SCREENSHOT (I'll repeat this URL one more time below as I noticed some don't read the information on my description and then will come pinging me saying "sir me no understand your indicator, itz buggy sir"
(yes I finally thought about a way to share screenshots on TradingView, took me 4 weeks, I'm slow to understand things apparently)
My indicator works with all asset classes and with the daily/weekly/monthly timeframes
As always, let's review quickly the different fields so that you'll understand how to use it (and I won't get spammed with questions in DM ^^)
- Use current resolution : if checked will use the resolution of the chart
- Timeframe used for DCA : different timeframe to be used if Use current resolution is unchecked
- Amount invested in your local currency : The amount in Fiat money that will be invested at each period selected above
- Starting Date
- Ending Date
- Select a candle level for the desired timeframe : If you want to use the open or close of the selected period above. Might make a diffence when the timeframe is weekly or monthly
3 - Specifications used
I got the idea from this website dcabtc.com and the result shown by this website and my indicator are very interesting in general and for your own trading
The formula used for the DCA calculation is that one : Investopedia Dollar Cost Average
4 - How to interpret the results
"But sir which results ??"...... those ones : CLICK ME I'M A SCREENSHOT :) (strike #2 with the screenshot)
It will draw all the plots and will give you some nice data to analyze in the Data Window section of TradingView
I'm not completely satisfied with the tool yet but the results are very closed to the dcabtc website mentioned above
If you're trading a very bullish asset class (who said crypto ?), it's very interesting to see what a DCA strategy could bring in term of performance. But DCA is not magic, there is a time component which is the day/week/month you'll start to invest (those who invested in crypto beginning of 2018 in altcoins know what I'm talking about and ..............will hate me for this joke)
5 - What's next ?
As said, the educational post is coming next but not only.
Will probably post a strategy tomorrow using this indicator so that you can compare what's performing best between your trading and a dollar cost average method
I'll publish as a protected source this time a more advanced version of that one including DCA forecasts
6 - Suggested alternative (but I'll you doing it)
If you don't want to have this panel in the bottom with the plots and analyze the results in the data window, you can always create an infopanel like shown here Risk-Reward-InfoPanel/ and display all the data there
Hope you'll like it, like me, love it, love me, tip me :)
____________________________________________________________
Feel free to hit the thumbs up as it shows me that I'm not doing this for nothing and will motivate to deliver more quality content in the future. (Meaning... a few likes only = no indicators = Dave enjoying the beach)
- I'm an offically approved PineEditor/LUA/MT4 approved mentor on codementor. You can request a coaching with me if you want and I'll teach you how to build kick-ass indicators and strategies
Jump on a 1 to 1 coaching with me
- You can also hire for a custom dev of your indicator/strategy/bot/chrome extension/python

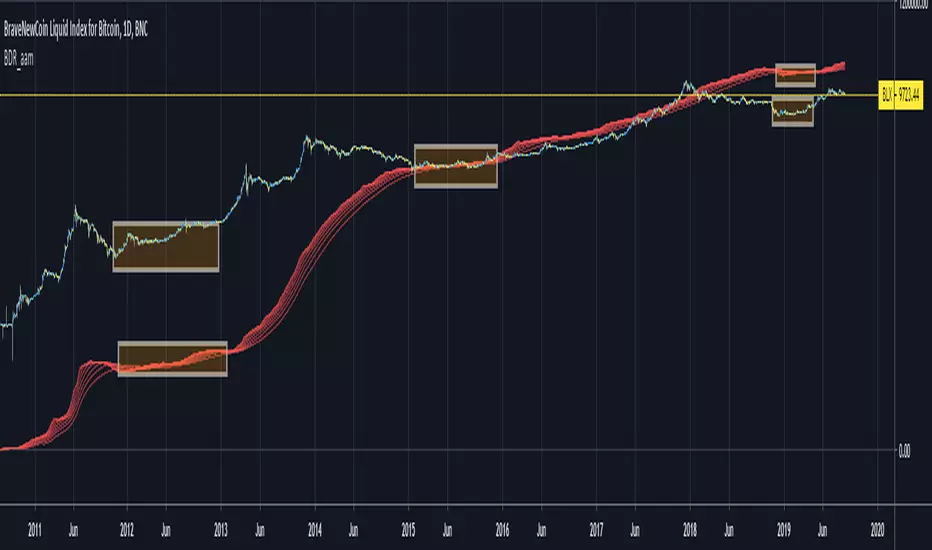
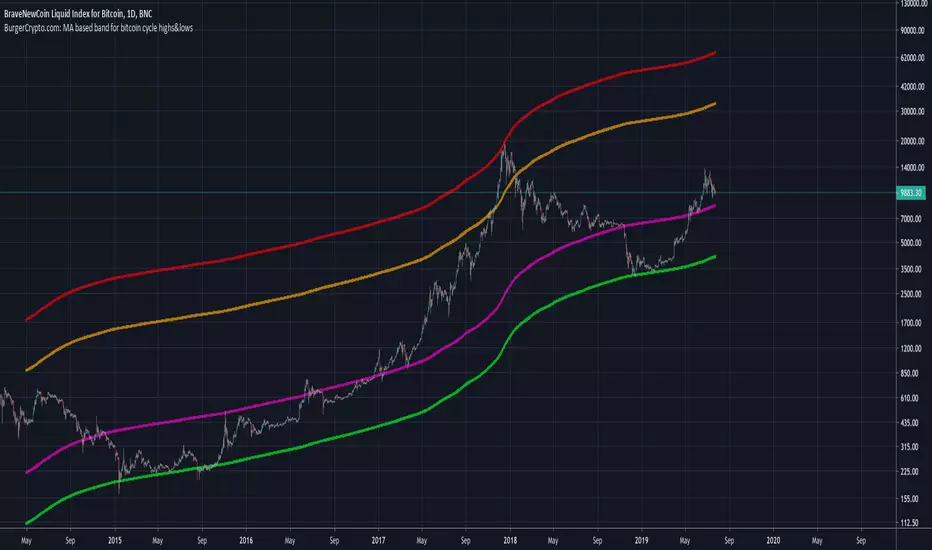
BurgerCrypto.com: MA based band for bitcoin cycle highs&lowsWarning: This script works only on a daily chart and only works for bitcoin charts with a long history. Best to be used on the BLX chart as it goes back to July 2010.
This script shows you the Moving Average with the length of a full bitcoin cycle, in which a cycle is defined as a period between two reward halvings; i.e. 210.000 blocks.
After data analysis in Python, I found that the average inter arrival time is a bit lower than the often communicated 10minutes; it's 9.46minutes, which makes the 210.000 block interval equal to 1379days.
The 1379d Moving Average seems to serve well as a support for the price of bitcoin over time and it's 4th 2^n multiple did a good job in catching the cycle tops.
If you like this indicator, please leave some claps for the Medium article in which I introduced this indicator:
medium.com
Bitcoin Price User Correlation [aamonkey]You can only use this for BTC.
Bitcoin over time tends to be priced at 7000 times the number of users (in terms of market cap).
Calculation:
Number of Wallets*7000/(Circulating Supply or 21,000,000)
Settings:
You can decide whether you want to use the Circulating Supply or 21,000,000 as a reference.
The default settings are using 21,000,000 because it seems to be more accurate.
You can easily switch between both versions by checking the box in the settings.
Interesting Findings:
Using circulating supply:
- Most of the time we are under the estimated ("PUC") line
- Once we break above the PUC line we are in the parabolic phase of the Bullrun
- In history, we broke only 4 times above the PUC
- Once we are above the PUC we see crazy growth (parabolic phase)
- We don't spend much time above the PUC
- From breaking the PUC to the new All-Time High of the cycle we took in order: 3 Days, 7 Days, 22 Days, 30 Days
- So the trend is increasing (We are taking more and more time until we see the ATH)
- Currently, we are about to break the PUC
- Then I expect the parabolic phase to begin
- I expect the run to last about 30 days

Brandon BollSecond day at Pinescript and I am attempting to tweak the Bollinger Bands directed strategy to send alerts to Zignaly in order to automate long buy/sells.
I've left in the short script though for completeness.
The buy and sell instructions work perfectly but I don't know how to do a cancel order alert (as included in the original strategy)

AntiRekt RibbonThis script is a fork of the Madrid Ribbon, the only difference is that you can color your bars depending on the trend.

Bitcoin Prices InfoPanelHello traders
This script is based on the great Ricardo Santos InfoPanel script
It will display all the Bitcoin prices
The script is public so you can adjust according to your own needs
PS
You might have to scroll right on your chart to see the panel
Enjoy :)
Dave

CME & XBT - BTC Futures Settlement DatesHi everyone
This in an indicator inspired by Scarrff
I added the XBT quarterly and yearly settlement dates
Enjoy
David

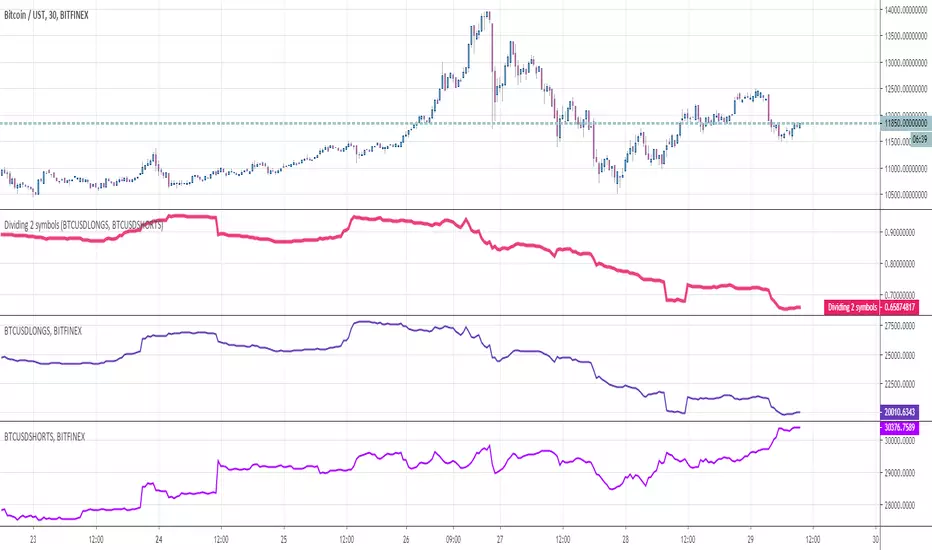
Dividing 2 symbolsHello Traders
This indicator is used to divide two assets between them. Why you would ask ?
For instance, in crypto trading, traders often look at the ratio Longs/Shorts or Shorts/Longs to figure out which side is leading the market and use this information as a powerful hedge for their next trade
Enjoy
Dave