TB!G-Scalp Strategy [Alert]Scalping Crypto Assets Made Easy
TB!G-Scalp is a TradingView based alert and accompanying strategy PineV3 Script.
Backtest vs Realtime
When designing the algorithms for this strategy our focus was primarily on ease of use.This results in a beautiful yet easy to use scalping strategy. As input it takes a chart period and only one extra parameter for fine tuning. The backtest results are an accurate representation of it’s real-time behaviour.
What makes it tick?
Over the last 2 years we collected a lot of market data regarding Bull and Bear behaviours. This previous market behaviour echo’s into the current market trend.
By recognising these echo’s we are able to anticipate an upcoming micro reversal which eventually end up being a scalping strategy.
Interested
Access is provided to a limited amount of people and for the duration that is determined by it’s Alpha Decay Rate.
This ADR is expected to become problematic after 2.3 year of usage on a lot of 150 users.
Bitmex

TB!G-Scalp Strategy [Backtest]Scalping Crypto Assets Made Easy
TB!G-Scalp is a TradingView based alert and accompanying strategy PineV3 Script.
Backtest vs Realtime
When designing the algorithms for this strategy our focus was primarily on ease of use.This results in a beautiful yet easy to use scalping strategy. As input it takes a chart period and only one extra parameter for fine tuning. The backtest results are an accurate representation of it’s real-time behaviour.
What makes it tick?
Over the last 2 years we collected a lot of market data regarding Bull and Bear behaviours. This previous market behaviour echo’s into the current market trend.
By recognising these echo’s we are able to anticipate an upcoming micro reversal which eventually end up being a scalping strategy.
Interested
Access is provided to a limited amount of people and for the duration that is determined by it’s Alpha Decay Rate.
This ADR is expected to become problematic after 2.3 year of usage on a lot of 150 users.

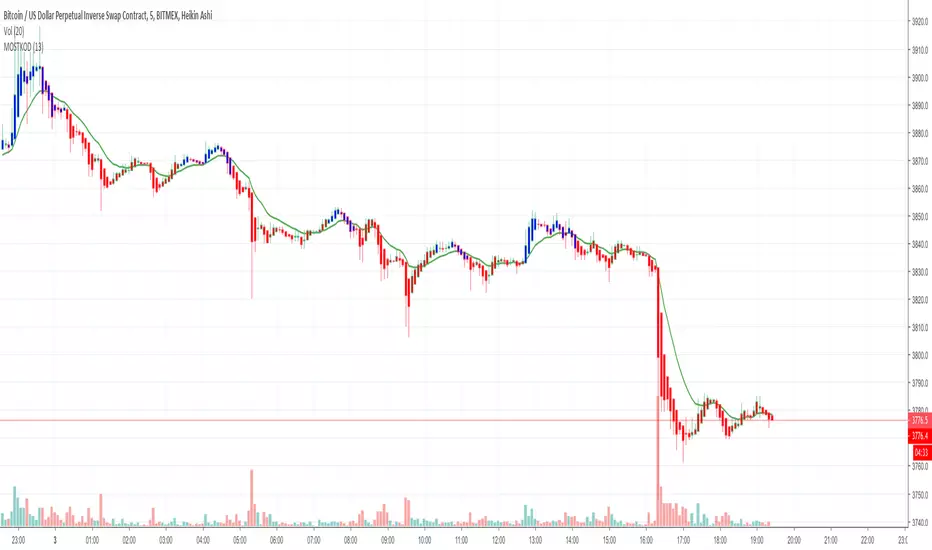
MOSTKOD INDCATOR v1Hello to everyone,
The Mostkod Indicator gives us the buying and selling points.
Blue color on buy;
Red color on sale.
You can contact us for more information.
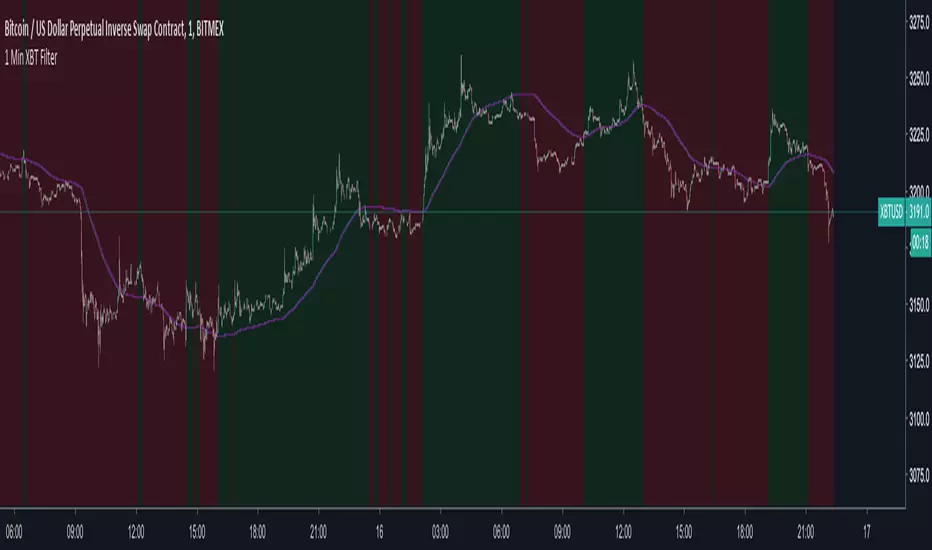
Kitaec ScalperHelper^2A simple script to see a trend direction on BTC. It paints background color in red and green, according to the current situation. It takes info from multiple timeframes and exchanges. Best to use it on 1-minute (max 3-minute) BitMEX XBTUSD perpetual chart. Please don`t try to countertrade it. Probable you can wait for a color to change and take your position accordingly then moving stoploss in the direction of your trade. Also you can see whenever there are price manipulations or not. Smooth color change is usual, and the sharp one is not, and probably its only manipulation. You can use its simplified version on any asset if you uncheck all the checkmarks in script color settings exept first and second, but for best performance you should also use 1 or 3-minute charts.

FOMO_Buy_Sell_Indicator_BasicFOMO Buy Sell Indicator (Basic Version)
Inexpensive alternative to FOMO (Full Version), best for those who wish to use FOMO but with limited functionalities.
Features
-> Conventional FOMO
-> Multiple EMAs
Doesn't Include
-> Short Term/Mid Term/Long Term Trade Signals
-> Holy Trend Line
-> Options to change parameters inside FOMO.

[SignalFI] - FutureFI V1 [Bitfinex - All Pairs][Alerts]FutureFI uses the futures (Long and Short) contracts housed on Bitfinex to provide a gauge for the relative difference and strength of interest in buying or selling Bitfinex assets based on total contracts created.
MUTLTIPLE-TIMEFRAME RSI FOR FUTURES CONTRACTS
DIFFERENCE STATISTICS COMBINED WITH RSI MOMENTUM
SIGNALS CAN BE APPLIED OUTSIDE OF BITFINEX
ALERTS VERSION Only for Jedi and Master Subscribers
Supported Assets:
LongAsset "BTCUSDLONGS","ETHUSDLONGS","XRPUSDLONGS","EOSUSDLONGS","LTCUSDLONGS","BTGUSDLONGS","ETPUSDLONGS","IOTUSDLONGS","ETCUSDLONGS","ZECUSDLONGS","NEOUSDLONGS","XMRUSDLONGS","ZRXUSDLONGS","OMGUSDLONGS","DSHUSDLONGS","BABUSDLONGS","BSVUSDLONGS","SANUSDLONGS","EDOUSDLONGS","TRXUSDLONGS","XLMUSDLONGS","BATUSDLONGS","VETUSDLONGS","SNGUSDLONGS"
ShortAsset "BTCUSDSHORTS","ETHUSDSHORTS","XRPUSDSHORTS","EOSUSDSHORTS","LTCUSDSHORTS","BTGUSDSHORTS","ETPUSDSHORTS","IOTUSDSHORTS","ETCUSDSHORTS","ZECUSDSHORTS","NEOUSDSHORTS","XMRUSDSHORTS","ZRXUSDSHORTS","OMGUSDSHORTS","DSHUSDSHORTS","BABUSDSHORTS","BSVUSDSHORTS","SANUSDSHORTS","EDOUSDSHORTS","TRXUSDSHORTS","XLMUSDSHORTS","BATUSDSHORTS","VETUSDSHORTS","SNGUSDSHORTS"
SignalFI was created to help traders and investors to effectively analyze the market based on the Golden Mean Ratio (Fibonacci numbers), plan a trade and ultimately execute it. To help inform and educate market decisions we developed a set of Trading Indicators which are available on TradingView , the most advanced and yet easy to use charting platform available on the web.
SignalFI indicators are just that, indicators. Our indicators are generally configured to use completely historical data (negating repaint), and we advise all alerts created with SignalFI indicators to be fired upon "close" of the current candle. Our indicators can provide valuable context and visualization support when performing market analysis and executing buy and sell decisions. However. we are not financial experts, and all information presented on this site or our other media outlets are for educational purposes only.
For subscription information, visit www.signalfi.net and follow us on twitter.
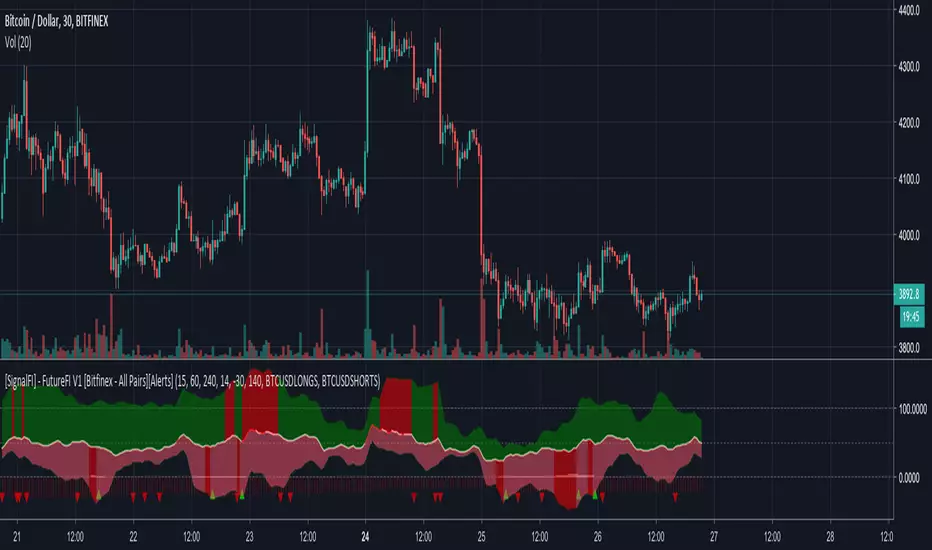
[SignalFI] - FutureFI V1 [Bitfinex - All Pairs]FutureFI uses the futures (Long and Short) contracts housed on Bitfinex to provide a gauge for the relative difference and strength of interest in buying or selling Bitfinex assets based on total contracts created.
MUTLTIPLE-TIMEFRAME RSI FOR FUTURES CONTRACTS
DIFFERENCE STATISTICS COMBINED WITH RSI MOMENTUM
SIGNALS CAN BE APPLIED OUTSIDE OF BITFINEX
Supported Assets:
LongAsset "BTCUSDLONGS","ETHUSDLONGS","XRPUSDLONGS","EOSUSDLONGS","LTCUSDLONGS","BTGUSDLONGS","ETPUSDLONGS","IOTUSDLONGS","ETCUSDLONGS","ZECUSDLONGS","NEOUSDLONGS","XMRUSDLONGS","ZRXUSDLONGS","OMGUSDLONGS","DSHUSDLONGS","BABUSDLONGS","BSVUSDLONGS","SANUSDLONGS","EDOUSDLONGS","TRXUSDLONGS","XLMUSDLONGS","BATUSDLONGS","VETUSDLONGS","SNGUSDLONGS"
ShortAsset "BTCUSDSHORTS","ETHUSDSHORTS","XRPUSDSHORTS","EOSUSDSHORTS","LTCUSDSHORTS","BTGUSDSHORTS","ETPUSDSHORTS","IOTUSDSHORTS","ETCUSDSHORTS","ZECUSDSHORTS","NEOUSDSHORTS","XMRUSDSHORTS","ZRXUSDSHORTS","OMGUSDSHORTS","DSHUSDSHORTS","BABUSDSHORTS","BSVUSDSHORTS","SANUSDSHORTS","EDOUSDSHORTS","TRXUSDSHORTS","XLMUSDSHORTS","BATUSDSHORTS","VETUSDSHORTS","SNGUSDSHORTS"
SignalFI was created to help traders and investors to effectively analyze the market based on the Golden Mean Ratio (Fibonacci numbers), plan a trade and ultimately execute it. To help inform and educate market decisions we developed a set of Trading Indicators which are available on TradingView , the most advanced and yet easy to use charting platform available on the web.
SignalFI indicators are just that, indicators. Our indicators are generally configured to use completely historical data (negating repaint), and we advise all alerts created with SignalFI indicators to be fired upon "close" of the current candle. Our indicators can provide valuable context and visualization support when performing market analysis and executing buy and sell decisions. However. we are not financial experts, and all information presented on this site or our other media outlets are for educational purposes only.
For subscription information, visit www.signalfi.net and follow us on twitter: @signalfi_

FOMO_V2_Trend_Cloud// Currently in Testing.
// Official information will be published when back testing is complete.

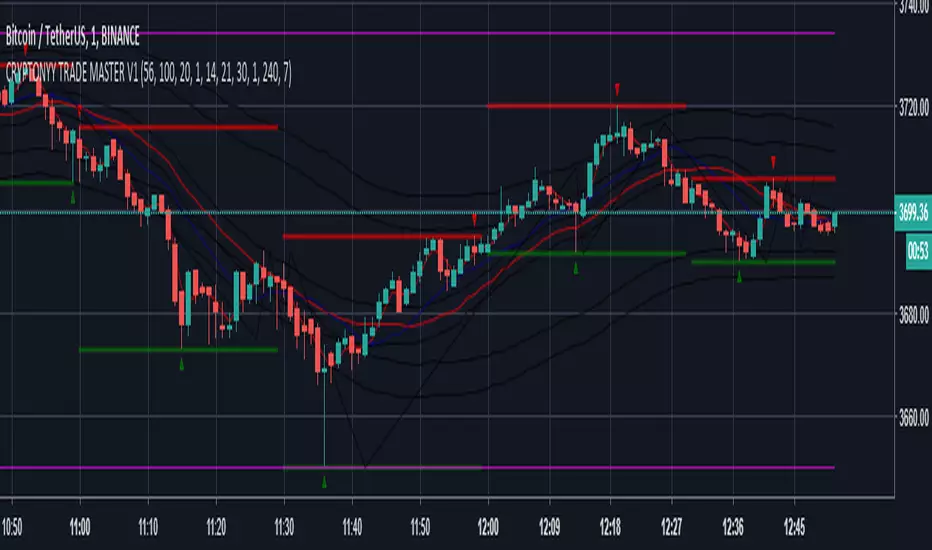
CRYPTONYY TRADE MASTER V1THIS SCRIPT IS ONLY MADE FOR BITMEX TRADERS.
IT WORKS ON 1MINUTE TIMEFRAME SMOOTHLY.
ADVANTAGES:
1. AUTO BUY/SELL SIGNALS.
2. 95% ACCURACY.
3. U WILL NEVER BE IN LOSS BECAUSE WE DEVELOPED THIS WITH OUR PERSONAL VOLATILITY INDICATOR.SO IF MARKET GOES OPPOSITE IT WILL GIVE U THE SIGNAL BEFORE YOUR LAST ENTRY PRICE.
4. DOUBLE CROSS INDICATOR.
5. MUCH VOLATILE=INCREASE THE SIGNAL ACCURACY.
6. 1MINUTE TIMEFRAME IS BEST TO TRADE WITH THIS SOFTWARE.
THOSE WHO WANT TO BUY THIS OR WANT DEMO COMMENT BELOW,I WILL MESSAGE YOU.
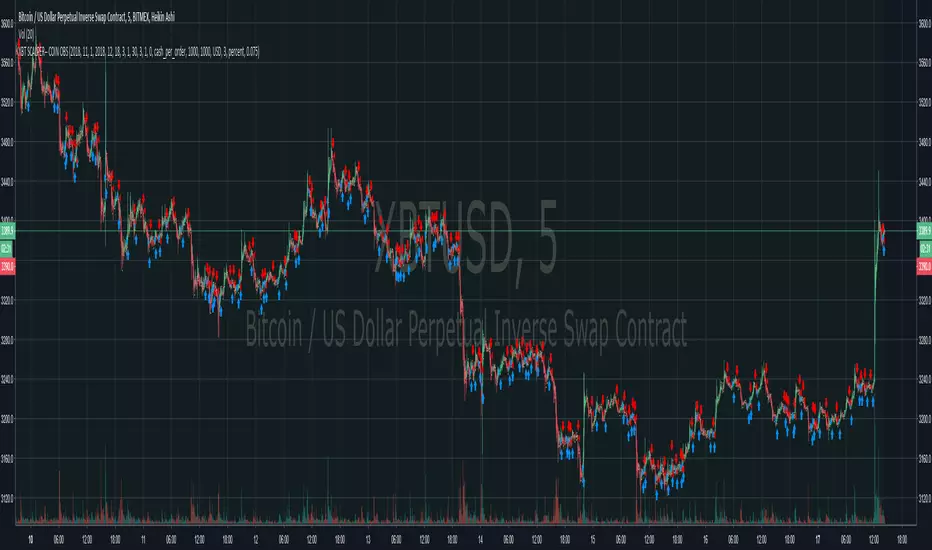
XBT swing-SCALPER-- with alerts-- COIN OBSFor backtested strategy:
This is the same strategy, with alerts for bots.
strategy takes much into consideration,
swings, rsi, mfi, with some safety nets.
For actual use, send me a DM.

BITCOIN DOMINATOR-- BOT-- Bitmex Ready!ladies and gentlemen,
We cracked the XBT code.
For more information, visit the website in my bio.
Moon Bound! god speed!
Trend is your friendThis indicator evaluates the trend based on crosses of two McGinley moving averages. It paints candles accordingly (it does not repaint), so you can see what the indicator is saying more clearly and stay in your trade until you see a period of consolidation or a reversal. You can control how far away those moving averages need to be for you to consider it a trend. If this distance is not met candles color is not changed and it shows you that the market is in a period of consolidation. I also added visualization of RSI, so you can have an easier time finding appropriate profit targets. For stop loss I would recommend placing it a couple points above or below the previous high / low that is located above / below you final target for entry. You can also use a certain percentage that works for you. I tried adding a stop loss based on ATR, but I did not like the results. Using market structure is a better choice in my opinion.
Here is a basic trading strategy for the default settings:
Wait for the indicator to start printing a series of green or red candles. After that you can enter a long or a short around moving averages. Another valid place to entry is the specific RSI zone. If we are in an uptrend buying when RSI is oversold can be beneficial as you expect market to recover. I do not recommend changing RSI from 14. Vice versa for the downtrend. It gives you an edge as you know at what price RSI will be oversold and allows you to place trades in advance. Pretty neat! You need to realize that no indicator or strategy can give you an exact entry. There will always be some margin of error. What I wanted to say is that if there is a strong trend up and you buy around your key moving averages and when RSI is oversold you entered in good places and there is a pretty good chance you will make money.
Time frame settings:
If you want to use tighter stop losses I would recommend sticking to 15m. Do not go lower. It is not worth the stress. 1h and 4h seems to be very good as well, but expect your stop losses to be wider. What I personally tend to do is display 15m, 30m and 1h and compare it. Think of it as a short, mid and long term. That way you can see things little bit better.
Examples:
1H chart BTC
4h chart EUR / USD
1D chart NASDAQ
15m chart BTC (Daytrading)
That last chart shows that even if you were longing while the trend was about to change you still had a good chance to close it with a little profit and switch to short easily. The default settings is what has worked the best for me. Feel free to change them as you see fit and do not forget to let me know if you find something that works better :)
Notes:
Either disable wick display or change it to a neutral color like gray for both green and red candles. Unfortunately pine script does not allow wick painting, so if you have red / green wicks it will look terrible. If RSI visualization makes your candles look too small you can go to settings and disable the display of individual RSI levels. You will still be able to see the zones, but the scale won't be affected.


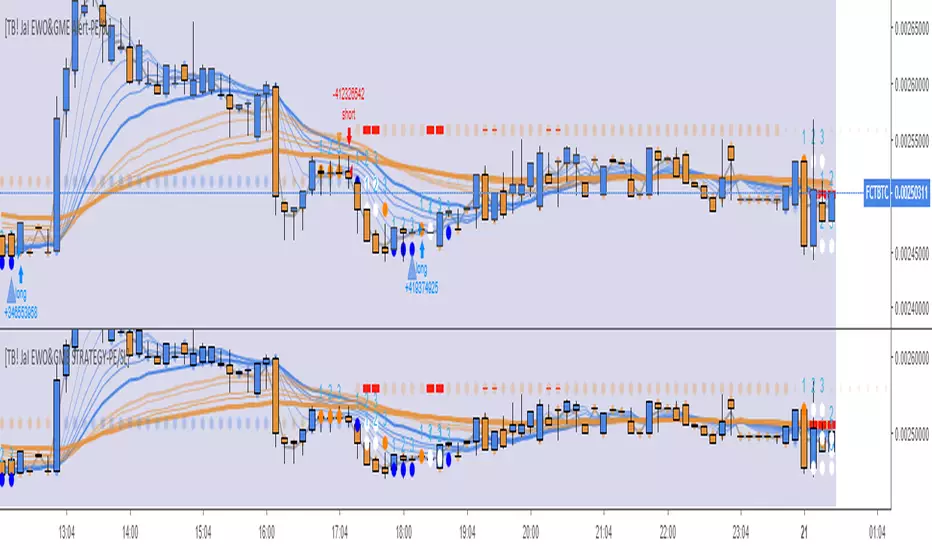
[Strategy]TB!Just an Indicator [EWO& Guppy Made Easy]]Backtesting for TB! Just an Indicator + the merger of EWO & Guppy
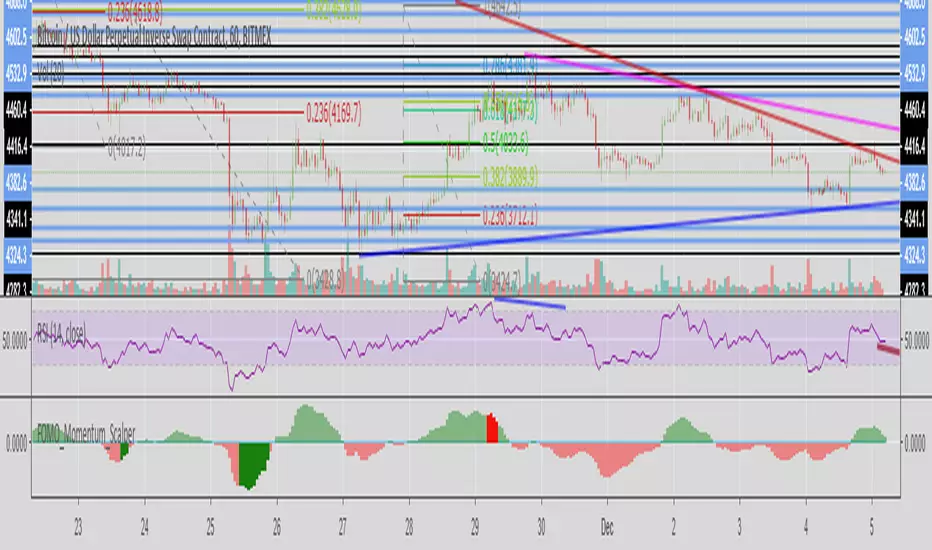
FOMO_Momentum_ScalperIndicator is easy to work with.
The histogram indicates the momentum.
Nothing fancy but signals are pretty accurate
Dark Green Bars on Histogram - Buying opportunity (Momentum of dump is decreasing)
Dark Red Bars on Histogram - Selling opportunity (Momentum of pump is decreasing)
Works best on 1m chart for those great scalping opportunities. Signals are based on increasing Buy/Sell momentum against the direction of the movement.
Haven't tested on any instrument except BTC.
Haven't tested for divergences but it should do the job.
P.S. It doesn't give too many signals as it waits for extreme conditions.
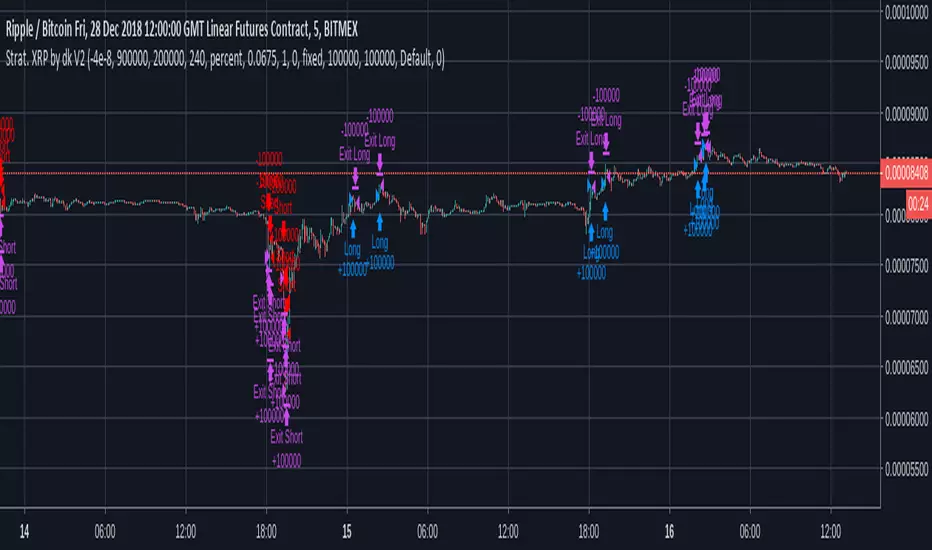
Trading Strat. BITMEX:XRPZ18 V2 (by dkukolev)Trading strategy on BitMex XBTZ18 for margin trading with high leverage
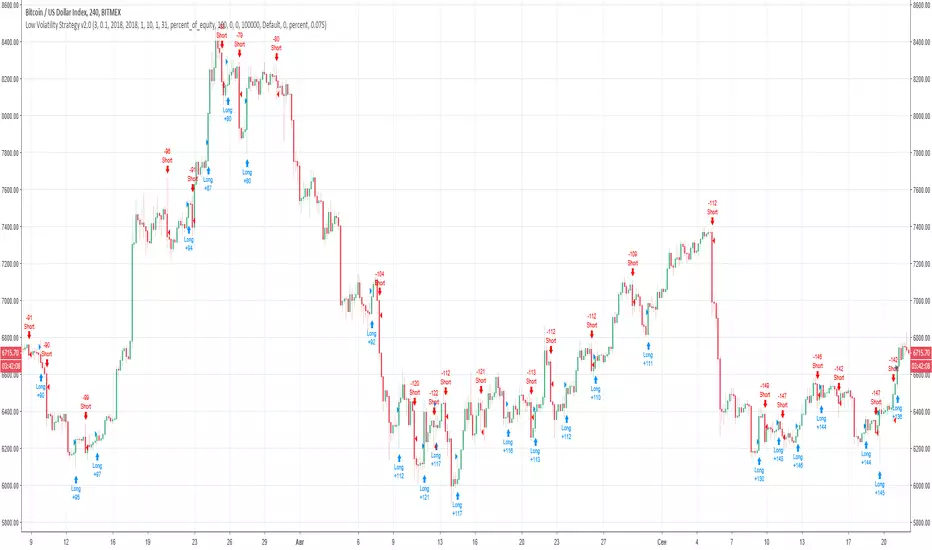
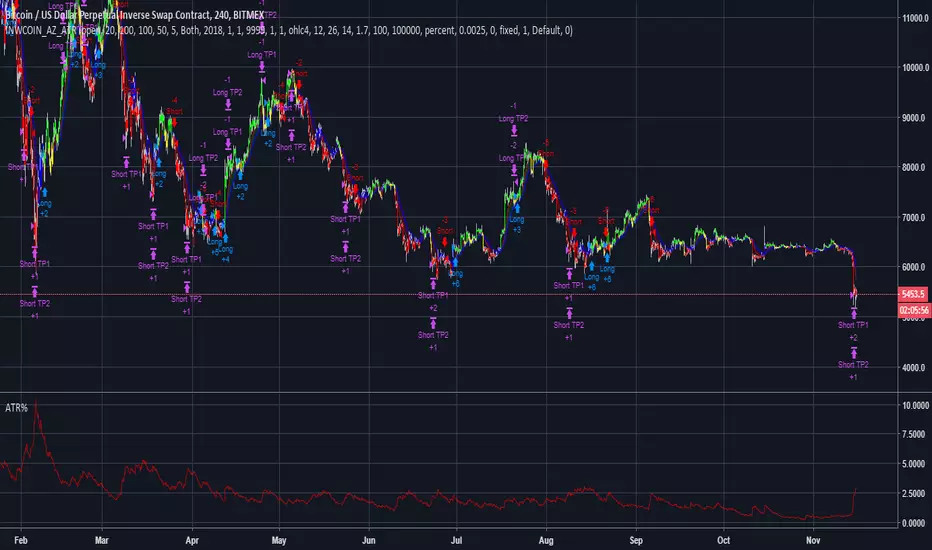
inwCoin's CDC ActionZone V.2 Strategy + FixedTP% + ATR%This indicator is upgrade version of my first CDC Action Zone v2 strategy.
- I added Take profit target #1 and #2 in setting instead of trailing start/stop ( because that one need bot to track trailing for max performance )
- I also added ATR% so we'll do nothing if market don't have any volatility ( like BTCUSD in 9-10/2018 ), we'll start entry short/long again if the volatility come
The result is incredibly good!
This backtest result is optimized for Bitmex ( XBTUSD ) only. If you need to backtest with another coin, please try it yourself :)
Exchange : Bitmex
Coin : XBTUSD ( perpetual )
Timeframe : 4H
Date range : 2018/1 - 2018/11
For : Trade by hand, just enter when signal show up and then set TP and stop then leave it be.
Config
Trade % = 20 ( You can increase trade size of your total port but it will get you into more risky trade. ( but yes, more profit ) ... u can increase trade size if you have enough profit
TP1&2 = 100 both ( I tried many value and found out both 100 give best result )
Stop % = 50 ( so this trade is RR = 2 nice! )
Leverage = 5 ( so we can withstand the price fluctuation and not get liquidated, if you trade spot, please choose 1 also, please adjust TP and stop accordingly eg. leverage 1 / TP = 20 / SL = 10 )
Trade Direction = Both ( for margin market, if you want to trade spot like Binance you can choose long only )
ATR period = 14 ( how many candle you want to calulate ATR )
ATR Percent = 1.7 ( You can adjust this value for any coin of your choice, this strategy will enter trade if current ATR% > ATR in config to avoid total sideway market )
Above is the critical parameter for trading by hand. You can have fun and working around with it :D
I hope you can make some money from this strategy. Yes, it take time and patience to wait for the right moment before enter any position, and it worth the wait !
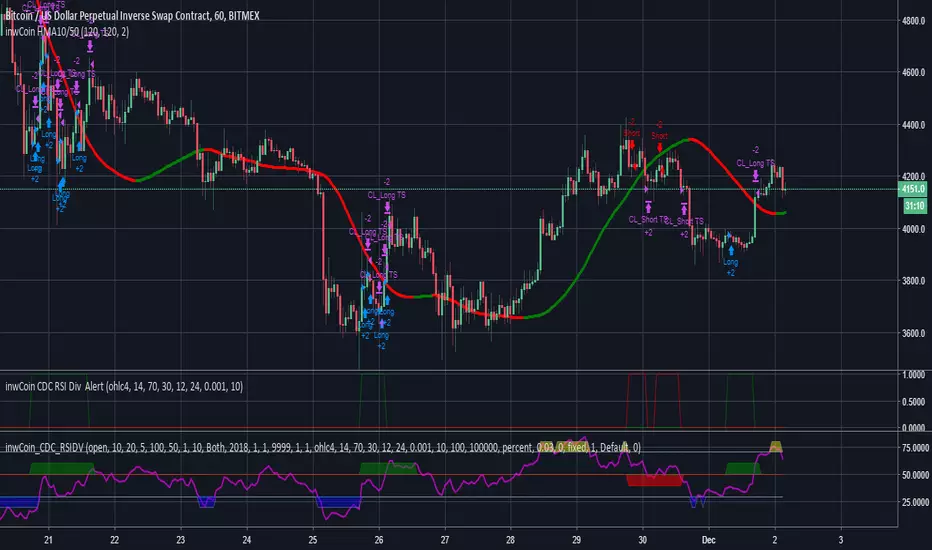
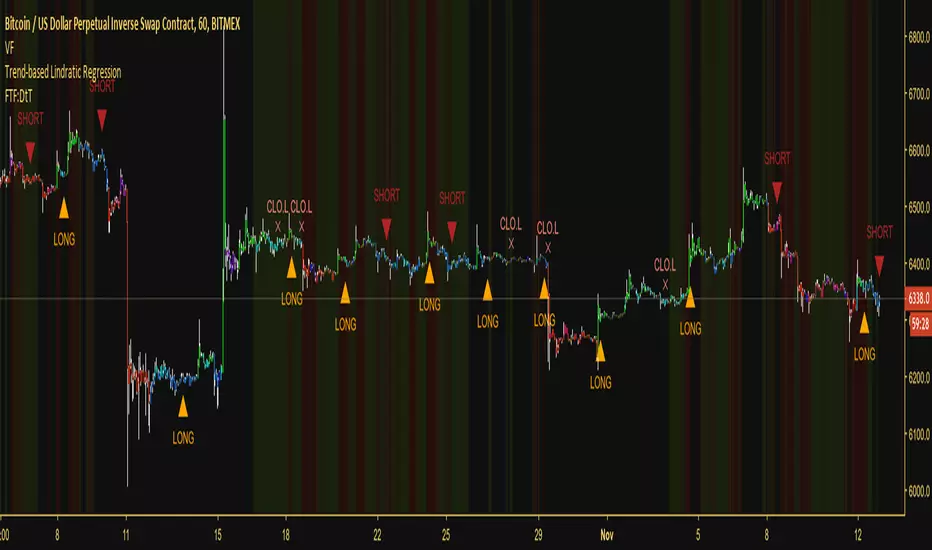
Trend-based Lindratic RegressionThis is an effective trend-following script that uses a finite volume element, linear regression, quadratic regression and multiple EMAs to define appropriate times to enter and exit the market. It can be applied to any asset that has volume data available for it.
As it follows the trend it's a very low-risk strategy, but it's not made to catch and ride reversals. It would rather close a long at the top and close a short at the bottom, although this means you can expect not to be stopped out on any trade you take.
Works on any timeframe, although I did create this with the intention of scalping, so shorter timeframes are recommended.
Combined with a volatility filter, this would be a very effective script, allowing you to stand away from the market during flat periods and trading with the trend during exciting periods.
Access to the script will be grated for 10$ of most low-fee cryptocurrencies, as well as BTC. If you're interested reach out to me through TradingView or, alternatively, contact @overttheraibow through Telegram.
If there's enough demand for it, I will also create a strategy version of this study which will be given for free to those who purchased the script. As always, maximum 250 places available.
Good luck!
CB Signals - Holla-724 BITMEX BTC/USD Long/Short (Paid Algo)This algo uses a number of strategies developed from 7 yrs of trading this concept in the FX markets. I have modified it for Leverage trading on BITMEX exchange.
You may view detail summary of live performance of this Algo dating from Jan 1st 2018 - Nov 9th 2018 (In one of Bitcoin's worst bear markets) below by clicking the "Performance Summary" Tab :
To signup for this algo please visit the link below:
www.cryptoblood.io

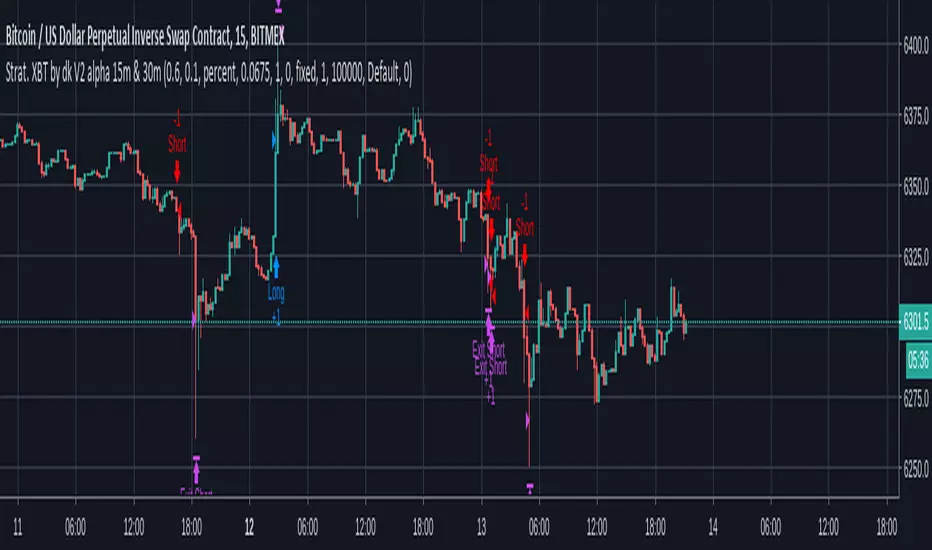
Trading Strat. BITMEX:XBTUSD V2 (by dkukolev) alphaTrading strategy on BitMex XBTUSD , 5 min and 15 min timeframes. Alpha edit.