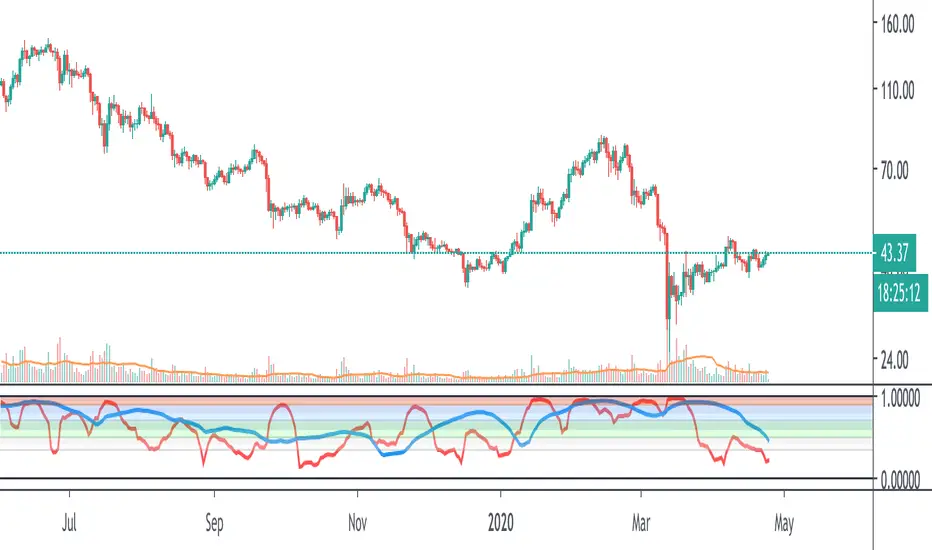
Multi-TF Avg BBandsMULTI-TF AVERAGE BBANDS - with signals (BETA)
Overall, it shows where the price has support and resistance, when it's breaking through, and when its relatively low/high based on the magic of standard deviation.
created by gamazama. send me a shout if u find this useful, or if you create something cool with it.
%BB: The price's position in the boilinger band is converted to a range from 0-1. The midpoint is at 0.5
Description of parameters
"BB:Window Length" is the standard BB size of 20 candles.
The indicator plots up to 7 different %BB's on different timescales
They are calculated independently of the timescale you are viewing eg 12h, 3d, 30m will be the same output
You can enter 7 timescales, eg. if you want to plot a range of bbands of the 12h up to 3d graphs, enter values between 0.5 and 3 (days) - you can also select 0 to disable and use less timescales, or select hours or minutes
Take note if you eg. double the main multiplier to 40, it is the same as doubling all your timescales
You can turn the transparency of the 7 x %BB's to 100 to hide them, their average is plotted as a thick cyan line
"Variance" is a measure of how much the 7 BB's agree, and changes colour based on the thresholds used for the strategy
---- TO START FROM SCRATCH ----
- set all except one to ZERO (0), set to 0, and everything after to 0.
Turn ON and right click -> move the indicator to a new pane - this will show you the internal workings of the indicator.
Then there is a few standard settings
"Source Smoothing Amount" applies a basic small sma on the price.
It should be turned down when viewing candles with less information, like 1D or more.
Standard BBands use an SMA, there one uses a blend between VWMA or SMA
Volume Weight settings, the same as SMA at 0, and the same as VWMA at 1
BB^2 is a bband drawn around the average %BB. Adjust the to change its window length
The BB^2 changes color when price moves up or down
Now its time to look at the parameters which affect the buy/sell signals
turn on "show signal range" - you see some red lines
buy and sell each have 4 settings
min/max variance will affect the brigtness of the signal range
range adjust will move the range up/down
mix BB^2 blends between a straight line (0) and BB^2's top or bottom (1)
a threshold of "variance" and "h/l points" is available to generate weaker signals.
these thresholds can be increased to show more weak signals
ONCE YOU ARE HAPPY WITH THE SIGNALS being generated, you can turn OFF , and move it back to the price pane
the indicator then draws a bband around the price to maps some info into the chart:
fills a colour between 0.5 & the mid BB^2 and converts relative to the price chart
draws a line in the middle of the midband.
controls how much these lines diverge from the price - adjust it to reduce noise
converts the signal range (red lines) to be relative to the price chart
if you like, you can adjust the sell & buy signals in the tab from and to and to match the picture. It messes with auto-scaling when moving back to though
enjoy, I hope that is easy enough to understand, still trying to make this more user-friendly.
If you want to send me some token of appreciation - btc: 33c2oiCW8Fnsy41Y8z2jAPzY8trnqr5cFu
I promise it will put a fat smile on my face
Bollinger Bands (BB)

~RMCF~ 5 Bollinger Bands with EMA/Breakout options5 Configurable Bollinger Bands and custom breakout and reversal confirmation indicators. All settings are able to be edited and tuned to your liking. Default standard deviations for the bands are .5,1,2,2.5,3 and breakout/reversal confirmation standard deviation move pair is 2.9,2.1
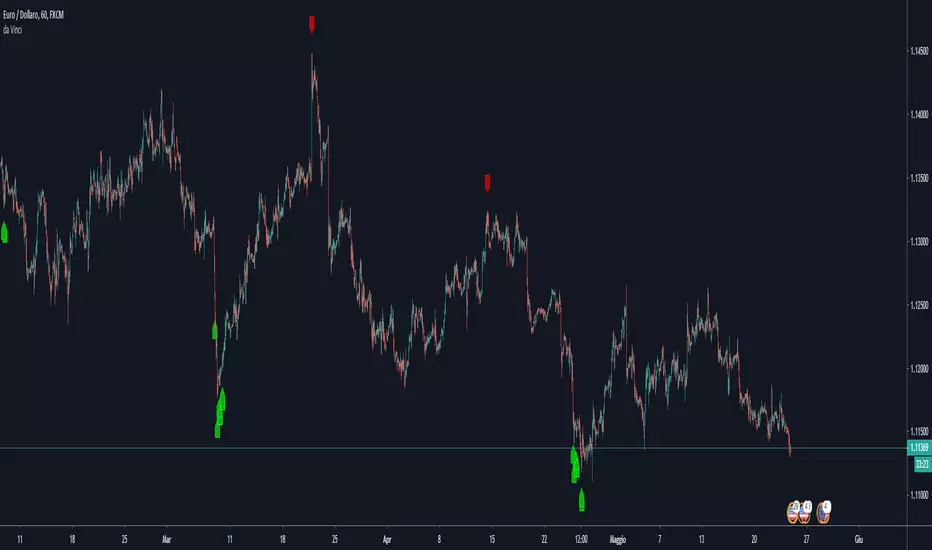
bollinger_TdIts basically a combination of Bollinger Bands and Td Sequentia l.
The best scenario of capturing long and short when candles are outside of BB and TD on its last counts.
Support and resistance will give you an extra idea to go for long or short.
last count of td are highlighted with a different colour.
Avoid going against of trend .
Trend is highlighted by red or green on the SMA.
Works good on charts of 15min and above.
30min
45min
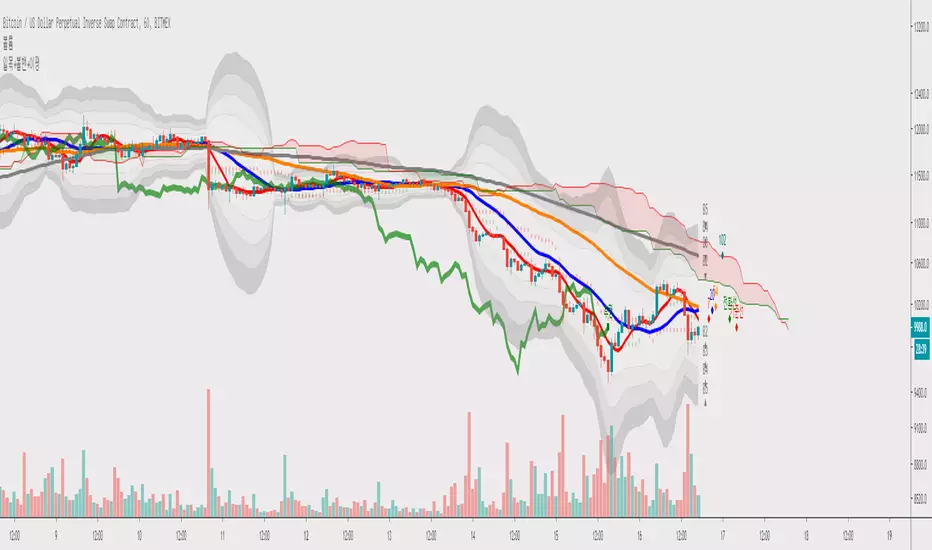
Bohyun's favorite composition by Theo ParkThis indicator contains
8 MA
1 Fibonacci Bollinger Bands
3 Bollinger Bands
2 Ichimokus

Koby's 3 trend indicators AIOAll in one my indicators.
Includes 3 indicators: "KobaMA'ndicator", "MAT_K" and "KFBB".

Koby's Fibonacci Bollinger BandThis is my customized Bolinger Band. Using Fibonacci number, 0.236, 0.382 and 0.618.
HMA base.
Default source using 21 and 5. These also Fibonacci number.
Alpha version. I have created for my follower and SNS group.

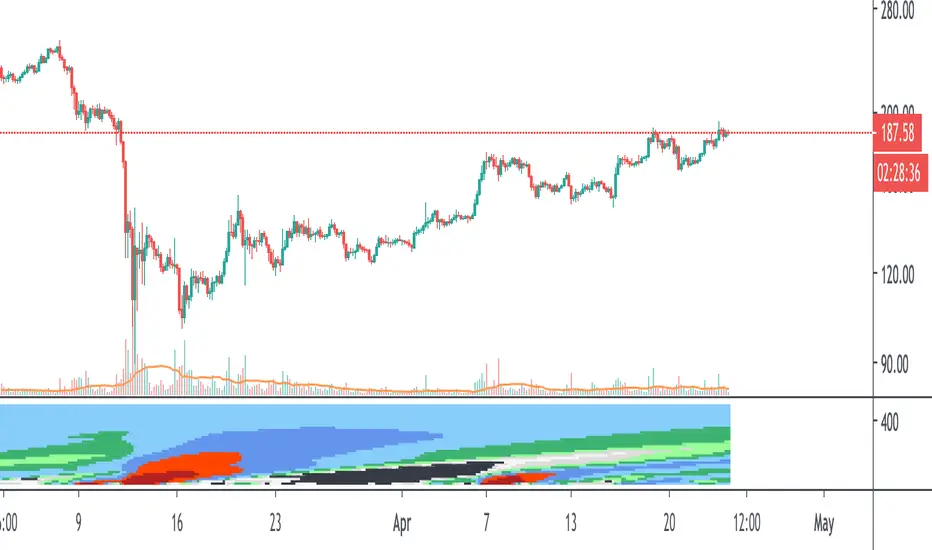
3D-WAVE-PM indicatorThis is an extension of the WAVE-PM indicator as explained by Mark Whistler in his book Volatility Illuminated .
This heatmap represent different lengths of WAVE-PM indicator, starting from 20 and incremented by 15 until 485.
As a reminder, WAVE-PM compare the size of the current distribution to the last 100.
The result is represented as a number between 0 and 1.
The more close to 0, the more contracted the distribution is.
The more close to 1, the more expanded the distribution is.
The color code is the same as my standard WAVE-PM indicator :
Between 0.35 and 0.5 also known as the "Gear change" level => Grey
Between 0.5 and 0.7 also known as the "Consolidation" level => Green
Between 0.7 and 0.9 also known as the "Breakout" level => Blue
Between 0.9 and 1 also known as the "Danger" level => Red
Note that i have colored results below 0.35 as black
Note also that each level has been divided in 2 colors : The light one for the lower half of the range and the dark one for the higher half.
You should resize the indicator window to have a clear and continuous heatmap.
WAVE-PM indicatorThis is the WAVE-PM indicator as described by Mark Whistler in his highly recommend book "Volatility Illuminated"
BAHbO BB,RSI strategyThis script is using Bollinger Bands in combination with Oversold/Overbought RSI 2(20,80).

[AU] 5m BB SMA Dashboard Component5m BB SMA Dashboard Component v01
designed for use in a dashboard view using premium tradingview subscriptions to view 4x/6x/8x charts at once, 5m timeframe per ticker/chart
fast wave caution, sma cross, bollinger + bollinger breakout


Rumpy's McGinley's Dynamic Bollinger Bands and Keltner ChannelUses volume weighted (optional) applied to the McGinley Dynamic for the basis of either a Bollinger Band or Keltner Channel.
When volume weighting is enabled it uses a volume weighted standard deviation to calculate the bollinger width.
Keltner channel also uses the McGinley formula to calculate the ATR used to determine the width of the channel.
Both the 1x and 2x standard dev and ATR multiples had significant PA interaction so both intervals are plotted to the BB and KC.
---------------------------------------
If you find it useful please consider a tip/donation :
BTC - 3BMEXEDyWJ58eXUEALYPadbn1wwWKmf6sA
---------------------------------------
Keltner Channel :

DMISE ResonanceAn attempt to make a timeframe-resonating version of DMI Stochastic Extreme () using @alexgrovers Peak/Valley Estimation script () with Lazybear's MFI/RSI enclosed bollinger bands ()

BB Forecast PrototypeExperiment to try apply @atrader2's MA Forecast () to bollinger bands - didn't exactly work out how I expected it to, especially with the Upper/Lower forecast projections.


ICH+BB+MA_BY_CRYPDOGThis is multiful layout. :)
1. ICHIMOKU BASE LINE + CONVERTER LINE
2. Multiful BB BAND ( MAX 4 )
3. MA / EMA / VMA ( MAX 6 )
4. Color custom / Input number custom
If you have any question dm me.
Thanks!
HARA BB on Stochastic / CCI coded OBVThis indicator contains
- 1 Bollinger Bands based on a Stochastic / CCI coded OBV
- 1 Fibonacci Bollinger Bands based on the Stochastic / CCI coded OBV
Composed by HARA

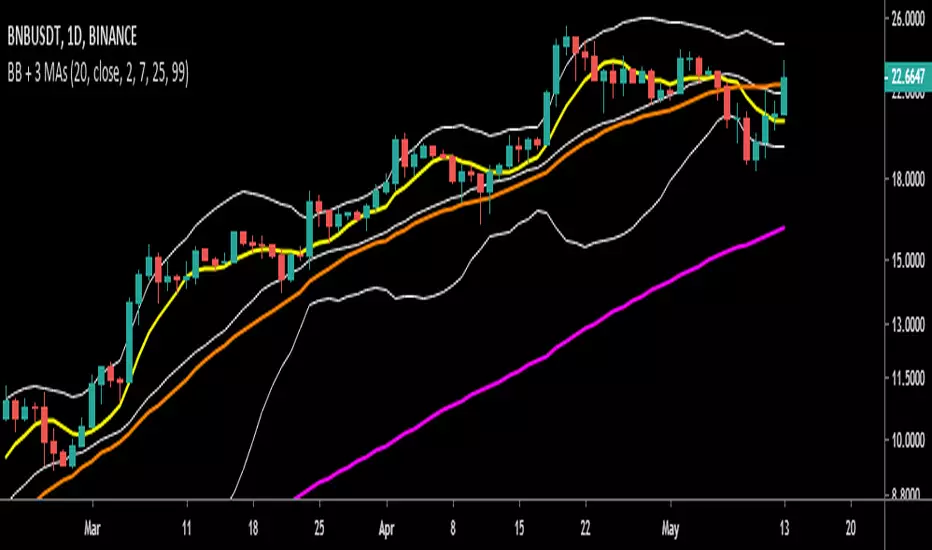
Bollinger Bands and 3 Moving Average lines in one IndicatorThe Bollinger Bands (BB) and 3 Moving Average (MA) lines in ONE indicator.
Default values were employed from Binance settings, which are:
- The BB: MA 20 and multiply by 2.
- The 3 MAs: 7, 25 and 99 periods.
The values can be modified to meet one's strategy.

Dream I Trading Indicator with JSK by Theo Parkthis indicator contains
6 MAs
6 EMAs
3 Bollinger Bands
1 Envelope
1 Ichimoku
1 CM_SlingShotSystem
composed by JSK
