Bollinger Bands Pro : Hawk-Eye (by ImanPJN)Bollinger Bands Pro: Hawk Eye / is a professional version of the Bollinger Band Indicator that uses two bands instead of one. This is the second band I call the upper and lower middle band.
Sometimes you see that the candles are rejected from parts of the band and you do not know the real reason.
The real reason is the middle band, which is a secret line that we show you in Hawk eye and give you a professional and complete view of the trend and momentum of the trend.
This important line gives you the dynamic support and resistance points that were previously hidden from you.
The line also allows traders to pinpoint their entry and exit points, as well as notice that trend strengths or trend momentum are being lost.
Now we want to discuss the trading methods and strategies of this indicator, three main strategies that should be considered, the first is following the trend and the second is breaking the line And third is the Bollinger Bands divergences with the "BB %B" oscillator.
1 - Following the Trend :
You can follow the trend and when a good downtrend or uptrend is formed, enter the trade every time candles hits the middle band and bounces back and you can hold the position it until the middle band or baseline is broken .
2 - Breaking the Line :
When the middle band or baseline as our dynamic trend line is broken with a complete candlestick, we can close the trade or trade the reverse trend, but we recommend that you do not use trend reversal signals if you do not have enough skills.
3 - Bollinger Bands divergences :
We can also use the Bollinger Bands and the BB Percentage Index to find bullish and bullish divergence or overbought and oversold points. But it requires more mastery and research on both indicators
Coded by Iman Pajand in Partnership with @BITEXGroup
Bollingerbandsfilter

Simple Bollinger Bands Toolkit™TradeChartist Simple Bollinger Bands Toolkit is a useful set of Bollinger Bands based utilities, which includes 0 mean %B Oscillator , price volatility based BB Width , actual Bollinger Bands and BB Breakout Signals .
===================================================================================================================
™TradeChartist Simple Bollinger Bands Toolkit Features
================================================
Modified %B Oscillator with 0 as its mean
%B Oscillator Over-Bought (typically values > 80/90/100) and Over-Sold zones (typically values < - 80/-90/-100) can be displayed by enabling Show Over-Sold/Over-Bought Zones .
Highs and Lows of the %B Oscillator are displayed to help visualize Divergences.
BB Width as Price Volatility (BB Upper Band - BB Lower Band) can be displayed to visualize BB Squeeze zones.
Actual Bollinger Bands can be plotted by enabling Display Bollinger Bands . To display on main price chart, just move the BB Toolkit to price chart and merge the scales.
Breakout Signals can be displayed by enabling Display Bollinger Bands and Show BB Breakout Signals . This also displays background fill to help visualize the zones since the breakouts of upper/lower bands happened.
The BB Basis/Mean line is colour coded based on the %B Oscillator (%B>0 - Green, %B<0 - Red).
The Toolkit uses Simple Moving Average (SMA) for the basis line.
The default length is 55 and default Standard Deviation is 1. %B Oscillator can be smoothed (default - 5) using EMA to minimize noise. (Use 20 length and 2 standard deviation for classic Bollinger Bands).
Price Bars on the Main Price chart can be coloured by enabling BB Colour Bars .
===================================================================================================================

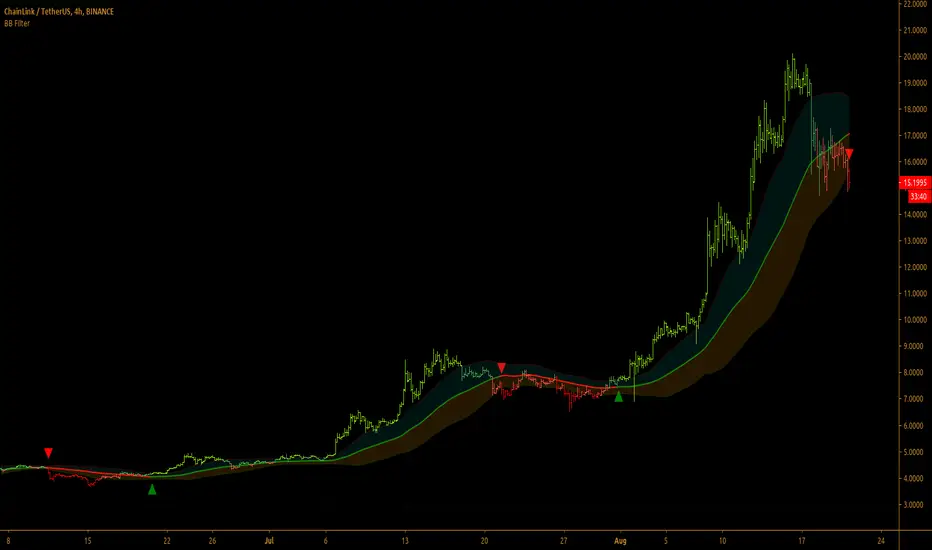
Bollinger Bands Filter
Bollinger Bands is a classic indicator that uses a simple moving average of 20 periods, along with plots of upper and lower bands that are 2 standard deviations away from the basis line. These bands help visualize price volatility and trend based on where the price is, in relation to the bands.
Bollinger Bands filter plots a long signal when price closes above the upper band and plots a short signal when price closes below the lower band. It doesn't take into account any other parameters such as Volume/RSI/ Fundamentals etc, so user must use discretion based on confirmations from another indicator or based on fundamentals.
The filter works great when the price closes above/below upper/lower bands with continuation on next bar. It is definitely useful to have this filter along with other indicators to get early glimpse of breach/fail of bands on candle close during BB squeeze or based on volatility.
This can be used on Heikin Ashi candles for spotting trends, but HA candles are not recommended for trade entries as they don't reflect true price of the asset.
This filter's default is 55 SMA and 1 standard deviation, but these can be changed from settings.
It is definitely worth reading the 22 rules of Bollinger Bands written by John Bollinger.
==================================================================
Note:
1. Alerts can be created for long and short signals using "Once per bar close".
2. The indicator doesn't repaint.
==================================================================