Breaker Blocks | Flux Charts💎 GENERAL OVERVIEW
Introducing our new Volumized Breaker Blocks indicator! This new indicator can render breaker blocks with their volumetric information. It's highly customizable with detection, invalidation and style settings.
Features of the new Volumized Breaker Block indicator :
Render Bullish & Bearish Breaker Blocks
Enable / Disable Volumetric Information
Enable / Disable Historic Zones
Visual Customizability
📌 HOW DOES IT WORK ?
Breaker blocks form when an order block fails, or "breaks". It is often associated with market going in the opposite direction of the broken order block, and they can be spotted by following order blocks and finding the point they get broken, ie. price goes below a bullish order block.
The volume of a breaker block is simply the total volume of the bar that the original order block is broken.
🚩UNIQUENESS
This indicator can not only detect breaker blocks, but it can also detect them with their volumetric information. Volumetric information can be crucial when considering an breaker block's strength, which can be a crucial form of confluence in certain trading strategies.
⚙️SETTINGS
1. General Configuration
Volumetric Info -> The volumetric information of the Breaker Blocks will be rendered if activated.
Zone Invalidation -> Select between Wick & Close price for Breaker Block Invalidation.
Swing Length -> Swing length is used when finding breaker block formations. Smaller values will result in finding smaller breaker blocks.
Breakerblock

Price Action Toolkit | Flux Charts💎 GENERAL OVERVIEW
Introducing our new Price Action Toolkit indicator! Price Action Toolkit integrates key level strategy , traditional supply-demand analysis , and market structures to help traders in their decisions. Now with features that are available to use in multiple timeframes!
Features of the new Price Action Toolkit indicator :
Volumized Fair Value Gaps (FVGs)
Volumized Order & Breaker Blocks
Identification of Market Structures
Equal Highs & Lows
Buyside & Sellside Liquidity
Premium & Discount Zones
MTF Highs & Lows (Daily, Weekly, Monthly, Pre-Market)
Customizable Settings
📌 HOW DOES IT WORK ?
We believe that the analytical elements that are within this indicator work best when they co-exist with each other on the chart. Trading often requires taking multiple elements into consideration for better accuracy on market analysis. Thus, we combined some of the useful strategies in one indicator for ease of use.
1. Volumized Fair Value Gaps
Fair value gaps often occur when there is an imbalance in the market, and can be spotted with a specific formation on the chart.
The volume when the FVG occurs plays an important role when determining the strength of it, so we've placed two bars on the FVG zone, indicating the high & low volumes of the FVG. The high volume is the total volume of the last two bars on a bullish FVG, while the low volume is - of the FVG. For a bearish FVG, the total volume of the last two bars is the low volume. The indicator can also detect FVGs that exist in other timeframes than the current chart.
2. Volumized Order Blocks
Order blocks occur when there is a high amount of market orders exist on a price range. It is possible to find order blocks using specific formations on the chart.
The high & low volume of order blocks should be taken into consideration while determining their strengths. The determination of the high & low volume of order blocks are similar to FVGs, in a bullish order block, the high volume is the last 2 bars' total volume, while the low volume is the oldest bar's volume. In a bearish order block scenerio, the low volume becomes the last 2 bars' total volume.
3. Volumized Breaker Blocks
Breaker blocks form when an order block fails, or "breaks". It is often associated with market going in the opposite direction of the broken order block, and they can be spotted by following order blocks and finding the point they get broken, ie. price goes below a bullish order block.
The volume of a breaker block is simply the total volume of the bar that the original order block is broken. Often the higher the breaking bar's volume, the stronger the breaker block is.
4. Market Structures
Sometimes specific market structures form and break as the market fills buy & sell orders. Formed Change of Character (CHoCH) and Break of Structure (BOS) often mean that market will change direction, and they can be spotted by inspecting low & high pivot points of the chart.
5. Equal Highs & Lows
Equal Highs & Lows occur when there is a significant amount of difference between a candle's close price and it's high / low value, and it happens again in a specific range. EQH and EQL usually mean there is a resistance that blocks the price from going further up / down.
6. Buyside & Sellside Liquidity
Buyside & Sellside Liquidity zones are where most traders place their take-profits and stop-losses in their long / short positions. They are spotted by using high & low pivot points on the chart.
7. Premium & Discount Zones
The premium zone is a zone that is over the fair value of the asset's price, and the discount zone is the opposite. They are formed by the latest high & low pivot points.
8. MTF Highs / Lows
MTF Highs / Lows are actually pretty self-explanatory, you can enable / disable Daily, Weekly, Monthly & Pre-Market Highs and Lows.
🚩UNIQUENESS
Our new indicator offers a comprehensive toolkit for traders, combining multiple analytical elements with customizable settings to aid in decision-making across different market conditions and timeframes. The volumetric information of both FVGs and Order & Breaker Blocks will be present in your chart to serve you greater detail about them. The indicator also efficiently identifies market structures, liquidity zones and premium & discount zones to give you an insight about the current state of the market. And finally with the use of multiple timeframes , you can easily take a look at the bigger picture. We recommend reading the "How Does It Work" section of the descripton to get a better understanding about how this indicator is unique to others.
⚙️SETTINGS
1. General Configuration
Show Historic Zones -> This will show historic Fair Value Gaps, Order & Breaker Blocks and Sellside & Buyside liquidities which are expired.
2. Fair Value Gaps
Enabled -> Enables / Disables Fair Value Gaps
Volumetric Info -> The volumetric information of the FVG Zones will be rendered if activated.
Zone Invalidation -> Select between Wick & Close price for FVG Zone Invalidation.
Zone Filtering -> With "Average Range" selected, algorithm will find FVG zones in comparison with average range of last bars in the chart. With the "Volume Threshold" option, you may select a Volume Threshold % to spot FVGs with a larger total volume than average.
FVG Detection -> With the "Same Type" option, all 3 bars that formed the FVG should be the same type. (Bullish / Bearish). If the "All" option is selected, bar types may vary between Bullish / Bearish.
Detection Sensitivity -> You may select between Low, Normal or High FVG detection sensitivity. This will essentially determine the size of the spotted FVGs, with lower sensitivies resulting in spotting bigger FVGs, and higher sensitivies resulting in spotting all sizes of FVGs.
3. Order Blocks
Enabled -> Enables / Disables Order Blocks
Volumetric Info -> The volumetric information of the Order Blocks will be rendered if activated.
Zone Invalidation -> Select between Wick & Close price for Order Block Invalidation.
Swing Length -> Swing length is used when finding order block formations. Smaller values will result in finding smaller order blocks.
4. Breaker Blocks
Enabled -> Enables / Disables Breaker Blocks
Volumetric Info -> The volumetric information of the Breaker Blocks will be rendered if activated.
Zone Invalidation -> Select between Wick & Close price for Breaker Block Invalidation.
5. Timeframes
You can set and enable / disable up to 3 timeframes. Note that only higher timeframes than the current chart will work.
6. Market Structures
Break Of Structure ( BOS ) -> If the current structure of the market is broken in a bullish or bearish direction, it will be displayed.
Change Of Character ( CHoCH ) -> If the market shifts into another direction, it will be displayed.
Change Of Character+ ( CHoCH+ ) -> This will display stronger Change Of Characters if enabled.
7. Equal Highs & Lows
EQH -> Enables / Disables Equal Highs.
EQL -> Enables / Disables Equal Lows.
ATR Multiplier (0.1 - 1.0) -> Determines the maximum difference between highs / lows to be considered as equal. Lower values will result in more accurate results.
8. Buyside & Sellside Liquidity
Zone Width -> Determines the width of the liquidity zones, 1 = 0.025%, 2 = 0.05%, 3 = 0.1%.
9. Premium & Discount Zones
Enabled -> Enables / Disables Premium & Discount Zones.
10. MTF Highs / Lows
You can enable / disable Daily, Weekly, Monthly & Pre-Market Highs and Lows using this setting. You can also switch their line shapes between solid, dashed and dotted.

Breaker Blocks with Signals [LuxAlgo]The Breaker Blocks with Signals indicator aims to highlight a complete methodology based on breaker blocks. Breakout signals between the price and breaker blocks are highlighted and premium/discount swing levels are included to provide potential take profit/stop loss levels.
This script also includes alerts for each signal highlighted.
🔶 SETTINGS
🔹 Breaker Blocks
Length: Sensitivity of the detected swings used to construct breaker blocks. Higher values will return longer term breaker blocks.
Use only candle body: Only use the candle body when determining the maximum/minimum extremities of the order blocks.
Use 2 candles instead of 1: Use two candles to confirm the occurrence of a breaker block.
Stop at first break of center line: Do not highlight breakout signals after invalidation until reset.
🔹 PD Array
Only when E is in premium/discount zone: Only set breaker block if point E of wave ABCDE is within the corresponding zone.
Show premium discount zone: Show premium/discount zone.
Highlight Swing Break: Highlight occurrences of price breaking a previous swing level.
Show Swings/PD Arrays: Show swing levels/labels and pd areas.
🔶 USAGE
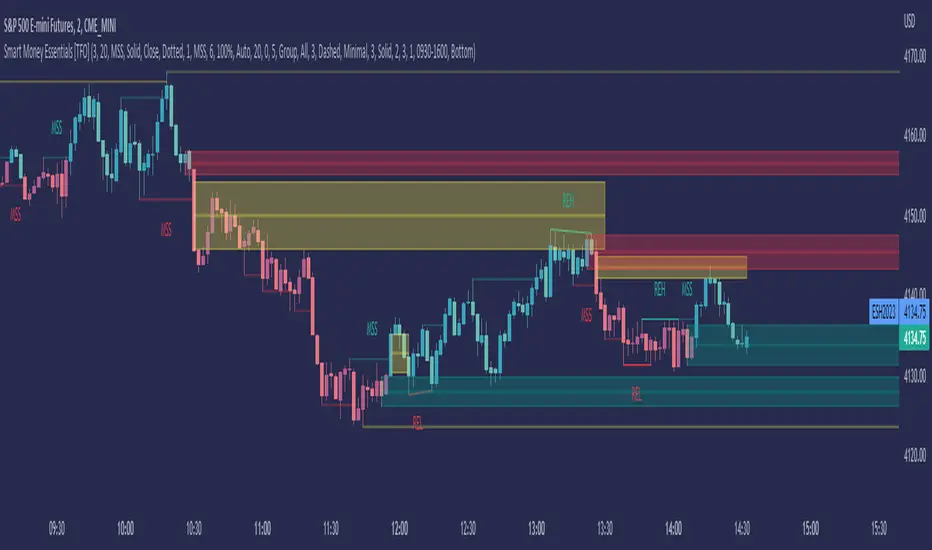
The Breaker Blocks with Signals indicator aims to provide users with a minimalistic display alongside optimal signals to be aware of for finding trade setups as shown below.
Here we can see a MSS occurred allowing the indicator to detect a Breaker Block (-BB) & display a red arrow to confirm this signal.
The signal(s) that can be used for potential entries are only during retests of the breaker blocks.
A potential strategy traders could use with this indicator is to target the corresponding Discount PD Arrays detected (for a short position) and Premium PD Arrays (for a long position).
In the image above we can see price generated the potential entry signals in orange & fell to the Discount PD Arrays as a logical setup to look for with this indicator.
As we can see in the image above, signals can be considered invalid when price closes above the 50% level in which it would be suggested to wait for another setup.
Users still looking for more potential setups based on the same breaker block can disable the "Stop at first break of center line" setting within the settings menu.
In the image above we can see a bullish example whereas price confirmed a bullish breaker block (+BB), had a quick pullback into it that was confirmed by the green arrow, and then reached the Premium PD Arrays.
While retests of breaker blocks can still function well if they occur later in the price action, it's most preferable for users to look for entry signals that are near confirmed breaker blocks (5-10 bars) opposed to waiting 20+ bars.
Additional take profits based on the occurence of the breaker blocks are given in order to provide targets after the occurence of a breaker block breakout.
🔶 DETAILS
Breaker blocks are formed after a mitigated order block, these can provide change of polarity opportunities, thus playing a role as a potential support/resistance. It is the re-test/retrace of price to a breaker block that will set the conditions to provide signals.
The above chart describes the creation of a breaker block.
The signal generation logic makes use of various rules described below:
Bullish Breaker Blocks:
opening price is within the breaker block, while the closing price is above the upper extremity of the breaker block.
Price did not cross the breaker block average in the interval since the previous breakout.
Bearish Breaker Blocks:
opening price is within the breaker block, while the closing price is below the lower extremity of the breaker block.
Price did not cross the breaker block average in the interval since the previous breakout.
When a new pattern is formed, all previous drawings are removed.
🔶 RELATED SCRIPTS

Order Blocks & Breaker Blocks [LuxAlgo]The Order Blocks & Breaker Blocks indicator detects order blocks that can be turned into breaker blocks on the chart automatically once mitigated.
Users can determine the amount of bullish and bearish order/breaker blocks that display on their chart from within the settings menu.
🔶 SETTINGS
Swing Lookback: Lookback period used for the detection of the swing points used to create order blocks.
Show Last Bullish OB: Number of the most recent bullish order/breaker blocks to display on the chart.
Show Last Bearish OB: Number of the most recent bearish order/breaker blocks to display on the chart.
Use Candle Body: Allows users to use candle bodies as order block areas instead of the full candle range.
🔹 Style
Show Historical Polarity Changes: Allows users to see labels indicating where a swing high/low previously occurred within a breaker block.
🔶 USAGE
We have published several scripts covering the detection of order blocks previously, however, the concept of breaker blocks was not yet introduced.
When price mitigates an order block, a breaker block is confirmed. We can eventually expect price to trade back to this breaker block offering a new trade opportunity.
We can see that this is similar to a change in polarity, where a support becomes a resistance after a breakout and vice versa.
This script highlights regular order blocks as solid extended areas on the chart and breaker blocks as dashed lines with dual-colored areas. The color change and dashed line starts at the location where the order block was mitigated.
Using a higher "Swing Lookback" setting will return longer term order/breaker blocks on the chart.
Users can optionally enable "Historical Polarity Changes" labels within the settings menu to see where breaker blocks might have provided an effective trade setup previously.
The "Historical Polarity Changes" setting is disabled by default & is most effective using replay mode as the labels are backpainted.
The order blocks & breaker blocks themselves can be used in real-time as they are detected based on the swing length & previous breaker blocks being mitigated.

Smart Money Essentials [TFO]This indicator utilizes “Smart Money Concepts” like liquidity, order blocks, premium & discount, and more to analyze price action.
What’s included in the initial release:
Market Structure
Liquidity
Displacement
Order Blocks
Premium / Discount
Confluence Table
Alerts
Market structure logic objectively identifies whether the current trend is bullish or bearish, based on swing highs and lows. Liquidity levels offer insight into major pivots where we can assume many traders may place their stop loss, which can also serve as areas where “Smart Money” may be accumulating or distributing positions.
Displacement adds to this by spotting rapid price movement, often accompanied by imbalances where price may come back to before continuing in the direction of the displacement. These can be filtered based on whether the imbalance is accompanied by a Break of Structure (BOS) or Market Structure Shift (MSS), which may give additional insight into the draw on liquidity.
Order blocks (OB’s) are detected and treated as areas that may offer support for price in an uptrend or resistance in a downtrend. Premium and discount zones are essentially fitted by an “auto-fib” retracement that looks at recent liquidity levels, and optionally offers areas to look for an Optimal Trade Entry (OTE) where price retraces between 62-79% of the preceding displacement leg.
The confluence table provides an organized place to visualize and identify where any of the above concepts may be present at or around the same time. We can implement a threshold where, if the number of selected factors meets or exceeds this threshold, we can potentially identify bullish and bearish opportunities where multiple layers of confluence are overlapping.
And of course, alerts are built in for all significant events related to the above concepts, for example: runs on liquidity, BOS and MSS, rejections from OB and OTE, etc.
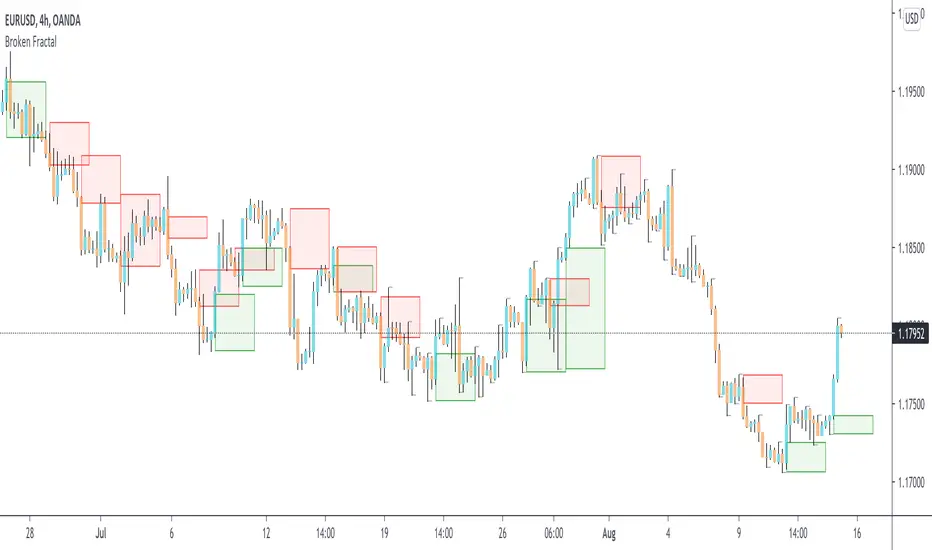
Broken Fractal : Someone's broken dream is your profit!Idea
The idea is simple : when market turns around, it traps a bunch of traders off guard. We trade with them, in the same direction of their exit!
Method
We let the market first create a fractal
We then let the market create an opposite fractal
We then let the market break the first fractal it created, thereby trapping lots of trades in the process
We then patiently wait till the market gives these trapped traders a chance to exit - and we trade in the same direction
How to use?
Green boxes are for long entry, red boxes are for short.
Whenever a box appears, that's the risk criteria - setup limit orders and trade along!
Works on all timeframes
If you like this script, please leave a note on how you are using it.
I personally use it with Higher Timeframe bias.
PS1 : some traders call this Break of market structure, some call it Breaker, I just call it "Broken Fractal"
PS2 : Break of a broken fractal is also very potent. Watch out for those!
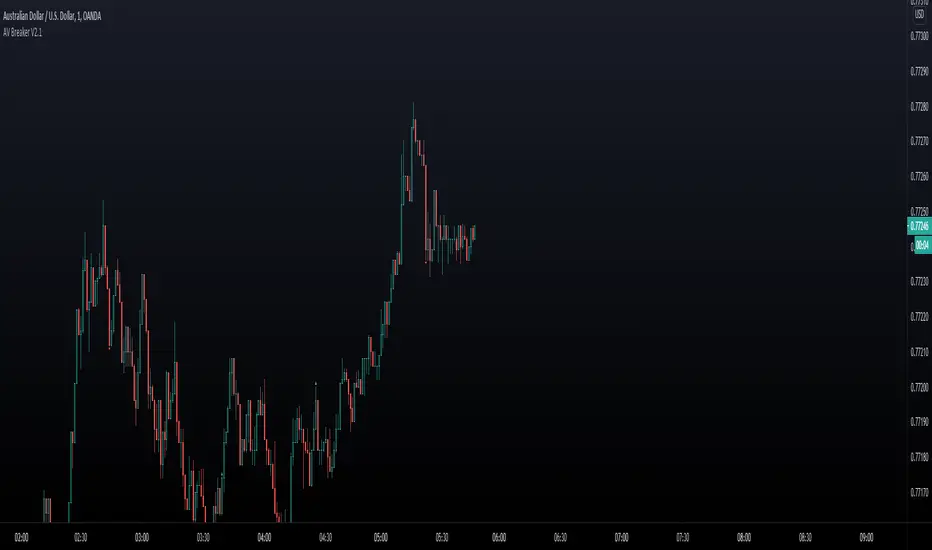
THE AV BREAKERTHE SHARKFIN
The AV Breaker uses a TDI to define sharkfins. You can set it up so it only
alert sharkfins at a specific level. Like 70/30 above/below. Or at anytime
it sharkfin the upper/lower band (Not using any level criteria.)
THE BREAKER
A breaker happens when an order block is taken out after a sharkfin setup.
This gives a HIGH probabillity reversal signal. If used with your own
higher Timeframe strategy.
THE ALERTS
The AV Breaker has built in Alert Function. You can however tell The AV breaker
what hours you want to see the alerts. You can also color the chart with a click
of a button during your alert hours session.
The Alert Session Plotted on Chart uses New York Time.
Settings:
- Time Session (Between what hours you want alert to be active)
- Highlight Session Range If you want chart to color selected "Time Sessiion Hours"
- Number of candles in The Order Block (Set your requirement for an Order Block)
TDI Settings: (The TDI do not need to be added to chart, but can be handy visually to add)
- TDI Low Level: 30 Default
- TDI High Level: 70 Default
- Use High/Low TDI Levels (If sharkfin has to be created above/below choosen TDI Level)
-- (Plus you can set any number on The TDI (Bands, RSI, MA's etc) --
How to use:
How you use it is up to you. However upon signal of The Breaker it can be good to wait
for a pullback to breaking opposite candle, or use a simple ABC 50% Fibs or similar.
Block_Saver_v1This is a script that lets you manually add in a "Zone" by top and bottom price, which I intended to use so I could "Save" or "Trace Over" lines from the Breakers/OrderBlock indicator. This is so you can take the same drawing across different time-frames and charts, and color-code them.
In the future I will be adding labels to the top and/or bottom of blocks so you can annotate more specifically which time-frame they were formed on, price level, etc.

[astropark] Breaker Blocks, Supply Demand Order BlocksDear Followers,
today a new powerful indicator! Welcome to the great world of Breaker Blocks (BB) and Supply-Demand Order Blocks !
So what's the point? As always, the point is how to trade as safer as possible!
Breaker Blocks are price ranges where you simply have to wait for a pullback and sell-buy on its touch and price bounce, like in the screenshot below:
Supply and Demand are very important concepts, synonymous of Support and Resistance in most cases.
You should never sell whenever near a demand/support zone, unless price breaks through it as too weak. The same for supply/resistance: you should not buy near resistance, as most times you may start a trade with very high losing risk.
Here a screenshot how indicator works showing supply and demand order blocks (just enable them from indicator's option):
This indicator
can analyze chart based on high-low candle prices or open-close one
can show you Breaker Blocks (BB)
can show you Supply & Demand Order Blocks (OB)
lets you decide if you want to see high-low or open-close range of each OB
lets you edit the analysis window
lets you see local tops and bottoms of price as labels
This is a premium indicator , so send me a private message in order to get access to this script .
