Advanced Breakout System v2.0Advanced Breakout System v2.0
Developed by: Mohammed Bedaiwi
This script hunts for high-probability breakouts by combining price consolidation zones, volume spikes vs. average volume, smart money flow (OBV), and a Momentum Override for explosive moves that skip consolidation. Additionally, it automatically identifies and plots Support and Resistance levels with price labels to help you visualize market structure.
The system follows a "Watch & Confirm" logic: it first prints a WATCH setup, then a BUY only if price confirms strength.
💡 JUSTIFICATION OF CONCEPTS (MASHUP & ORIGINALITY)
This script is an original mashup combining several analytical concepts to address common breakout failures:
Volatility Compression Engine: Uses built-in functions like ta.highest() and ta.lowest() to mathematically define the setup phase where price volatility is compressed below a user-defined threshold.
Volume Spike Confirmation: The breakout must be confirmed by a volume increase greater than a moving average of volume, signaling strong market interest.
Smart Volume Filter (OBV): This is the key component. By checking if ta.obv is above its own Moving Average, we confirm that accumulation has been occurring during the consolidation period, suggesting institutional positioning before the price break.
Multi-Exit Risk System: Employs dynamic exits (EMA cross, volume dump, bearish pattern) instead of static stop-losses to manage risk adaptively based on real-time market action.
Market Structure Visualization: The script also includes a Support & Resistance engine to plot key swing pivots and price labels for visual context.
✅ STRATEGY RESULTS & POLICY COMPLIANCE
To ensure non-misleading and transparent backtesting results, this strategy is published with the following fully compliant properties:
Dataset Compliance: The backtest is performed on the CMTL Daily (1D) chart across a long history, generating 201 total trades. This significantly exceeds the minimum requirement of 100 trades, providing a robust test dataset.
Risk Control: The strategy uses a conservative order size set to 2% of equity (default_qty_value=2), strictly adhering to the sustainable risk recommendation of 5-10% of equity per trade.
Transaction Costs: Realistic trading conditions are modeled using 0.07% commission and 3 ticks slippage to prevent the overestimation of profitability.
⚙️ VISUAL GUIDE & SIGNAL LOGIC
Key Color Legend (Visual Guide):
WATCH – Setup (Yellow Arrow Down): Potential breakout setup detected.
BUY – Confirmation (Green Arrow Up): Confirmed breakout, triggered when price trades above the high of the WATCH candle.
SELL – Break (Orange Arrow): Short-term trend weakness, triggered when price closes below the Fast EMA (9).
SELL – Dump (Dark Red Arrow): Distribution / volume dump, triggered by a bearish candle with abnormally high volume.
SELL – Pattern (Purple Arrow): Bearish price-action pattern (such as a bearish engulfing).
Support & Resistance Lines (Red/Green): Small horizontal lines plotted at key swing points with exact price labels.
⌨️ INPUTS (DEFAULT SETTINGS)
Entry settings: Consolidation Lookback (default 20) = bars used to detect consolidation. Consolidation Range % (default 12%) = max allowed range size. Volume Spike Multiplier (default 1.2) = factor above average volume to count as a spike. Force Signal on Big Moves (default ON) = forces a WATCH signal on high-momentum moves.
Exit settings: Enable Fast Exit (EMA 9) toggles the SELL – Break signal. Dump Volume Multiplier defines what counts as “dump” volume.
Support & Resistance: Adjustable Pivot Left/Right bars control the sensitivity of the support and resistance lines.
⚠️ Disclaimer Trading involves significant risk of loss. This script is for educational and informational purposes only and is not financial advice or a recommendation to buy or sell any asset. BUY and SELL signals are rule-based and derived from historical behavior and do not guarantee future performance. Always use your own analysis and risk management. This is an open-source strategy; users are encouraged to test it across different symbols and timeframes.
Breakouttrading

Candle Breakout StrategyShort description (one-liner)
Candle Breakout Strategy — identifies a user-specified candle (UTC time), draws its high/low range, then enters on breakouts with configurable stop-loss, take-profit (via Risk:Reward) and optional alerts.
Full description (ready-to-paste)
Candle Breakout Strategy
Version 1.0 — Strategy script (Pine v5)
Overview
The Candle Breakout Strategy automatically captures a single "range candle" at a user-specified UTC time, draws its high/low as a visible box and dashed level lines, and waits for a breakout. When price closes above the range high it enters a Long; when price closes below the range low it enters a Short. Stop-loss is placed at the opposite range boundary and take-profit is calculated with a user-configurable Risk:Reward multiplier. Alerts for entries can be enabled.
This strategy is intended for breakout style trading where a clearly defined intraday range is established at a fixed time. It is simple, transparent and easy to adapt to multiple symbols and timeframes.
How it works (step-by-step)
On every bar the script checks the current UTC time.
When the first bar that matches the configured Target Hour:Target Minute (UTC) appears, the script records that candle’s high and low. This defines the breakout range.
A box and dashed lines are drawn on the chart to display the range and extended to the right while the range is active.
The script then waits for price to close outside the box:
Close > Range High → Long entry
Close < Range Low → Short entry
When an entry triggers:
Stop-loss = opposite range boundary (range low for longs, range high for shorts).
Take-profit = entry ± (risk × Risk:Reward). Risk is computed as the distance between entry price and stop-loss.
After entry the range becomes inactive (waitingForBreakout = false) until the next configured target time.
Inputs / Parameters
Target Hour (UTC) — the hour (0–23) in UTC when the range candle is detected.
Target Minute — minute (0–59) of the target candle.
Risk:Reward Ratio — multiplier for computing take profit from risk (0.5–10). Example: 2 means TP = entry + 2×risk.
Enable Alerts — turn on/off entry alerts (string message sent once per bar when an entry occurs).
Show Last Box Only (internal behavior) — when enabled the previous box is deleted at the next range creation so only the most recent range is visible (default behavior in the script).
Visuals & On-chart Info
A semi-transparent blue box shows the recorded range and extends to the right while active.
Dashed horizontal lines mark the range high and low.
On-chart shapes: green triangle below bar for Long signals, red triangle above bar for Short signals.
An information table (top-right) displays:
Target Time (UTC)
Active Range (Yes / No)
Range High
Range Low
Risk:Reward
Alerts
If Enable Alerts is on, the script sends an alert with the following formats when an entry occurs:
Long alert:
🟢 LONG SIGNAL
Entry Price:
Stop Loss:
Take Profit:
Short alert:
🔴 SHORT SIGNAL
Entry Price:
Stop Loss:
Take Profit:
Use TradingView's alert dialog to create alerts based on the script — select the script’s alert condition or use the alert() messages.
Recommended usage & tips
Timeframe: This strategy works on any timeframe but the definition of "candle at target time" depends on the chart timeframe. For intraday breakout styles, use 1m — 60m charts depending on the session you want to capture.
Target Time: Choose a time that is meaningful for the instrument (e.g., market open, economic release, session overlap). All times are handled in UTC.
Position Sizing: The script’s example uses strategy.percent_of_equity with 100% default — change default_qty_value or strategy settings to suit your risk management.
Filtering: Consider combining this breakout with trend filters (EMA, ADX, etc.) to reduce false breakouts.
Backtesting: Always backtest over a sufficiently large and recent sample. Pay attention to slippage and commission settings in TradingView’s strategy tester.
Known behavior & limitations
The script registers the breakout on close outside the recorded range. If you prefer intrabar breakout rules (e.g., high/low breach without close), you must adjust the condition accordingly.
The recorded range is taken from a single candle at the exact configured UTC time. If there are missing bars or the chart timeframe doesn't align, the intended candle may differ — choose the target time and chart timeframe consistently.
Only a single active position is allowed at a time (the script checks strategy.position_size == 0 before entries).
Example setups
EURUSD (Forex): Target Time 07:00 UTC — captures London open range.
Nifty / Index: Target Time 09:15 UTC — captures local session open range.
Crypto: Target Time 00:00 UTC — captures daily reset candle for breakout.
Risk disclaimer
This script is educational and provided as-is. Past performance is not indicative of future results. Use proper risk management, test on historical data, and consider slippage and commissions. Do not trade real capital without sufficient testing.
Change log
v1.0 — Initial release: range capture, box and level drawing, long/short entry by close breakout, SL at opposite boundary, TP via Risk:Reward, alerts, info table.
If you want, I can also:
Provide a short README version (2–3 lines) for the TradingView “Short description” field.
Add a couple of suggested alert templates for the TradingView alert dialog (if you want alerts that include variable placeholders).
Convert the disclaimer into multiple language versions.

AM Range Sniper [jmaxxx]AM Range Sniper
Overview
AM Range Sniper is a sophisticated morning session trading strategy designed for Micro E-mini Nasdaq-100 Index Futures (MNQ). This strategy capitalizes on the critical 8:30-9:30 AM EST range formation period, implementing precise entry and exit mechanics with advanced risk management.
Key Features
🕐 Time-Based Range Analysis
Range Definition: Automatically identifies and tracks the 8:30-9:30 AM EST range
Trading Window: Active trading from 9:30 AM to 11:00 AM EST (extended for second chance trades)
Session Management: Daily reset ensures clean state for each trading session
🎯 Multiple Entry Patterns
Breakthrough/Retest: Captures price breakthroughs above range with retest opportunities
Long/Short Opportunities: Comprehensive coverage of both directional moves
Breakdown: Identifies bearish breakdowns below range support
Break Up: Detects bullish breakups above range resistance
Range Sweeps: Monitors for range high/low sweeps with reversal entries
⚡ Advanced Risk Management
Configurable Stop Losses: Tick-based stop losses for each trade type
Take Profit Targets: Automatic target calculations based on range size
Hard Close Protection: Automatic position closure at 4 PM EST
Second Chance Feature: Optional second trade opportunity if first trade loses
🔧 Professional Features
Visual Stop Loss Lines: Real-time stop loss visualization on chart
Debug Information Panel: Comprehensive status monitoring
Alert Integration: Customizable alert messages for entries/exits
Flexible Time Settings: Adjustable for different timezones
Strategy Logic
Range Formation (8:30-9:30 AM)
The strategy monitors the first hour of trading to establish the day's range. This range serves as the foundation for all subsequent trading decisions.
Entry Conditions
Breakthrough: Price breaks above range high with retest rejection
Breakdown: Price breaks below range low with confirmed bearish momentum
Break Up: Price breaks above range high with strong bullish confirmation
Sweep Entries: Range high/low sweeps followed by reversal signals
Risk Management
Stop Loss: Configurable tick-based stops for each trade type
Take Profit: 1.5x range size targets for breakdown/breakup trades
Position Sizing: Percentage-based position sizing
Session Limits: Maximum 2 trades per session (with second chance feature)
Settings & Customization
Core Parameters
Enable/disable individual entry patterns
Configurable stop loss levels (1-500 ticks)
Second chance feature toggle
Previous day level integration
Visual Customization
Customizable stop loss colors and widths
Debug panel visibility
Range line styling
Alert Configuration
Custom entry/exit alert messages
***** Automate With *****
APEX
NinjaTrader
Crosstrade.io ( promo code JMAXXX )
Performance & Reliability
Precision Focused: Waits for high-probability setups
Risk-Aware: Comprehensive stop loss and position management
Session-Based: Clean daily resets prevent carryover issues
Professional Grade: Designed for serious traders
Ideal For
Day Traders: Morning session specialists
Futures Traders: MNQ and similar instruments
Range Traders: Traders who capitalize on range breakouts
Risk-Conscious Traders: Those who prioritize risk management
Disclaimer
This strategy is for educational and informational purposes. Past performance does not guarantee future results. Always test thoroughly on historical data and paper trading before live implementation. Risk management is crucial - never risk more than you can afford to lose.
Created by jmaxxx - Professional trading strategy developer
For questions, feedback, or customization requests, please leave a comment below.

Smart Money Breakout & Order Block StrategySmart Money Breakout & Order Block Strategy
Created by Shubham
This strategy was developed by Shubham, designed to provide traders with a structured approach to smart money trading by combining breakout entries and order block reversals. It focuses on liquidity zones, volatility filters, and ATR-based stop management to adapt to different market conditions.
🔹 Strategy Overview
The Smart Money Breakout & Order Block Strategy is built for traders who want to identify institutional moves while avoiding false breakouts. This non-repainting strategy helps traders detect:
✅ Momentum Breakouts – Price breaking key support & resistance levels.
✅ Order Block Reversals – Institutional buying & selling zones.
✅ Dynamic Stop Management – No fixed SL/TP; uses ATR-based trailing stops.
✅ Volatility Filtering – Avoids choppy market conditions.
🔹 Trading Logic
1️⃣ Breakout Trading (Momentum Entries)
Long Entry: When price breaks above resistance with high volatility.
Short Entry: When price breaks below support with high volatility.
2️⃣ Order Block Reversals (Liquidity Entries)
Bullish Order Block: A strong price rejection after consecutive bearish candles signals smart money accumulation, triggering a long trade.
Bearish Order Block: A strong price rejection after consecutive bullish candles signals smart money distribution, triggering a short trade.
3️⃣ Volatility Filter (False Signal Prevention)
Uses normalized volatility to ensure breakouts are backed by strong momentum.
Helps filter out low-volume, choppy market conditions.
4️⃣ ATR-Based Position Management (Dynamic Stops & Trailing Stop)
No fixed SL/TP → Uses ATR-based stop-loss to adapt to market volatility.
Implements a trailing stop for maximizing potential profits in trending markets.
🔹 Key Features
✔️ Developed by Shubham – Designed for precision trading with institutional techniques.
✔️ Smart Money Concept – Identifies liquidity zones, breakouts, and order blocks.
✔️ Volatility Filter – Prevents false breakouts by analyzing market momentum.
✔️ ATR-Based Dynamic Stops – No fixed SL/TP, making it more adaptive.
✔️ Trailing Stop Functionality – Allows profits to run while reducing risk.
✔️ Fully Automated Execution – Uses TradingView’s strategy functions for automatic trade placement and exits.
✔️ Commission-Adjusted Backtesting – Includes realistic commission settings to ensure accurate results.
📊 Backtesting & Realistic Expectations
✅ Best for Higher Timeframes (1H, 4H, Daily) – Avoids market noise.
✅ Most Effective in Trending & Volatile Markets – Crypto, forex, indices, and commodities.
✅ Performance Varies with Market Conditions – Works best in strong trends.
✅ No Unrealistic Promises – Strategy performance is dependent on market behavior and risk management.
📌 IMPORTANT DISCLAIMER:
This strategy is provided for educational purposes only and should not be considered financial advice. Past performance in backtesting does not guarantee future results. Users should conduct their own research before applying this strategy in live markets.
🚀 Developed by Shubham – Test it yourself and see how it performs! 🚀

Qullamaggie [Modified] | FractalystWhat's the purpose of this strategy?
The strategy aims to identify high-probability breakout setups in trending markets, inspired by Kristjan "Qullamaggie" Kullamägi’s approach.
It focuses on capturing explosive price moves after periods of consolidation, using technical criteria like moving averages, breakouts, trailing stop-loss and momentum confirmation.
Ideal for swing traders seeking to ride strong trends while managing risk.
----
How does the strategy work?
The strategy follows a systematic process to capture high-momentum breakouts:
Pre-Breakout Criteria:
Prior Price Surge: Identifies stocks that have rallied 30-100%+ in recent month(s), signaling strong underlying momentum (per Qullamaggie’s volatility expansion principles).
Consolidation Phase: Looks for a tightening price range (e.g., flag, pennant, or tight base), indicating a potential "coiling" before continuation.
Trend Confirmation: Uses moving averages (e.g., 20/50/200 EMA) to ensure the stock is trading above key averages on the daily chart, confirming an uptrend.
Price Break: Enters when price clears the consolidation high with conviction.
Risk Management:
Initial Stop Loss: Placed below the consolidation low or a recent swing point to limit downside.
Break-Even Adjustment: Moves stop loss to breakeven once the trade reaches 1.5x risk-to-reward (RR), securing a "free trade" while letting winners run.
Trailing Stop (Unique Edge):
Market Structure Trailing: Instead of trailing via moving averages, the stop is dynamically adjusted using structural invalidation level. This adapts to price action, allowing the trade to stay open during volatile retracements while locking in gains as new structure forms.
Why This Matters: Most strategies use rigid trailing stops (e.g., below the 10EMA), which often exit prematurely in choppy markets. By trailing based on structure, this strategy avoids "noise" and captures larger trends, directly boosting overall returns.
----
What markets or timeframes is this suited for?
This is a long-only strategy designed for trending markets, and it performs best in:
Markets: Stocks (especially high-growth, liquid equities), cryptocurrencies (major pairs with strong volatility), commodities (e.g., oil, gold), and futures (index/commodity futures).
Timeframes: Primarily daily charts for swing trades (1-30 day holds), though weekly charts can help confirm broader trends.
Key Advantage: The TradingView script allows instant backtesting with adjustable parameters
You can:
- Test historical performance across multiple markets to identify which assets align best with the strategy.
- Optimize settings (e.g., trailing stop sensitivity, moving averages etc.) to match a market’s volatility profile.
Build a diversified portfolio by filtering for markets that show consistent profitability in backtests.
For example, you might discover cryptos require tighter trailing stops due to volatility, while stocks thrive with wider structural stops. The script automates this analysis, letting you to trade confidently.
----
What indicators or tools does the strategy use?
The strategy combines customizable technical tools with strict anti-lookahead safeguards:
Core Indicators:
Moving Averages: Adjustable periods (e.g., 20/50/200 EMA or SMA) and timeframes (daily/weekly) to confirm trend alignment. Users can test combinations (e.g., 10EMA vs. 20EMA) to optimize for specific markets.
Breakout Parameters:
Consolidation Length: Adjustable window to define the "tightness" of the pre-breakout pattern.
Entry Models: Flexible entry logics (Breakouts and fractals)
Anti-Lookahead Design:
All calculations (e.g., moving averages, consolidation ranges, volume averages) use only closed/confirmed data available at the time of the signal.
----
How do I manage risk with this strategy?
The strategy prioritizes customizable risk controls to align with your trading style and account size:
User-Defined Risk Inputs:
Risk Per Trade: Set a % of Equity (e.g., 1-2%) to determine position size. The strategy auto-calculates shares/contracts to match your selected risk per trade.
Flexibility: Choose between fixed risk or equity-based scaling.
The script adjusts position sizing dynamically based on your selection.
Pyramiding Feature:
Customizable Entries: Adjust the number of pyramiding trades allowed (e.g., 1-3 additional positions) in the strategy settings. Each new entry is triggered only if the prior trade hits its 1.5x RR target and the trend remains intact.
Risk-Scaled Additions: New positions use profits from prior trades, compounding gains without increasing initial risk.
Risk-Free Trade Mechanic:
Once a trade reaches 1.5x RR, the stop loss is moved to breakeven, eliminating downside risk.
The strategy then opens a new position (if pyramiding is enabled) using a portion of the locked-in profit. This "snowballs" winners while keeping total capital exposure stable.
Impact on Net Profit & Drawdown:
Net Profit Boost: Pyramiding lets you ride multi-leg trends aggressively. For example, a 100% runner could generate 2-3x more profit vs. a single-entry approach.
Controlled Drawdowns: Since new positions are funded by profits (not initial capital), max drawdown stays anchored to your original risk per trade (e.g., 1-2% of account). Even if later entries fail, the breakeven stop on prior trades protects overall equity.
Why This Works: Most strategies either over-leverage (increasing drawdowns) or exit too early. By recycling profits into new positions only after securing risk-free capital, this approach mimics hedge fund "scaling in" tactics while staying retail-trader friendly.
----
How does the strategy identify market structure for its trailing stoploss?
The strategy identifies market structure by utilizing an efficient logic with for loops to pinpoint the first swing candle that features a pivot of 2. This marks the beginning of the break of structure, where the market's previous trend or pattern is considered invalidated or changed.
----
What are the underlying calculations?
The underlying calculations involve:
Identifying Swing Points: The strategy looks for swing highs (marked with blue Xs) and swing lows (marked with red Xs). A swing high is identified when a candle's high is higher than the highs of the candles before and after it. Conversely, a swing low is when a candle's low is lower than the lows of the candles before and after it.
Break of Structure (BOS):
Bullish BOS: This occurs when the price breaks above the swing high level of the previous structure, indicating a potential shift to a bullish trend.
Bearish BOS: This happens when the price breaks below the swing low level of the previous structure, signaling a potential shift to a bearish trend.
Structural Liquidity and Invalidation:
Structural Liquidity: After a break of structure, liquidity levels are updated to the first swing high in a bullish BOS or the first swing low in a bearish BOS.
Structural Invalidation: If the price moves back to the level of the first swing low before the bullish BOS or the first swing high before the bearish BOS, it invalidates the break of structure, suggesting a potential reversal or continuation of the previous trend.
This method provides users with a technical approach to filter market regimes, offering an advantage by minimizing the risk of overfitting to historical data, which is often a concern with traditional indicators like moving averages.
By focusing on identifying pivotal swing points and the subsequent breaks of structure, the strategy maintains a balance between sensitivity to market changes and robustness against historical data anomalies, ensuring a more adaptable and potentially more reliable market analysis tool.
----
What entry criteria are used in this script?
The script uses two entry models for trading decisions: BreakOut and Fractal.
Underlying Calculations:
Breakout: The script records the most recent swing high by storing it in a variable. When the price closes above this recorded level, and all other predefined conditions are satisfied, the script triggers a breakout entry. This approach is considered conservative because it waits for the price to confirm a breakout above the previous high before entering a trade. As shown in the image, as soon as the price closes above the new candle (first tick), the long entry gets taken. The stop-loss is initially set and then moved to break-even once the price moves in favor of the trade.
Fractal: This method involves identifying a swing low with a period of 2, which means it looks for a low point where the price is lower than the two candles before and after it. Once this pattern is detected, the script executes the trade. This is an aggressive approach since it doesn't wait for further price confirmation. In the image, this is represented by the 'Fractal 2' label where the script identifies and acts on the swing low pattern.
----
What type of stop-loss identification method are used in this strategy?
This strategy employs two types of stop-loss methods: Initial Stop-loss and Trailing Stop-Loss.
Underlying Calculations:
Initial Stop-loss:
ATR Based: The strategy uses the Average True Range (ATR) to set an initial stop-loss, which helps in accounting for market volatility without predicting price direction.
Calculation:
- First, the True Range (TR) is calculated for each period, which is the greatest of:
- Current Period High - Current Period Low
- Absolute Value of Current Period High - Previous Period Close
- Absolute Value of Current Period Low - Previous Period Close
- The ATR is then the moving average of these TR values over a specified period, typically 14 periods by default. This ATR value can be used to set the stop-loss at a distance from the entry price that reflects the current market volatility.
Swing Low Based:
For this method, the stop-loss is set based on the most recent swing low identified in the market structure analysis. This approach uses the lowest point of the recent price action as a reference for setting the stop-loss.
Trailing Stop-Loss:
The strategy uses structural liquidity and structural invalidation levels across multiple timeframes to adjust the stop-loss once the trade is profitable. This method involves:
Detecting Structural Liquidity: After a break of structure, the liquidity levels are updated to the first swing high in a bullish scenario or the first swing low in a bearish scenario. These levels serve as potential areas where the price might find support or resistance, allowing the stop-loss to trail the price movement.
Detecting Structural Invalidation: If the price returns to the level of the first swing low before a bullish break of structure or the first swing high before a bearish break of structure, it suggests the trend might be reversing or invalidating, prompting the adjustment of the stop-loss to lock in profits or minimize losses.
By using these methods, the strategy dynamically adjusts the initial stop-loss based on market volatility, helping to protect against adverse price movements while allowing for enough room for trades to develop. The ATR-based stop-loss adapts to the current market conditions by considering the volatility, ensuring that the stop-loss is not too tight during volatile periods, which could lead to premature exits, nor too loose during calm markets, which might result in larger losses. Similarly, the swing low based stop-loss provides a logical exit point if the market structure changes unfavorably.
Each market behaves differently across various timeframes, and it is essential to test different parameters and optimizations to find out which trailing stop-loss method gives you the desired results and performance. This involves backtesting the strategy with different settings for the ATR period, the distance from the swing low, and how the trailing stop-loss reacts to structural liquidity and invalidation levels.
Through this process, you can tailor the strategy to perform optimally in different market environments, ensuring that the stop-loss mechanism supports the trade's longevity while safeguarding against significant drawdowns.
----
What type of break-even method is used in this strategy? What are the underlying calculations?
Moves the initial stop-loss to the entry price when the price reaches a certain RR ratio.
Calculation:
Break-even level = Entry Price + (Initial Risk * RR Ratio)
----
What tables are available in this script?
- Summary: Provides a general overview, displaying key performance parameters such as Net Profit, Profit Factor, Max Drawdown, Average Trade, Closed Trades and more.
Total Commission: Displays the cumulative commissions incurred from all trades executed within the selected backtesting window. This value is derived by summing the commission fees for each trade on your chart.
Average Commission: Represents the average commission per trade, calculated by dividing the Total Commission by the total number of closed trades. This metric is crucial for assessing the impact of trading costs on overall profitability.
Avg Trade: The sum of money gained or lost by the average trade generated by a strategy. Calculated by dividing the Net Profit by the overall number of closed trades. An important value since it must be large enough to cover the commission and slippage costs of trading the strategy and still bring a profit.
MaxDD: Displays the largest drawdown of losses, i.e., the maximum possible loss that the strategy could have incurred among all of the trades it has made. This value is calculated separately for every bar that the strategy spends with an open position.
Profit Factor: The amount of money a trading strategy made for every unit of money it lost (in the selected currency). This value is calculated by dividing gross profits by gross losses.
Avg RR: This is calculated by dividing the average winning trade by the average losing trade. This field is not a very meaningful value by itself because it does not take into account the ratio of the number of winning vs losing trades, and strategies can have different approaches to profitability. A strategy may trade at every possibility in order to capture many small profits, yet have an average losing trade greater than the average winning trade. The higher this value is, the better, but it should be considered together with the percentage of winning trades and the net profit.
Winrate: The percentage of winning trades generated by a strategy. Calculated by dividing the number of winning trades by the total number of closed trades generated by a strategy. Percent profitable is not a very reliable measure by itself. A strategy could have many small winning trades, making the percent profitable high with a small average winning trade, or a few big winning trades accounting for a low percent profitable and a big average winning trade. Most mean-reversion successful strategies have a percent profitability of 40-80% but are profitable due to risk management control.
BE Trades: Number of break-even trades, excluding commission/slippage.
Losing Trades: The total number of losing trades generated by the strategy.
Winning Trades: The total number of winning trades generated by the strategy.
Total Trades: Total number of taken traders visible your charts.
Net Profit: The overall profit or loss (in the selected currency) achieved by the trading strategy in the test period. The value is the sum of all values from the Profit column (on the List of Trades tab), taking into account the sign.
- Monthly: Displays performance data on a month-by-month basis, allowing users to analyze performance trends over each month and year.
- Weekly: Displays performance data on a week-by-week basis, helping users to understand weekly performance variations.
- UI Table: A user-friendly table that allows users to view and save the selected strategy parameters from user inputs. This table enables easy access to key settings and configurations, providing a straightforward solution for saving strategy parameters by simply taking a screenshot with Alt + S or ⌥ + S.
User-input styles and customizations:
Please note that all background colors in the style are disabled by default to enhance visualization.
How to Use This Strategy to Create a Profitable Edge and Systems?
Choose Your Strategy mode:
- Decide whether you are creating an investing strategy or a trading strategy.
Select a Market:
- Choose a one-sided market such as stocks, indices, or cryptocurrencies.
Historical Data:
- Ensure the historical data covers at least 10 years of price action for robust backtesting.
Timeframe Selection:
- Choose the timeframe you are comfortable trading with. It is strongly recommended to use a timeframe above 15 minutes to minimize the impact of commissions/slippage on your profits.
Set Commission and Slippage:
- Properly set the commission and slippage in the strategy properties according to your broker/prop firm specifications.
Parameter Optimization:
- Use trial and error to test different parameters until you find the performance results you are looking for in the summary table or, preferably, through deep backtesting using the strategy tester.
Trade Count:
- Ensure the number of trades is 200 or more; the higher, the better for statistical significance.
Positive Average Trade:
- Make sure the average trade is above zero.
(An important value since it must be large enough to cover the commission and slippage costs of trading the strategy and still bring a profit.)
Performance Metrics:
- Look for a high profit factor, and net profit with minimum drawdown.
- Ideally, aim for a drawdown under 20-30%, depending on your risk tolerance.
Refinement and Optimization:
- Try out different markets and timeframes.
- Continue working on refining your edge using the available filters and components to further optimize your strategy.
What Makes This Strategy Unique?
This strategy combines flexibility, smart risk management, and momentum focus in a way that’s rare and practical:
1. Adapts to Any Market Rhythm
Works on daily, weekly, or intraday charts without code changes.
Uses two entry types: classic breakouts (like trending stocks) or fractal patterns (to avoid false starts).
2. Smarter Stop-Loss System
No rigid rules: Stops adjust based on price structure (e.g., new “higher lows”), not fixed percentages.
Avoids whipsaws: Tightens stops only when the trend strengthens, not in choppy markets.
3. Safe Profit-Boosting Pyramiding
Adds new positions only after prior trades are risk-free (stops moved above breakeven).
Scales up using locked-in profits, not new capital, to grow gains safely.
4. Built-In Momentum Check
Tracks 1/3/6-month price growth to spotlight stocks with strong, lasting momentum.
Terms and Conditions | Disclaimer
Our charting tools are provided for informational and educational purposes only and should not be construed as financial, investment, or trading advice. They are not intended to forecast market movements or offer specific recommendations. Users should understand that past performance does not guarantee future results and should not base financial decisions solely on historical data.
Built-in components, features, and functionalities of our charting tools are the intellectual property of @Fractalyst Unauthorized use, reproduction, or distribution of these proprietary elements is prohibited.
- By continuing to use our charting tools, the user acknowledges and accepts the Terms and Conditions outlined in this legal disclaimer and agrees to respect our intellectual property rights and comply with all applicable laws and regulations.

ORB Heikin Ashi SPY 5min Correlation StrategyOverview:
The ORB (Opening Range Breakout) strategy combined with Heikin Ashi candles and Relative Volume (RVOL) indicator aims to capitalize on significant price movements that occur shortly after the market opens. This strategy identifies breakouts above or below the opening range, using Heikin Ashi candles for smoother price visualization and RVOL to gauge the strength of the breakout.
Components:
Opening Range Breakout (ORB): The strategy starts by defining the opening range, typically the first few minutes of the trading session. It then identifies breakouts above the high or below the low of this range as potential entry points.
Heikin Ashi Candles: Heikin Ashi candles are used to provide a smoother representation of price movements compared to traditional candlesticks. By averaging open, close, high, and low prices of the previous candle, Heikin Ashi candles reduce noise and highlight trends more effectively.
Relative Volume (RVOL): RVOL compares the current volume of a stock to its average volume over a specified period. It helps traders identify abnormal trading activity, which can signal potential price movements.
Candle for correlation : In this case we are using SPY candles. It can also use different asset
Strategy Execution:
Initialization: The strategy initializes by setting up variables and parameters, including the ORB period, session timings, and Heikin Ashi candle settings.
ORB Calculation: It calculates the opening range by identifying the high and low prices during the specified session time. These values serve as the initial reference points for potential breakouts. For this we are looking for the first 30 min of the US opening session.
After that we are going to use the next 2 hours to check for breakout opportunities.
Heikin Ashi Transformation: Optionally, the strategy transforms traditional candlestick data into Heikin Ashi format for smoother visualization and trend identification.
Breakout Identification: It continuously monitors price movements within the session and checks if the current high breaches the ORB high or if the current low breaches the ORB low. These events trigger potential long or short entry signals, respectively.
RVOL Analysis: Simultaneously, the strategy evaluates the relative volume of the asset to gauge the strength of the breakout. A surge in volume accompanying the breakout confirms the validity of the signal. In this case we are looking for at least a 1 value of the division between currentVolume and pastVolume
Entry and Exit Conditions: When a breakout occurs and is confirmed by RVOL and is within our session time, the strategy enters a long or short position accordingly. It does not have a stop loss or a takie profit level, instead it will always exit at the end of the trading session, 5 minutes before
Position Sizing and Commissions: For the purpose of this backtest, the strategy allocated 10% of the capital for each trade and assumes a trading commission of 0.01$ per share ( twice the IBKR broker values)
Session End: At the end of the trading session, the strategy closes all open positions to avoid overnight exposure.
Conclusion:
The combination of ORB breakout strategy, Heikin Ashi candles, and RVOL provides traders with a robust framework for identifying and capitalizing on early trends in the market. By leveraging these technical indicators together, traders can make more informed decisions and improve the overall performance of their trading strategies. However, like any trading strategy, it's essential to backtest thoroughly and adapt the strategy to different market conditions to ensure its effectiveness over time.

Single Swing Strategy (SSS)Introduction
The Single Swing Strategy (SSS) is a trading strategy designed for assets that trend. It utilises a single technical indicator to identify potential buying opportunities in upward-trending markets. The strategy focuses on moments when the price of an asset breaks out to a new high, suggesting a strong upward momentum.
Components
1. Exponential Moving Averages (EMAs): SSS uses two EMAs to evaluate the overall asset trend. SSS describes an uptrend as identified, when the fast EMA crosses above the slow EMA and vice versa for a downtrend.
2. Breakout: The strategy validates the trend identified by the EMAs through breakouts in the price action of the asset over a specified lookback period. No indicator is required for this step.
3. Average Directional Index (ADX): The ADX is used to measure the strength of a trend. It does not indicate the trend's direction but rather its strength, whether it's an uptrend or downtrend. A high ADX value (typically above 25) suggests a strong trend, either up or down while a low ADX value (typically below 20) indicates a weak or non-trending market. The ADX itself is a moving average of the expanding range between the +DI and -DI.
4. Positive Directional Indicator (DI+): DI+ helps identify the presence and strength of uptrends. It is calculated based on the upward price movement between current and previous highs. A rising DI+ alongside a rising ADX suggests a strengthening uptrend. When DI+ crosses above DI-, it's often interpreted as a bullish signal.
5. Negative Directional Indicator (DI-): DI- is used to detect the presence and strength of downtrends.It is derived from the downward price movement between current and previous lows. An increasing DI- along with a rising ADX indicates a strengthening downtrend while a crossover of DI- above DI+ is typically seen as a bearish signal.
How it works
1. Regime filter with ADX, DI+, and DI-: The first step in taking a trade is to determine the direction of the trend using the +DI. If in an uptrend, the strategy checks if the ADX is above 25 to confirm a strong uptrend. -DI is not used since the strategy is long only. If in an uptrend and the trend is strong, trades can be opened.
2. Trend Identification with EMAs: Initially, the strategy uses two Exponential Moving Averages (fast and slow) to determine the asset trend. A fast EMA crossing above the slow EMA signifies an uptrend, and vice versa for a downtrend. This is the Entry signal to open a long position.
3. Trend Confirmation with Breakout: The strategy confirms the EMA-indicated trend through price breakouts over a specified lookback period. An EMA crossover without a price action breakout does not lead to an entry signal
4. Trade Management: After entering a trade, the strategy uses predefined levels for taking profit and setting stop losses. Trades are closed either when the price reaches the take-profit level or falls to the stop-loss level. Hence, risk management is built in.
Results
The backtest results can be found below. Initial capital of 10000 was used, this is a convenient amount for most retail traders, commission of $3 per order, position size of 3% of initial capital and slippage of 3 ticks. These are all representative of real world retail trading conditions.
Originality
The Single Swing Strategy (SSS)'s originality is in its blending of classical technical analysis; Trend Analysis through EMAs and Price Action through Breakout, into an innovative trading logic.
1. The Essence of Trend and Breakout in SSS
(i) Trend Recognition: At the heart of SSS is the Exponential Moving Averages (EMAs). While the use of EMAs is common, SSS employs them for trend analysis so an entry decision can be made. The strategy's core algorithm assesses the inception of an upward trend by observing a specific crossing pattern of the EMAs, a moment where the asset's momentum shifts, offering a strategic advantage.
(ii) Breakout Significance: The strategy's reliance on price breakouts isn't just about identifying a new high; it's about understanding market psychology. A breakout beyond a previous high signals not only momentum but also a collective market sentiment that favors upward movement. SSS attempts to capture this momentum, translating it into a tangible trading opportunity.
(iii)Strength of trend: The ADX and +DI double checks the trend is in the right direction and checks to see if the trend is strong enough hence, it prevents trading when the trend is not supportive.
2. Simplicity as a Cornerstone
(i) Clarity and Efficiency: In the realm of algorithmic trading, complexity isn't always synonymous with effectiveness. SSS' simplicity ensures its logic is transparent and its execution, efficient. This simplicity is a strategic choice, designed to reduce overfitting to past data and improve adaptability to real-market conditions.
(ii) Ease of Use and Decision Making: The straightforward nature of SSS may empower traders to make informed decisions without being overwhelmed by convoluted indicators. This is particularly useful because of the embedding of risk management using defined exit points after entry through a Take Profit and Stop Loss. This hardcodes a 3:1 risk reward ratio into every trade.
3. Positive Expectancy
(i) Performance Metrics: The SSS strategy shows its edge in its backtesting results. A 62% win rate, a profit factor of 1.7, profit ratio of 1.05 and an average trade gain of 4.7% are not just numbers; they show the mathematical edge over the backtest period, especially considering the high commissions and slippage factored into its design.
Trading
The SSS strategy has been backtested on the 1D timeframe of BTCUSD but users are encouraged to try it on other assets such as SPXL (5min), AAPL (5min) and others but the appropriate timeframe and trading costs may vary.
NOTE
Like any trading strategy, SSS does not guarantee profits. It's a tool to assist in decision-making, not a foolproof solution. Trading involves risks, particularly in volatile markets. Users should trade responsibly, considering their risk tolerance and financial situation. While SSS automates some aspects of trading, it requires continuous monitoring and does not replace the need for sound judgement and decision-making by the trader.

Megabar Breakout (Range & Volume & RSI)Hey there,
This strategy is based on the idea that certain events lead to what are called Megabars. Megabars are bars that have a very large range and volume. I wanted to verify whether these bars indicate the start of a trend and whether one should follow the trend.
Summary of the Code:
The code is based on three indicators: the range of the bar, the volume of the bar, and the RSI. When certain values of these indicators are met, a Megabar is identified. The direction of the Megabar indicates the direction in which we should trade.
Why do I combine these indicators?
I want to identify special bars that have the potential to mark the beginning of a breakout. Therefore, a bar needs to exhibit high volume, have a large range (huge price movement), and we also use the Relative Strength Index (RSI) to assess potential momentum. Only if all three criteria are met within one candle, do we use this as an identifier for a megabar.
Explanation of Drawings on the Chart:
As you can see, there is a green background on my chart. The green background symbolizes the time when I'm entering a trade. Only if a Megabar happens during that time, I'm ready to enter a trade. The time is between 6 AM and 4 PM CET. It's just because I prefer that time. Also, the strategy draws an error every time a Megabar happens based on VOL and Range only (not on the RSI). That makes it pretty easy to go through your chart and check the biggest bars manually. You can activate or deactivate these settings via the input data of the strategy.
When Do We Enter a Trade?
We wait for a Megabar to happen during our trading session. If the Megabar is bullish, we open a LONG trade at the opening price of the next candle. If the Megabar is bearish, we open a SHORT trade at the opening price of the next candle.
Where Do We Put Our Take Profit & Stop Loss?
The default setting is TP = 40 Pips and SL = 30 Pips. In that case, we are always trading with a risk-reward ratio of 1.33 by default. You can easily change these settings via the input data of the strategy.
Strategy Results
The criteria for Megabars were chosen by me in a way that makes Megabars something special. They are not intended to occur too frequently, as the fundamental idea of this strategy would otherwise not hold. This results in only 37 closed trades within the last 12 months. If you change the criterias for a megabar to a milder one, you will create more Megabars and therefore more trades. It's up to you. I have adapted this strategy to the 30-minute chart of the EURUSD. In the evaluation, we consider a period of 12 months, which I believe is sufficient.
My default settings for the indicators look like this:
Avg Length Vol 20
Avg Multiplier Vol 3
Avg Length Range 20
Avg Multiplier Range 4
Value SMA RSI for Long Trades 50
Value SMA RSI for Short Trades 70
IMPORTANT: The current performance overview does not display the results of these settings. Please change the settings to my default ones so that you can see how I use this strategy.
I do not recommend trading this strategy without further testing. The script is meant to reflect a basic idea and be used as a tool to identify Megabars. I have made this strategy completely public so that it can be further developed. One can take this framework and test it on different timeframes and different markets.

Session Breakout Scalper Trading BotHi Traders !
Introduction:
I have recently been exploring the world of automated algorithmic trading (as I prefer more objective trading strategies over subjective technical analysis (TA)) and would like to share one of my automation compatible (PineConnecter compatible) scripts “Session Breakout Scalper”.
The strategy is really simple and is based on time conditional breakouts although has more ”relatively” advanced optional features such as the regime indicators (Regime Filters) that attempt to filter out noise by adding more confluence states and the ATR multiple SL that takes into account volatility to mitigate the down side risk of the trade.
What is Algorthmic Trading:
Firstly what is algorithmic trading? Algorithmic trading also known as algo-trading, is a method of using computer programs (in this case pine script) to execute trades based on predetermined rules and instructions (this trading strategy). It's like having a robot trader who follows a strict set of commands to buy and sell assets automatically, without any human intervention.
Important Note:
For Algorithmic trading the strategy will require you having an essential TV subscription at the minimum (so that you can set alerts) plus a PineConnecter subscription (scroll down to the .”How does the strategy send signals” headings to read more)
The Strategy Explained:
Is the Time input true ? (this can be changed by toggling times under the “TRADE MEDIAN TIMES” group for user inputs).
Given the above is true the strategy waits x bars after the session and then calculates the highest high (HH) to lowest low (LL) range. For this box to form, the user defined amount of bars must print after the session. The box is symmetrical meaning the HH and LL are calculated over a lookback that is equal to the sum of user defined bars before and after the session (+ 1).
The Strategy then simultaneously defines the HH as the buy level (green line) and the LL as the sell level (red line). note the strategy will set stop orders at these levels respectively.
Enter a buy if price action crosses above the HH, and then cancel the sell order type (The opposite is true for a stop order).
If the momentum based regime filters are true the strategy will check for the regime / regimes to be true, if the regime if false the strategy will exit the current trade, as the regime filter has predicted a slowing / reversal of momentum.
The image below shows the strategy executing these trading rules ( Regime filters, "Trades on chart", "Signal & Label" and "Quantity" have been omitted. "Strategy label plots" has been switched to true)
Other Strategy Rules:
If a new session (time session which is user defined) is true (blue vertical line) and the strategy is currently still in a trade it will exit that trade immediately.
It is possible to also set a range of percentage gain per day that the strategy will try to acquire, if at any point the strategy’s profit is within the percentage range then the position / trade will be exited immediately (This can be changed in the “PERCENT DAY GAIN” group for user inputs)
Stops and Targets:
The strategy has either static (fixed) or variable SL options. TP however is only static. The “STRAT TP & TP” group of user inputs is responsible for the SL and TP values (quoted in pips). Note once the ATR stop is set to true the SL values in the above group no longer have any affect on the SL as expected.
What are the Regime Filters:
The Larry Williams Large Trade Index (LWLTI): The Larry Williams Large Trade Index (LWTI) is a momentum-based technical indicator developed by iconic trader Larry Williams. It identifies potential entries and exits for trades by gauging market sentiment, particularly the buying and selling pressure from large market players. Here's a breakdown of the LWTI:
LWLTI components and their interpretation:
Oscillator: It oscillates between 0 and 100, with 50 acting as the neutral line.
Sentiment Meter: Values above 75 suggest a bearish market dominated by large selling, while readings below 25 indicate a bullish market with strong buying from large players.
Trend Confirmation: Crossing above 75 during an uptrend and below 25 during a downtrend confirms the trend's continuation.
The Andean Oscillator (AO) : The Andean Oscillator is a trend and momentum based indicator designed to measure the degree of variations within individual uptrends and downtrends in the prices.
Regime Filter States:
In trading, a regime filter is a tool used to identify the current state or "regime" of the market.
These Regime filters are integrated within the trading strategy to attempt to lower risk (equity volatility and/or draw down). The regime filters have different states for each market order type (buy and sell). When the regime filters are set to true, if these regime states fail to be true the trade is exited immediately.
For Buy Trades:
LWLTI positive momentum state: Quotient of the lagged trailing difference and the ATR > 50
AO positive momentum state: Bull line > Bear line (signal line is omitted)
For Sell Trades:
LWLTI negative momentum stat: Quotient of the lagged trailing difference and the ATR < 50
AO negative momentum state: Bull line < Bear line (signal line is omitted)
How does the Strategy Send Signals:
The strategy triggers a TV alert (you will neet to set a alert first), TV then sends a HTTP request to the automation software (PineConnecter) which receives the request and then communicates to an MT4/5 EA to automate the trading strategy.
For the strategy to send signals you must have the following
At least a TV essential subscription
This Script added to your chart
A PineConnecter account, which is paid and not free. This will provide you with the expert advisor that executes trades based on these strategies signals.
For more detailed information on the automation process I would recommend you read the PineConnecter documentation and FAQ page.
Dashboard:
This Dashboard (top right by defualt) lists some simple trading statistics and also shows when a trade is live.
Important Notice:
- USE THIS STRATEGY AT YOUR OWN RISK AND ALWAYS DO YOUR OWN RESEARCH & MANUAL BACKTESTING !
- THE STRATEGY WILL NOT EXHIBIT THE BACKTEST PERFORMANCE SEEN BELOW IN ALL MARKETS !

London BreakOut ClassicHey there, this is my first time publishing a strategy. The strategy is based on the London Breakout Idea, an incredibly popular concept with abundant information available online.
Let me summarize the London Breakout Strategy in a nutshell: It involves identifying key price levels based on the Tokyo Session before the London Session starts. Typically, these key levels are the high and low of the previous Tokyo session. If a breakout occurs during the London session, you simply follow the trend.
The purpose of this code
After conducting my research, I came across numerous posts, videos, and articles discussing the London Breakout Strategy. I aimed to automatically test it myself to verify whether the claims made by these so-called trading gurus are accurate or not. Consequently, I wrote this script to gain an understanding of how this strategy would perform if I were to follow its basic settings blindly.
Explanation of drawings on the chart:
Red or Green Box: A box is drawn on our chart displaying the exact range of the Tokyo trading session. This box is colored red if the trend during the session was downward and green if it was upward. The box is always drawn between the high and the low between 0:00 AM and 7:00 AM UTC. You can change the settings via the Inputs "Session time Tokyo" & "Session time zone".
Green Background: The green background represents the London trading session. My code allows us to make entries only during this time. If we haven't entered a trade, any pending orders are canceled. I've also programmed a timeout at 11 pm to ensure every trade is closed before the new Tokyo session begins.
Red Line: The red line is automatically placed in the middle of our previous Tokyo range. This line acts as our stop loss. If we cross this line after entering a trade but before reaching our take profit, we'll be stopped out.
When do we enter a trade?
We wait for a candle body to close outside of the previous Tokyo range to enter a trade with the opening of the next candle. We only enter one trade per day.
Where do we put our Take Profit?
The code calculates the exact distance between our entry point and the stop loss. We are trading a risk-reward ratio of 1:1 by default, meaning our take profit is always the same number of pips away from our entry as the stop loss. The Stop Loss is always defined by the red line on the chart. You can change the risk-reward ratio via the inputs setting "CRV", to see how the result changes.
What is the purpose of this script?
I wanted to backtest the London breakout strategy to see how it actually works. Therefore, I wrote this code so that everybody can test it for themselves. You can change the settings and see how the result changes. Typically, you should test this strategy on forex markets and on either 1Min, 5 Min, or 15 Min timeframe.
What are the results?
Over the last 3-6 months (over 100 trades), trading the strategy with my default settings hasn't proven to be very successful. Consequently, I do not recommend trading this strategy blindly. The purpose of this code is to provide you with a foundation for the London Breakout Strategy, allowing you to modify and enhance it according to your preferences. If you're contemplating whether to give it a try, you can assess the results from the past months by using this code as a starting point.

2 Moving Averages | Trend FollowingThe trading system is a trend-following strategy based on two moving averages (MA) and Parabolic SAR (PSAR) indicators.
How it works:
The strategy uses two moving averages: a fast MA and a slow MA.
It checks for a bullish trend when the fast MA is above the slow MA and the current price is above the fast MA.
It checks for a bearish trend when the fast MA is below the slow MA and the current price is below the fast MA.
The Parabolic SAR (PSAR) indicator is used for additional trend confirmation.
Long and short positions can be turned on or off based on user input.
The strategy incorporates risk management with stop-loss orders based on the Average True Range (ATR).
Users can filter the backtest date range and display various indicators.
The strategy is designed to work with the date range filter, risk management, and user-defined positions.
Features:
Trend-following strategy.
Two customizable moving averages.
Parabolic SAR for trend confirmation.
User-defined risk management with stop-loss based on ATR.
Backtest date range filter.
Flexibility to enable or disable long and short positions.
This trading system provides a comprehensive approach to trend-following and risk management, making it suitable for traders looking to capture trends with controlled risk.

Liquidity Breakout - Strategy [presentTrading]- Introduction and How It Is Different
The Liquidity Breakout Strategy is a unique trading strategy that focuses on identifying and leveraging patterns in market price data. This strategy, mainly inspired by the script "Master Pattern" by LuxAlgo, takes a different approach from many traditional strategies that rely on technical indicators or fundamental analysis. Instead, the Liquidity Breakout is based on the concept of contraction detection and liquidity levels. This approach allows traders to identify potential trading opportunities that other strategies might miss.
BTCUSDT 6h
The strategy is different from other trading strategies because it uses a unique combination of pattern detection, liquidity levels, and user-defined trading direction. This combination allows the strategy to adapt to various market conditions and trading styles, making it a versatile tool for traders.
- Strategy: How It Works
1. Contraction Detection: The strategy uses a lookback period defined by the user (default is 10 bars) to identify contractions in the market. A contraction is a period where the market is consolidating, often followed by a significant price movement. The strategy identifies contractions by finding pivot highs and pivot lows within the lookback period. If a pivot high is lower than the previous pivot high and a pivot low is higher than the previous pivot low, a contraction is detected.
2. liquidity Levels:
What are Liquidity levels? Liquidity levels, also known as liquidity pools or zones, are price levels at which there is a significant amount of trading activity. They are often areas where large institutional traders (like banks or hedge funds) have placed orders. These levels are important because they can act as support or resistance levels, and price often reacts at these levels.
In the context of this strategy, liquidity levels are used to identify potential entry and exit points for trades. When the price reaches a liquidity level, it could indicate a potential trading opportunity. For example, if the price breaks through a liquidity level, it could signal the start of a new trend. On the other hand, if the price approaches a liquidity level and then reverses, it could signal a potential reversal.
The strategy uses these two elements to identify potential trading opportunities. When a contraction is detected, the strategy will look for a breakout in the direction of the trend. If the breakout occurs at a liquidity level, the strategy will execute a trade.
The strategy also allows traders to set their stop loss based on either the Average True Range (ATR) or a fixed percentage. This flexibility allows traders to manage their risk according to their personal risk tolerance and trading style.
- Trade Direction
One of the unique features of the Master Pattern Strategy is the ability to choose the trading direction. Traders can choose to trade in the "Long" direction, the "Short" direction, or "Both". This feature allows traders to adapt the strategy to their personal trading style and market outlook.
For example, if a trader believes that the market is in an uptrend, they can choose to trade only in the "Long" direction. Conversely, if the market is in a downtrend, they can choose to trade only in the "Short" direction. If the trader believes that the market is volatile and there are opportunities in both directions, they can choose to trade in "Both" directions.
- Usage
To use the strategy, traders need to input their preferred settings, including the contraction detection lookback period, liquidity levels, stop loss type, and trading direction. Once these settings are input, the strategy will automatically detect potential trading opportunities and execute trades according to the defined parameters.
- Default Settings
The default settings for the Master Pattern Strategy are as follows:
Contraction Detection Lookback: 10
Liquidity Levels: 20
Stop Loss Type: ATR
ATR Length: 20
ATR Multiplier: 3.0
Fixed Percentage: 0.01
Trading Direction: Both
These settings can be adjusted according to the trader's personal preferences and market conditions. It's recommended that traders experiment with different settings to find the ones that work best for their trading style and goals.

Previous Day High Low Strategy only for LongWelcome to the "Previous Day High Low Strategy only for Long"!.
This strategy aims to identify potential long trading opportunities based on the previous day's high and low prices, along with certain market strength conditions.
Key Features:
Entry Conditions: The strategy triggers a long position when the current day's closing price crosses above the previous day's high or low.
Market Strength Filter: The strategy incorporates a market strength filter using the Average Directional Index (ADX). It only takes long positions when the ADX value is above a specific threshold and when there is a predominance of upward movement.
Trade Timing: The strategy operates within a specified trade window, starting at 09:30 and ending at 15:10. Positions are closed at 15:15 if still active.
Risk Management: The strategy employs dynamic stop-loss and profit-taking levels based on a user-defined Max Profit value. It has three profit targets (T1, T2, T3) and a stop-loss level to manage risk effectively.
Rules:
Ensure that the strategy idea is clearly understandable. Provide an easy-to-read title and a thoughtful description explaining the reasoning behind the strategy.
All content should be ad-free. Avoid any form of promotion, advertising, or solicitation.
No fundraising requests or money solicitation is allowed on TradingView.
Publish in the same language as the TradingView subdomain you're on, except for script titles, which must be in English.
Don't plagiarize. Create and share only unique content, and always give credit when using someone else's work.
Be respectful, kind, and constructive when engaging with others.
Zero tolerance for contentious political discourse, defamatory, threatening, or discriminatory remarks.
Avoid sharing harmful, misleading, or inappropriate content.
Respect the moderators' work and address complaints privately.
Use only your original account and avoid creating duplicate or fake accounts.
Do not attempt to manipulate the reputation system or engage in like-for-like schemes.
Explanation of how the strategy works
1. Previous Day's High and Low (HH, LL):
In this strategy, we start by obtaining the high and low prices of the previous day (not the current day) using the request.security function. This function allows us to access historical data for a specific time frame. The high and low prices are stored in the variables HH and LL, respectively.
2. Entry Conditions:
The strategy uses two conditions to trigger a long position:
Condition 1 (Long Condition 1): If the closing price of the current day crosses above the previous day's high (HH), it generates a long signal. This is achieved using the ta.crossover function, which detects when a crossover occurs.
Condition 2 (Long Condition 2): Similarly, if the closing price of the current day crosses above the previous day's low (LL), it also generates a long signal.
Combined Condition: To take long positions, the strategy combines both long conditions using the logical OR operator (or). This means that if either of the two conditions is met, a long position will be initiated.
3. Market Strength Filter:
The strategy also includes a filter based on the Average Directional Index (ADX) to gauge the market's strength before taking long positions. The ADX measures the strength of a trend in the market. The higher the ADX value, the stronger the trend.
Calculation of ADX: The ADX is calculated using the adx function, which takes two parameters: LWdilength (DMI Length) and LWadxlength (ADX period).
Strength Condition (strength_up): The strategy requires that the ADX value should be above a threshold (11 in this case) and that there is a predominance of upward movement (up > down) before initiating a long position. The LWADX value is multiplied by 2.5 and compared to the highest value of LWADX from the last 4 periods using ta.highest(LWADX , 4). If these conditions are met, the variable strength_up is set to true.
Combined Condition: The strength_up condition is then combined with the long conditions using the logical AND operator (and). This means that the strategy will only take a long position if both the long conditions and the market strength condition are met.
4. Trade Timing:
The strategy sets a specific trade window between 09:30 and 15:10. It will only execute trades within this time frame (TradeTime).
5. Risk Management:
The strategy implements dynamic stop-loss (SL) and profit-taking levels (T1, T2, T3) based on a user-defined Max Profit value. The stop-loss is set as a percentage of the Max Profit value. As the position moves in favor of the trader, the profit targets are adjusted accordingly.
6. Position Management:
The strategy uses the strategy.entry function to enter long positions based on the combined entry conditions. Once a position is open, the script uses strategy.exit to define the exit condition when either the profit target or stop-loss level is hit. The strategy.close function is used to close any open position at the end of the trade window (15:15).
7. Plotting:
The strategy uses the plot function to visualize the previous day's high and low prices, as well as the stop-loss (SL) and profit-taking (T1, T2, T3) levels on the chart.
Overall, the "Previous Day High Low Strategy only for Long" aims to identify potential long trading opportunities based on the previous day's price action and market strength conditions. However, as with any trading strategy, it's essential to thoroughly test it and consider risk management before applying it to real-world trading scenarios.
Disclaimer:
The information presented by this strategy is for educational purposes only and should not be considered as investment advice. The strategy is not designed for qualified investors. Always conduct your own research and consult with a financial advisor before making any trading decisions.
Remember, the success of any trading strategy depends on various factors, including market conditions, risk management, and individual trading skills. Past performance is not indicative of future results.

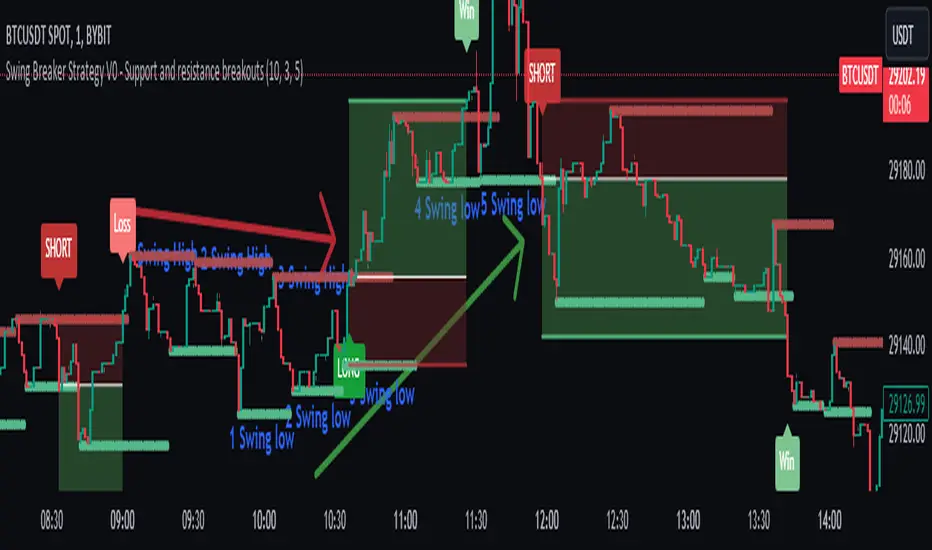
Swing Breaker Strategy [v0.1] - Support and resistance breakoutSwing Breaker Strategy - Support and Resistance Breakouts
This strategy has no repainting.
Default settings:
Swing Barsback: 10
Number of Swings: 3
Stoploss Candles Lookback: 5
Why these default settings?
This strategy has been backtested with over 100 trades, and on a larger scale of 1000 trades, it has reported a 1.33 profit factor with a maximum 5% cumulative drawdown, using no leverage. In this backtest, the settings (10,3,5) were used, becoming the default settings as they are more adaptable to different market conditions.
How does this strategy work?
Defining swing lows (support) and swing highs (resistance): We can locate these candles by looking at a symmetrical candle unit around them. For example, the default settings present a 10 swing bars back, which means there is no superior level within a 10-candle radius in the case of a swing high, and the opposite for a swing low. Swings are located a few candles after, just the number of swing bars back (width), because it is needed to ensure it is a swing.
Locating trends: We locate trends by looking at consecutive swings. For example, in the default settings, to determine a bullish trend, we need 3 consecutive ascending swing lows; for a bearish trend, 3 consecutive descending swing highs. You can find this parameter in settings as "Number of swings."
When a trend is formed, a stop entry is placed at the last swing until it is broken.
Just after the entry, the stop is placed at the lowest (in the case of a long) or the highest (in the case of a short) of the last candles. You can define that number in the settings as "Stoploss candles lookback," which default is 5. The take profit is placed at 2 times the stop value, resulting in a 2 risk-reward ratio.
Why is this strategy protected?
No other strategy combines the way of locating swings and turning it into a strategy, including customizable parameters such as stop loss, swing width and introducing the number of swings. That's why we decided to protect it.
METRIC-TREND-TRADERThis script is a Fully Automated trading script meant to be used with "Oanda" broker and the plug-ins for algorithmic trading automation.( FOREX ONLY)
This script is meant to capture "TREND FOLLOWING " for intraday charts (1hour) preferably and will hold for days / weeks .trading on forex markets.
(The combination of indicators includes a short high and low price channel and a longer term high and low price channel)
This script is original in description as being automated to try and capture dynamic trending markets with both long and short fractal price channels. although trend trading is not an original concept. trend trading with this dynamic indicator allows the user visualize both short term and longer term price action at the same time, helping to make better trading decisions. the channels are designed to buy breakouts in the direction of the longer term trend while trailing stop a built-in stop loss that allows normal market movement while attempting to lock in flexible profits.
The concept of this indicator is be able to quickly visualize trends by high lighting the large green areas beneath price "when trending long" which is the difference between the (user defined) short term lows and the (user defined) Long period price lows.
For "down trending" markets a large red area above price will be displayed and this is the difference between the (user defined) short term highs and the (user defined) long term highs.
This strategy uses a lower than reward profile to jump in direction of market moves for continuation,
(1 risk to 4 reward)
in the likelihood the instrument will continue (example) 200 pips before it reverts 50 pips in the counter direction.
This strategy should only be used in markets that you believe are "TRENDING" at the time of trading otherwise you risk trend trading a range market.
This script uses a (user defined period) of short term high and low price ( green/red color) and (user defined period) Long Term high and low price (green/red) chosen in the indicator settings menu.
The default parameters are 10 with a (minimum of 1 and maximum of 10000) for the short term channel and 50 with a (minimum of 1 and maximum of 10000) for the long term price channel , the default parameters = roughly 2 days "long term" and 10 hours "short term" of price action on the (1 hour) chart.
Strategy entries and exits , for Long trades the trade will be entered if the short term high crosses above the Long Term high and the Short term low is not equal to the Long term low . the trade will exit if profit or stop loss are hit or if the Short term low crosses under the long term low.
For Short trades the trade will enter short if , the short term low crosses under the long term low and the short term high is not equal to the long term high. the trade will exit if profit or stop loss are hit or the short term high crosses over the long term high
"The default parameters should be kept unless you fully understand the complete strategy"
There are two very important inputs to be selected at the user setting menu "Long Only " and "Short Only" if you are looking to place long trades only select "Long Only" or for short trades select " Short Only" it is not recommended to keep both selected as it will trade both sides!
When the trade is entered a red , a blue and green horizontal dotted line will appear on the chart.
the blue line is the strategy entry price , the red line is the stop loss price , and the green line is the take profit price . the colors will invert if the trade is long or short.
(Setting alerts should be done in the indicator settings menu, and the parameters you chose will determine the stop loss/target and the amount of "units = (position size)" you wish to trade for the (forex only) markets. using "alert() function calls only" is the only alert that should be used with this strategy.
(note : when "alert() function calls only" is set two messages will be sent, one closing any open position in the opposite direction and one placing the new order regardless if you are currently in a trade or not)
Trade targets , stoploss and trade position size are a user defined variables entered in the indicator settings menu. (target pips minimum 0 and a maximum of 1000)(stop pips minimum of 0 and maximum of 1000)
Back test date range is included in the script for back testing different data periods.
the back ground will be colored a transparent navy blue if the period you are looking trading is with in the date range( note: to place live trades the end date will need to be in the future)
this is also adjustable in the settings menu
The avoid spread filter is a user defined time in which the spread is typically higher than average, applying this filter avoids trades in the specified time. When this filter is applied there will be a transparent red back ground color in the specified time.
Back test default setting are equivocal to OANDA:USDJPY
at the time of this publication placing trades with the "Oanda" broker are as follows , USD units = 2000 equal 2000 USD position size . "Oanda" current leverage is 20 to 1 for this particular pair and commission is paid in spread (1.4) pips = 0.19 USD per trade , Margin required for the trade is 100.0 USD , Position sizing = 10% of a 1000 USD account.
OANDA:USDJPY

Wunder Breakout botWunder Breakout bot
1. Wunder Breakout bot is based on the breakout of the trend line. Breakout is a technical trading strategy that is used to determine the moment of a trend line breakout on the price chart. It is based on the assumption that when price crosses a trend line, it signals a change in trend direction and the possible start of a new price movement.
2. The entry points for the trendline breakout strategy are based on the principle of breaking through a set trendline. This means that we look for the moment when the price of the asset crosses the trend line that we have established in order to enter a sell or buy position.
3. We use fixed take-profit and stop-loss, but you can use other risk management systems, based on the suggested settings.
4. Wunder Breakout bot script has added a function to calculate the risk per portfolio (your deposit). When this option is enabled, you get the calculation of the entry amount in dollars relative to your Stop Loss. You can chooseselect the percentage of risk per your portfolio in the settings. the percentage of risk per your portfolio in the settings. The loss will be calculated from the amount that will be displayed on the chart.
For example, if your deposit is $1000 and you set your risk at 1%, with a Stop Loss of 5%, your entry volume would be $200. The SL loss would be $10. $10 is your 1% risk or 1% of your deposit.
*Important! ** The risk per trade must be less than the Stop Loss value. If the risk is more than SL, you should use leverage.
The amount of funds included in the deal is calculated in dollars. This option was created if you want to send a dollar amount from Tradingview to the exchange. However, by specifying the volume in dollars, you will get the net profit and drawdown displayed incorrectly in the backtest results because TradingView calculates the backtest volume in contracts.
To display the correct net profit and drawdown values in Tradingview backtest results, use the "Volume in Contracts" option.

Classic Long Term Trend Following SystemThis is a classic long term trend following system.
The breakout period is 50 days instead of 20 and the moving average crossover are 40 and 120.
The moving averages are also exponential instead of simple.
The stoploss is 4 ATRs away from the price.
Recommendations:
Donchian Channels settings > 50 days
Moving Averages > 40 and 120, 80 and 140
Important to note:
My first strategy, DC Breakout System | This is simplicity at its finest, is best used on the crypto market and this one for stocks, commodities, currencies, etc. Those markets tend to trend a lot longer than crypto do.

Trend Following with Donchian Channels and MACDThis is a trend following system based on the Donchian Channels. Instead of using a simple moving average crossover, this system uses the MACD as the trendfilter:
Long positions:
* Price makes a new 50 day high,
* The MACD-line crosses above or is above the Signal-line.
* Both the MACD and the Signal-lines are above the zero-line.
Short positions:
* Price makes a new 50 day low,
* The MACD-line crosses below or is below the Signal-line.
* Both the MACD and the Signal-lines are below the zero-line.
Stoploss:
The initial and the trailing stoploss are 4 ATRs away from the price.

DC Breakout Strategy | This is simplicity at its finest.As the title already describes: this is a Donchian breakout strategy. This strategy, as of now, only goes long. It goes long when the price close makes a new high and the 8 day moving average is above the 32 day moving average. The strategy exits the trade if the price breaks the atr trailing stop of * 3 or the 8 day moving average crosses below the 32 day moving average.
This is simplicity at its finest.

CCI & EMA strategy by TradeswithashishThis strategy is extremely useful for positional traders or traders using timeframe 15-minute of higher. It uses following combo of values:
VWAP, CCI, Volume and Moving average (simple and exponential)
Caution:
Avoid taking trade if candle size is greater than twice the average candle size. for that wait for the retracement to near trailing stoploss

Newton theory (Bollinger Band Breakout)Initial capital 1000 USD
Order size 10%
Commission 0.3% with slippage
Timeframe 4h
This is Simple Bollinger Band Trend find out strategy.
I'm using the usual trailing offset as an exit for this strategy.
using 1x leverage to go long short within 3years backtest result more then 200% for all usd pair.
in next version i will try to find out more optimize sma,std,sl,tp parameter by using freqtrade hyperparameter optimization.
Happy Trading :)

breakout crossover 4H 1DHi, this script is crossover between breakouts of 4H and Day timeframe. It also checks candlestick patterns before opening trades. Red horizontal line acts as support and resistance of Daily timeframe. You can close trades at next signal or at High/Low. Enjoy trading.
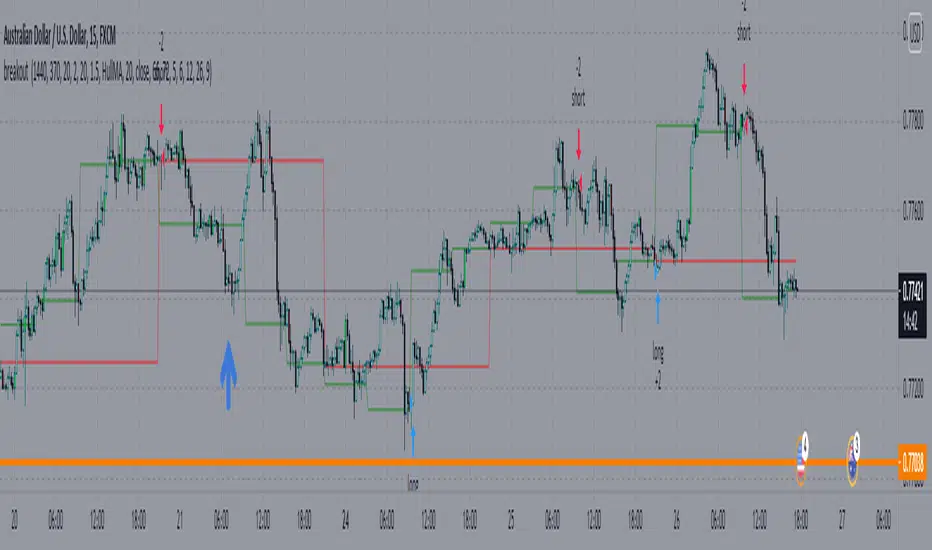
MomentumInvest TrendFollower [@TradersVenue]VSA CheatSheet - Have kept the chart clean and clear not by putting each signal pattern name. What matters is identifying the real price action than the pattern name. To keep the charts clutter free, haven't put the signal name under/above the candle.
Rejection or reversal patterns
Green Circle - Typical SellingClimax, Stopping Volume and Bag Holding signal patterns as per VSA. Strong price volume action but price rejection at lower level.
Red Circle - Typical Buying Climax, End Of Rising, Supply Overcoming Demand signal patterns as per VSA. Strong price volume action but price rejection at higher level.
Green Square - Typical bullish TrendReversal candle as per VSA. Bullish breakout bar immediately after a bearish breakout bar and engulfing the previous one or cover max part of it.
Red Square - Typical bearish TrendReversal candle as per VSA. Bearish breakout bar immediately after a bullish breakout bar and engulfing the previous one or cover max part of it.
Momentum breakout patterns
Blue/Green Star - Bullish breakouts. Downthrust bars with significant price volume action. Green if smaller low weak otherwise blue.
Red/Pink Star - Bearish breakouts. Downthrust bars with significant price volume action. Red if low higher weak else pink.
Candle Color
Green - Bullish with strong price action. Good to enter long towards close with SL of day low. System suggests quantity as per 2% trading rule. One can play with risk defined option strategies or cash segment as per quantity suggested.
Red - Bearish with strong price action. Good to enter short towards close with SL of day high. System suggests quantity as per 2% trading rule. One can play with risk defined option strategies like bear put spread or bear call spreads or go for hedged shorts.
Pink - Bearish with muted price action. Trail SL. Better to avoid trading these candles.
Light blue - Bullish with muted price action. Trail SL. Better to avoid trading these candles.
Plotted EMA Ribbon gives a sense of the strength of momentum. When each MA is placed with wide gaps momentum is strong. When there is EMA confluence, chances of trend strength are weakening. Background color of the chart green indicates bullishness in the underlying and red indicates that bearish pressure in the scrip. If the background color is green and you see one Blue/Green star candle it's good to go long. If the background color is red and you see one Red/Pink star candle it's good to go short.
A word of caution: Trading breakouts is very good. But you need to prepare for breakout failures. Here the system picks wide range bars for going long or short that means SL is wide probably 3% and above. Also if you notice after a strong PV breakout if price sustains below that it can see long unwinding pressure and simillary after a strong PV breakdown, if price sustains above the breakdown candle, chances of short covering is higher. Here money management and risk management becomes very important. Same has been included as part of the indicator to give you an optimal quantity for trade to keep the drawdowns lower. If you enable (1) RECO message and (2) Show Strategy (Else Study)? options then it shows a RECO box with quantity calculated as per 2% loss per trade rule. Lot of risk management, scale up/down for compounding is also available. You may try out those options one by one.
This indicator needs to be used along with the “VSA + Volume Oscillator ”, because this setup relies on VSA (Volume Spread Analysis). The overall usage will be provided through a demo to the subscribing users. In order to gain access to this indicator you may contact me using the below signature.
