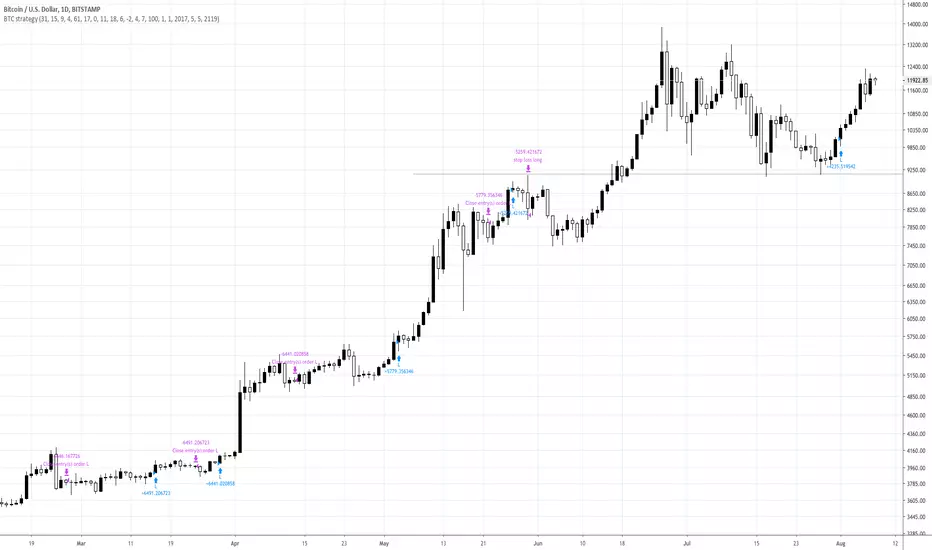
Leverage Strategy and a few words on risk/opportunityHello traders,
I started this script as a joke for someone... finally appears it could be used for educational content
Let's talk about leverage and margin call
Margin Call
A margin call is the broker's demand that an investor deposit additional money or securities so that the account is brought up to the minimum value, known as the maintenance margin.
A margin call usually means that one or more of the securities held in the margin account has decreased in value below a certain point.
Leverage
A leverage is a system which allows the trader to open positions much larger than his own capital. ... “Leverage” usually refers to the ratio between the position value and the investment needed,
Strat
The strategy simulates long/short positions on a 4h high/low breakout based on the chart candle close.
The panel below shows the strategy equity curve. Activating the margin call option will show when the account would be margin called giving the settings
Casino
I'm not doing any financial recommendation here.
I made this strategy so that people include more risk management metrics into their strategy.
From the code, we see it's fairly easy to calculate a leveraged position size and a margin call flag - when that flag is hit, the system stops trading.
I simplified things to the extreme here but my point is that the leverage is a double-edge sword gift.
Assuming we always take the same position sizing, increasing the leverage speed up how fast a margin could be ..... called. (bad joke? feel free to tell me). Not saying it will, saying it introduces more risk by design.
Then one could say "I'll just turn off that stupid margin call option". And that's when someone starts backtesting with unrealistic market conditions.
Finally...
When I backtest I always assume the worst in every scenario possible (because I'm French), I always try to minimize the risk first (also because I'm French), keeping as close from 0 as possible (French again)
Then I add the "opportunity" component, looking to catch the maximum of opportunity while keeping the risk low.
It's like a Rubix cube puzzle - decreasing the risk is one side of the equation but whenever I try to catch more opportunity... my risks increases.
Then I update my risk... and now the opportunity decreases... (#wut #wen #simple)
Completely removing the risk from a trading strategy isn't something I wouldn't dare doing.
Trading involves risk. Being obsessed by decreasing the risk is what I do BEST :)
Dave
BTC-D

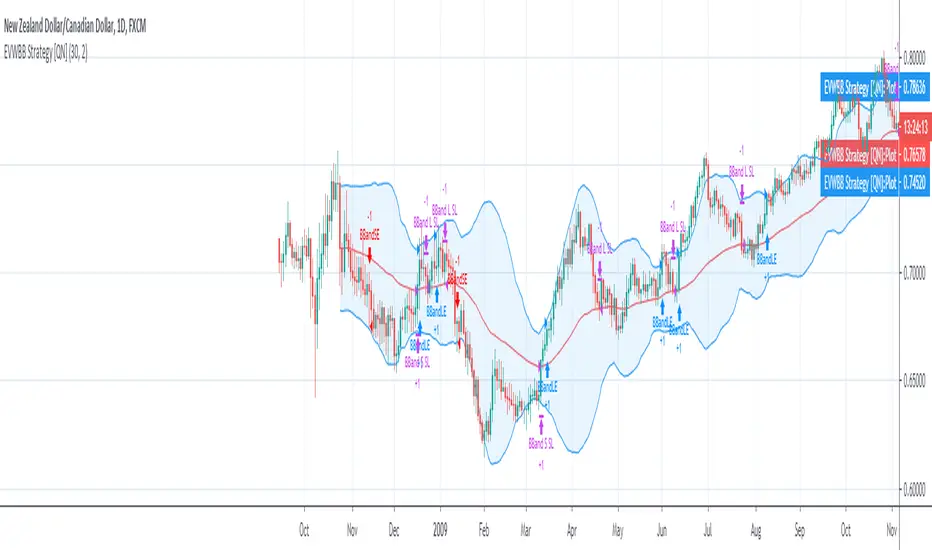
EVWBB Strategy [QuantNomad]It's my new strategy using EVWMA (Elastic Volume Weighted Moving Average).
Now I created a Bollinger Bands strategy where basis level is EVWMA.
It looks pretty interesting but you have to be careful with the entries/exits on the same bar, I'm using stop orders, so on big moves it happens pretty often.
In the next version, I will try to eliminate these issues.
Entry for this strategy happens when price crossover upper for long and lower for short. I exit both short and long on basis level.
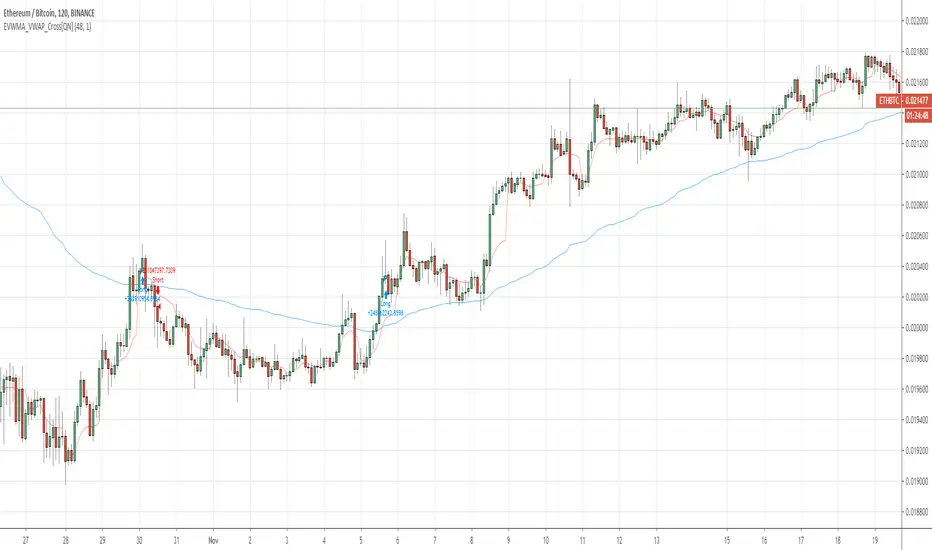
EVWMA VWAP Cross Strategy [QuantNomad]Continue to experiement with VWAP and EVWMA.
It seems that just simple crosses between VWAP and EVWMA can be pretty good signals. VWAP is a bit choppy so you can use VWAP smoothing input to smoth it a bit.
Here are few other strategies based on EVWMA:
EVWMA VWAP MACD Strategy
QuantNomad - EVWMA MACD Strategy
QuantNomad - EVWMA MACD StrategyPretty simple EVWMA (Elastic Volume Weighted Moving Average ) MACD Strategy.
EVWMA is a quite interesting moving average where the period of the MA is defined from the volume itself.
It incorporates volume information in a natural and logical way. The EVWMA can be looked at as an approximation to the average price paid per share.
As a volume period, you can use sum of the last x bars volumes.
Here are other EVWMA indicators/strategies:
EVWMA indicator:
EVWMA Cross strategy:

Simple BTC trading strategy based on yesterday's trading rangeOnce market opens, the strategy calculates the price to send a stop buy order
The order is calculated as the sum of yesterday's range multiplied by a special number and today's open price
System has no stops yet
System closes the position on session close
The performance is quite good
Feel free to use it and trade it
Good luck and good trading

QuantNomad - Significant Pivot Reversal StrategyI'm working on improving the Pivot Points Reversal Strategy.
As one of the ways to filter out insignificant levels I decided to check that pivot point is not above/below neighbors, but check that it's above/below at least by a certain amount.
I use ATR, so in params, you can set length of ATR and also ATR multiplier. The new level will be calculated only if PP will be above/below neighbors by atr * atr_mult.
It seems this approach might help in some cases.
Here I have PivotPoint + RSI strategy:
QuantNomad - EVWMA Cross StrategyPretty simple EVWMA (Elastic Volume Weighted Moving Average) Cross Strategy. Long on bullish cross, Short on Bearish Crosss.
EVWMA is a quite interesting moving average where period of the MA is defined from volume itself.
It incorporates volume information in a natural and logical way. The eVWMA can be looked at as an approximation to the average price paid per share.
As a volume period you can use sum of the last x bars volumes.
Here is EVWMA as an indicator:

REAL STRATEGY : Dow_Factor_MFI/RSI_DVOG_StrategyI'm actually one of those who think it's more important to extract clues from indicators than strategy, but I wanted to test the data about the probability and dow factor I've shared for a long time.
Usually, Bitcoin is used as an eye stain for strategy success, since the graph has increased significantly from the beginning.
To prevent this, I used a commission and in the last lines of document I shared Bitmex's Bitcoin and Ethereum 1W test results.
I don't think there's a factor to repaint. ( Warn me if u see or observe )
I considered Bitcoin because I found working with liquid parities much more realistic.
Ethereum and Bitmex have been featured as a spot and may soon find a place at the CME , so I've evaluated the Ethereum .
But since the Ethereum Bitmex was also spot new, I deleted results that were less than 10 closed trades.
Since the Dow Theory also looks at the harmony in the indices, just try it in the Cryptocurrency market.
Use as indicator in other markets. Support with channels, trend lines with big periods and other supportive indicators.
And my personal suggestion : Use this script and indicator TF : 4H and above.
Specifications :
Commission. ( % 0.125 )
Switchable Methods ( Relative Strength Index / Money Flow Index )
Alarms. (Buy / Sell )
Position closure when horizontal market rates weighs.
Progressive gradual buy/sell alarms.
Clean code layout that will not cause repaint. (Caution : source = close )
Switchable barcolor option (I / 0 )
*****Test results :*****
drive.google.com
Summary:
It was a realistic test.
It has achieved great success in some markets, but as I mentioned earlier, use it only to gain insight into the price movements of cryptos.
Use as indicator in other markets.
This code is open source under the MIT license. If you have any improvements or corrections to suggest, please send me a pull request via the github repository : github.com
Stay tuned ! Noldo.

Strategy based on the principles of Price ActionIt is considered the percentage of candles with low and high closure for a certain period. Then, a moving average is built from these values. When the moving average of the ratio of tall candles to low candles is greater than the ratio of low candles to high, then long (that is, when the green line crosses the red). And vice versa - a condition for short. It also works on crypto with other settings. Idea for improvement: you can make partial exit by taking, at certain profit levels, the chart will be more stable. Result with a commission of 0.004% You can create an optimizer, and use this strategy on any liquid asset. (Sorry for google translator)

Lancelot vstop intraday trending strategyDear all,
Free strategy again.
I found using 3 volatility stop with different settings could be very helpful when trading an intraday trending market.
With the ATR setting or 5, 10, 15, we can weed out many false break.
Vstop setting is OHLC4.
On the other hand, this strategy also utilize Renko as part of the strategy, so you could say this strategy is mainly an intraday break out trend following strategy.
Works well on BTCUSD XBTUSD, as well as other major liquid alt Pairs.
And lastly,
Save Hong Kong, the revolution of our times.

QuarryLake v4As some of you requested, I will make the code for QuarryLake Open for you all.
I have also updated the script in version 4.
This strategy consists of 3 indicators that I found works quite well together.
Keltner Channel, Waddah Attah Explosion, and Volatility Stop .
KC Period = 200
KCATR = 5
Vstop Period = 3
Vstop Mult = 1.5
Long when close > KC, close > Vstop, WAE trendUp
Short when close < KC, close < Vstop, WAE trendDown
Works well on BTCUSD XBTUSD , as well as other major liquid Pair.
This strategy utilized a modified Kelly position sizing for BTCUSD Bitstamp , feel free to modify it to your needs.
And lastly,
Save Hong Kong, the revolution of our times.

Lancelot RR StrategyDear all,
Free strategy again.
This strategy consists of 2 indicators I think works well with each other as a trend following strategy.
The 2 indicators are Renko chart and Relative Vigor Index.
This is a long-only breakout strategy that aims to capture the majority of the trend.
Works well on BTCUSD XBTUSD, as well as other major liquid Pair.
Please acknowledge my effort by like and follow.
And lastly,
Save Hong Kong, the revolution of our times.

BTC strategy for margin tradingAlmost identical to the one I published before, but this one includes short orders as well.
I didn't spend much time backtesting, so there may be a different set of parameters that gives better results. Please let me know if you find something!

Ema BacktesterA simple, but useful script for backtesting purposes. Find the optimal Settings for your strategy.
tips are always welcome at: 38uGQJDDZDL6wX48x4gYTccPeQ3ZHVYmY4 (btc)
I hope you enjoy the script :)

QuantNomad - Pivot Reversal Strategy - XBTUSD - 1hPivot reversal strategy almost always works pretty good for crypto.
Here is setup with 4 left, 4 right bars for pivot points for XBTUSD 1h chart.
It shows a pretty nice performance of 350% with only 10% dd, Sharpe is 1.16.
If you're interested in using this strategy in my scripts you can find alerts for it and a version with added backtesting range.
And remember:
Past performance does not guarantee future results.

Moving Average Strategy of BiznesFilosofWhat is brilliant is simple! Therefore, this strategy works very well. It is configured on bitcoin. But you can use it for other tools. Only need to change the settings.
Remember that this is not a panacea, but only an assistant! You yourself have to choose which entry and exit points to choose.
In more detail about strategy on my channel in YouTube.
===
Что гениально, то просто! Потому, эта стратегия очень хорошо работает. Настроена она на биткоин. Но можно использовать и для других инструментов. Только нужно поменять настройки.
Помните, что это не панацея, а только помощник! Вы сами должны панимать, какие выбирать точки входа и выхода.
Более подробно про стратегию на моём канале в Ютуб.

Buy The Dip - Does It Work?Buying the dip has become a meme in crypto, but does it actually work?
Using this script you can find out.
The dip is defined here as the average true range multiplied by a number of your choosing (dipness input) and subtracted from the low.
When price crosses under the dip level, a long is initiated. The long is then closed using a timestop (default value 20 bars), no fancy exits here.
A general rule for buying the dip should be to be more passive in a bull market and aggressive in a bear market.
Same goes for all counter trend trading.
Heres a few other examples of dip buying statistics using the H4 timeframe:
50% profitable, 1.692 Profit Factor
BINANCE:PIVXBTC
56.52% profitable, 1.254 Profit Factor
BINANCE:KMDBTC
27.27% Profitable, 0.257 Profit Factor... yikes!
BINANCE:BTSBTC
73.33% Profitable, 13.627 Profit Factor... o.O
BINANCE:MANABTC

Powerfull strategy MACD + RSI + Stoch buy on High exit on ATRMy strategy uses a combination of three indicators MACD Stochastic RSI .
The Idea is to buy when ( MACD > Signal and RSI > 50 and Stochastic > 50) occures at the same time the BUY STop we place on previous day HIGH
We exit on Take profit or Stop loss which is calculated by ATR (10) or on the opposite signal "Volatility breakout"
This strategy works well on stocks, commodities and cryptos especially during market breaking up after consolidation
The best results are on Daily charts , so its NOT a scalping strategy. But it can work also on 1H charts.
The strategy does not have any stops and profit targets, so we can take all the market can give us at the moment.
The exit point only when MACD goes under Signal
Its Preformance is significantly better with "buy stop on High.1" idea and exit on "volatility price breakout"
So, use it, trade it.
If it will help you to imprive your trading results, please donate me
BTC: 12kd1F8buWisUBdq27BBwRkUvzW7Ey3og5

MACD + Stochastic + RSI StrategyMy strategy uses a combination of three indicators MACD Stochastic RSI.
The Idea is to buy when (MACD > Signal and RSI > 50 and Stochastic > 50) occures at the same time
This strategy works well on stocks and cryptos especially during market breaking up after consolidation
The best results are on Daily charts, so its NOT a scalping strategy. But it can work also on 1H charts.
The strategy does not have any stops and profit targets, so we can take all the market can give us at the moment.
The exit point only when MACD goes under Signal
Its Preformance is quite stable.
So, use it, trade it.
If it will help you to imprive your trading results, please donate me
BTC: 12kd1F8buWisUBdq27BBwRkUvzW7Ey3og5

U&Dif price has moved up since 1 to 3 candles ago = buy
if price has moved down since 1 to 3 candles ago = sell
has internal SL & TP
tested on
BITFINEX:ETHUSD
BITFINEX:BTCUSD
BITFINEX:LTCUSD
BITFINEX:ETHBTC
4 hour charts

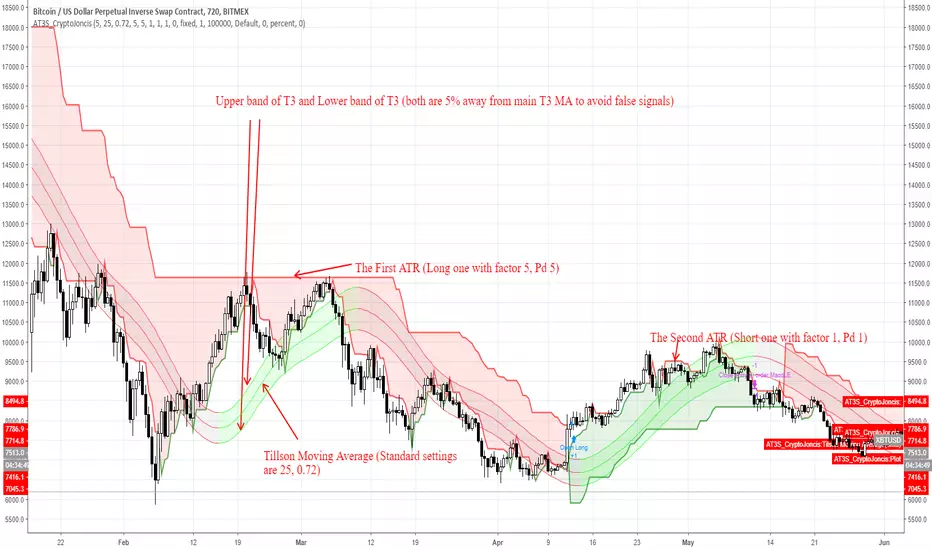
ATR and T3 strategyT3 Moving Average indicator was originally developed by Tim Tillson in 1998/99.
T3 Moving Average is considered as improved and better to traditional moving averages as it is smoother and performs better in trending market conditions.
It offers multiple opportunities when the price is in the state of retracement and therefore allows to minimize your exposed risk and allowing your profits run.
This strategy is for trend followers who are patient enough to have 6-10 trades per year.
What's included in strategy?
Two ATR (Code was taken from J.Dow and modified)
Tillson Moving average
Enter long signal:
When both ATR (Long and Short) are in uptrend and the bar closes above Upper Tillson's moving average band: Enter Long
Exit Long signal:
When hl2 is lower than Lower Tillson Moving Average band
Enter short signal:
When both ATR (Long and Short) are in downtrend and the bar closes below Lower Tillson's moving average band: Enter Short
Exit Shortsignal:
When hl2 is higher than Upper Tillson's Moving Average band
Best to use with Bitcoin on 12H TF
Can be used for different time frames as well but the settings must be adjusted accordingly
Remember, overtrading can be harmful to your trading account.
If this is helpful for you, consider a tip
BTC: 3FiBnveHo3YW6DSiPEmoCFCyCnsrWS3JBR
ETH: 0xac290B4A721f5ef75b0971F1102e01E1942A4578
Created by CryptoJoncis