Bollinger Bands Forecast [QuantAlgo]🟢 Overview
Bollinger Bands are widely recognized for mapping volatility boundaries around price action, but they inherently lag behind market movement since they calculate based on completed bars. The Bollinger Bands Forecast addresses this limitation by adding a predictive layer that attempts to project where the upper band, lower band, and basis line might position in the future. The indicator provides three unique analytical models for generating these projections: one examines swing structure and breakout patterns, another integrates volume flow and accumulation metrics, while the third applies statistical trend fitting. Traders can select whichever methodology aligns with their market view or trading style to gain visibility into potential future volatility zones that could inform position planning, risk management, and timing decisions across various asset classes and timeframes.
🟢 How It Works
The core calculation begins with traditional Bollinger Bands: a moving average basis line (configurable as SMA, EMA, SMMA/RMA, WMA, or VWMA) with upper and lower bands positioned at a specified number of standard deviations away. The forecasting extension works by first generating predicted price values for upcoming bars using the selected method. These projected prices then feed into a rolling calculation that simulates how the basis line would update bar by bar, respecting the mathematical properties of the chosen moving average type. As each new forecasted price enters the calculation window, the oldest historical price drops out, mimicking the natural progression of the moving average. The system recalculates standard deviation across this evolving price window and applies the multiplier to determine where upper and lower bands would theoretically sit. This process repeats for each of the forecasted bars, creating a connected chain of potential future band positions that render as dashed lines on the chart.
🟢 Key Features
1. Market Structure Model
This forecasting approach interprets price through the lens of swing analysis and structural patterns. The algorithm identifies pivot highs and lows across a definable lookback window, then tracks whether price is forming higher highs and higher lows (bullish structure) or lower highs and lower lows (bearish structure). The system looks for break of structure (BOS) when price pushes beyond a previous swing point in the trending direction, or change of character (CHoCH) when price starts creating opposing swing patterns.
When projecting future prices, the model considers current distance from recent swing levels and the strength of the established trend (measured by counting higher highs versus lower lows). If bullish structure dominates and price sits near a swing low, the forecast biases upward. Conversely, bearish structure near a swing high produces downward bias. ATR scaling ensures the projection magnitude relates to actual market volatility.
Practical Implications for Traders:
Useful when you trade based on swing points and structural breaks
The Structure Influence slider (0 to 1) lets you dial in how much weight structure analysis carries versus pure trend
Helps visualize where bands could form around key structural levels you're watching
Works better in trending conditions where structure patterns are clearer
Might be less effective in choppy, sideways markets without defined swings
2. Volume-Weighted Model
This method attempts to incorporate volume flow into the price forecast. It combines three volume-based metrics: On-Balance Volume (OBV) to track cumulative buying/selling pressure, the Accumulation/Distribution Line to measure money flow, and volume-weighted price changes to emphasize moves that occur on high volume. The algorithm calculates the slope of these indicators to determine if volume is confirming price direction or diverging from it.
Volume spikes above a configurable threshold are flagged as potentially significant, with the direction of the spike (whether it occurred on an up bar or down bar) influencing the forecast. When OBV, A/D Line, and volume momentum all align in the same direction, the model projects stronger moves. When they conflict or show weak volume support, the forecast becomes more conservative.
Practical Implications for Traders:
Relevant if you use volume analysis to confirm price moves
More meaningful in markets with reliable volume data
The Volume Influence parameter (0 to 1) controls how much volume factors into the projection
Volume Spike Threshold adjusts sensitivity to what constitutes unusual volume
Helps spot scenarios where volume doesn't support a move, suggesting possible consolidation
Might be less effective in low-liquidity instruments or markets where volume reporting is unreliable
3. Linear Regression Model
The simplest of the three methods, linear regression fits a straight line through recent price data using least-squares mathematics and extends that line forward. This creates a clean trend projection without conditional logic or interpretation of market characteristics. The forecast simply asks: if the recent trend continues at its current rate of change, where would price be in 10 or 20 bars?
Practical Implications for traders:
Provides a neutral, mathematical baseline for comparison
Works well when trends are steady and consistent
Can be useful for backtesting since results are deterministic
Requires minimal configuration beyond lookback period
Might not adapt to changing market conditions as dynamically as the other methods
Best suited for trending markets rather than ranging or volatile conditions
🟢 Universal Applications Across All Models
Regardless of which forecasting method you select, the indicator projects future Bollinger Band positions that may help with:
▶ Pre-planning entries and exits: See where potential support (lower band) or resistance (upper band) might develop before price gets there
▶ Volatility context: Observe whether forecasted bands are widening (suggesting potential volatility expansion) or narrowing (possible compression or squeeze setup)
▶ Target setting: Reference projected band levels when determining profit targets or stop placement
▶ Mean reversion scenarios: Visualize potential paths back toward the basis line when price extends to a band extreme
▶ Breakout anticipation: Consider where upper or lower bands might sit if price begins a strong directional move
▶ Strategy development: Build trading rules around forecasted band interactions, such as entering when price is projected to return to the basis or exit when forecasts show band expansion
▶ Method comparison: Switch between the three forecasting models to see if they agree or diverge, potentially using consensus as a confidence filter
It's critical to understand that these forecasts are projections based on recent market behavior. Markets are complex systems influenced by countless factors that cannot be captured in a technical calculation or predicted perfectly. The forecasted bands represent one possible scenario of how volatility might unfold, so actual price action may still diverge from these projections. Past performance and historical patterns provide no assurance of future results. Use these forecasts as one input within a broader trading framework that includes proper risk management, position sizing, and multiple forms of analysis. The value lies not in prediction accuracy but in helping you think probabilistically about potential market states and plan accordingly.
BTCUSD

The Abramelin Protocol [MPL]"Any sufficiently advanced technology is indistinguishable from magic." — Arthur C. Clarke
🌑 SYSTEM OVERVIEW
The Abramelin Protocol is not a standard technical indicator; it is a "Technomantic" trading algorithm engineered to bridge the gap between 15th-century esoteric mathematics and modern high-frequency markets.
This script is the flagship implementation of the MPL (Magic Programming Language) project—an open-source experimental framework designed to compile metaphysical intent into executable Python and Pine Script algorithms.
Unlike traditional indicators that rely on arbitrary constants (like the 14-period RSI or 200 SMA), this protocol calculates its parameters using "Dynamic Entity Gematria." We utilize a custom Python backend to analyze the ASCII vibrational frequencies of specific metaphysical archetypes, reducing them via Tesla's 3-6-9 harmonic principles to derive market-responsive periods.
🧬 WHAT IS ?
MPL (Magic Programming Language) is a domain-specific language and research initiative created to explore Technomancy—the art of treating code as a spellbook and the market as a chaotic entity to be tamed.
By integrating the logic of ancient Grimoires (such as The Book of Abramelin) with modern Data Science, MPL aims to discover hidden correlations in price action that standard tools overlook.
🔗 CONNECT WITH THE PROJECT:
If you are a developer, a trader, or a seeker of hidden knowledge, examine the source code and join the order:
• 📂 Official Project Site: hakanovski.github.io
• 🐍 MPL Source Code (GitHub): github.com
• 👨💻 Developer Profile (LinkedIn): www.linkedin.com
🔢 THE ALGORITHM: 452 - 204 - 50
The inputs for this script are mathematically derived signatures of the intelligence governing the system:
1. THE PAIMON TREND (Gravity)
• Origin: Derived from the ASCII summation of the archetype PAIMON (King of Secret Knowledge).
• Function: This 452-period Baseline acts as the market's "Event Horizon." It represents the deep, structural direction of the asset.
• Price > Line: Bullish Domain.
• Price < Line: Bearish Void.
2. THE ASTAROTH SIGNAL (Trigger)
• Origin: Derived from the ASCII summation of ASTAROTH (Knower of Past & Future), reduced by Tesla’s 3rd Harmonic.
• Function: This is the active trigger line. It replaces standard moving averages with a precise, gematria-aligned trajectory.
3. THE VOLATILITY MATRIX (Scalp)
• Origin: Based on the 9th Harmonic reduction.
• Function: Creates a "Cloud" around the signal line to visualize market noise.
🛡️ THE MILON GATE (Matrix Filter)
Unique to this script is the "MILON Gate" toggle found in the settings.
• ☑️ Active (Default): The algorithm applies the logic of the MILON Magic Square. Signals are ONLY generated if Volume and Volatility align with the geometric structure of the move. This filters out ~80% of false signals (noise).
• ⬜ Inactive: The algorithm operates in "Raw Mode," showing every mathematical crossover without the volume filter.
⚠️ OPERATIONAL USAGE
• Timeframe: Optimized for 4H (The Builder) and Daily (The Architect) charts.
• Strategy: Use the Black/Grey Line (452) as your directional bias. Take entries only when the "EXECUTE" (Long) or "PURGE" (Short) sigils appear.
Use this tool wisely. Risk responsibly. Let the harmonics guide your entries.
— Hakan Yorganci
Technomancer & Full Stack Developer

Mutanabby_AI | ONEUSDT_MR1
ONEUSDT Mean-Reversion Strategy | 74.68% Win Rate | 417% Net Profit
This is a long-only mean-reversion strategy designed specifically for ONEUSDT on the 1-hour timeframe. The core logic identifies oversold conditions following sharp declines and enters positions when selling pressure exhausts, capturing the subsequent recovery bounce.
Backtested Period: June 2019 – December 2025 (~6 years)
Performance Summary
| Metric | Value |
|--------|-------|
| Net Profit | +417.68% |
| Win Rate | 74.68% |
| Profit Factor | 4.019 |
| Total Trades | 237 |
| Sharpe Ratio | 0.364 |
| Sortino Ratio | 1.917 |
| Max Drawdown | 51.08% |
| Avg Win | +3.14% |
| Avg Loss | -2.30% |
| Buy & Hold Return | -80.44% |
Strategy Logic :
Entry Conditions (Long Only):
The strategy seeks confluence of three conditions that identify exhausted selling:
1. Prior Move Filter:*The price change from 5 bars ago to 3 bars ago must be ≥ -7% (ensures we're not entering during freefall)
2. Current Move Filter: The price change over the last 2 bars must be ≤ 0% (confirms momentum is stalling or reversing)
3. Three-Bar Decline: The price change from 5 bars ago to 3 bars ago must be ≤ -5% (confirms a significant recent drop occurred)
When all three conditions align, the strategy identifies a potential reversal point where sellers are exhausted.
Exit Conditions:
- Primary Exit: Close above the previous bar's high while the open of the previous bar is at or below the close from 9 bars ago (profit-taking on strength)
- Trailing Stop: 11x ATR trailing stop that locks in profits as price rises
Risk Management
- Position Sizing:Fixed position based on account equity divided by entry price
- Trailing Stop:11× ATR (14-period) provides wide enough room for crypto volatility while protecting gains
- Pyramiding:Up to 4 orders allowed (can scale into winning positions)
- **Commission:** 0.1% per trade (realistic exchange fees included)
Important Disclaimers
⚠️ This is NOT financial advice.
- Past performance does not guarantee future results
- Backtest results may contain look-ahead bias or curve-fitting
- Real trading involves slippage, liquidity issues, and execution delays
- This strategy is optimized for ONEUSDT specifically — results may differ on other pairs
- Always test before risking real capital
Recommended Usage
- Timeframe:*1H (as designed)
- Pair: ONEUSDT (Binance)
- Account Size: Ensure sufficient capital to survive max drawdown
Source Code
Feedback Welcome
I'm sharing this strategy freely for educational purposes. Please:
- Drop a comment with your backtesting results any you analysis
- Share any modifications that improve performance
- Let me know if you spot any issues in the logic
Happy trading
As a quant trader, do you think this strategy will survive in live trading?
Yes or No? And why?
I want to hear from you guys

主流币种中长线趋势系统This script is a comprehensive trading system designed for medium-to-long-term analysis of mainstream assets. It combines custom volatility algorithms, trend momentum filters, and market structure analysis to identify high-probability reversal points (Tops/Bottoms) and trend-following entry opportunities.
It eliminates market noise and provides clear visual signals, making it suitable for traders looking to capture major market swings without staring at the screen 24/7.
这是一个专为主流资产中长线交易设计的综合分析系统。它融合了自定义的波动率算法、趋势动量过滤器以及市场结构分析,旨在识别高胜率的趋势反转点(顶/底)以及右侧顺势入场机会。
本系统有效过滤了市场噪音,提供清晰的视觉信号,非常适合希望捕捉市场主升浪/主跌浪的交易者。
How to Use / 信号使用说明
The system provides three layers of information: Reversal Warnings, Trend Confirmations, and Key Levels.
本系统提供三个维度的信息:反转预警、趋势确认、关键位结构。
1. Reversal Signals (Top & Bottom) / 顶底反转信号
These signals appear when the market is overheated or oversold based on our proprietary composite algorithm.
这些信号出现在市场极度贪婪或恐慌的时刻,基于独家的复合算法计算得出。
"底" (Bottom) Label (Green): Indicates a potential market bottom or accumulation zone. It suggests that downside momentum is exhausted.
"底"(绿色标签): 提示潜在的市场底部或吸筹区,意味着下跌动能衰竭,是左侧关注买入机会的参考。
"顶" (Top) Label (Red): Indicates a potential market top or distribution zone. It suggests that upside momentum is unsustainable.
"顶"(红色标签): 提示潜在的市场顶部或派发区,意味着上涨动能不可持续,是左侧止盈或减仓的参考。
2. Trend Entry Signals (Circles) / 趋势入场信号 (圆点)
These signals are generated only when the trend direction is confirmed and multiple filters align.
只有在趋势方向明确,且多个动量过滤器发生共振时,才会触发此类信号。
Green Circle: Confirmed Long entry. Best used when price action breaks out of consolidation or resumes an uptrend.
绿色圆点: 确认的多头入场信号。通常在价格突破盘整或上升趋势延续时出现,适合右侧顺势交易。
Red Circle: Confirmed Short entry. Indicates the start or continuation of a bearish trend.
红色圆点: 确认的空头入场信号。预示着下跌趋势的开始或延续。
3. Market Structure (Boxes & Lines) / 市场结构 (方框与线条)
Boxes: These represent institutional Order Blocks (Support/Resistance zones).
方框: 代表机构的关键订单块区域(强支撑/压力区)。
Lines: These visualize Break of Structure (BOS) or Change of Character (CHoCH), helping you understand the current market phase.
线条: 可视化显示市场结构的破坏与反转,帮助你判断当前是处于上涨结构还是下跌结构中。
Settings & Optimization / 设置与优化
Signal Mode (辅助提示模式):
Conservative (保守模式): Fewer signals, higher precision. Best for risk-averse traders.
Balanced (平衡模式): Default setting, balanced between frequency and accuracy.
Aggressive/Demon (激进/恶魔模式): More signals, captures smaller swings but with more noise.
Trade Mode (交易模式): You can choose to display signals for "Both Sides", "Long Only", or "Short Only" to fit your strategy.
Alerts / 警报系统
The script supports real-time alerts. When a signal is triggered, the alert message will also intelligently calculate and include the nearest Pressure (Resistance) and Support price levels based on current market structure.
脚本支持实时警报。当信号触发时,警报消息还会智能计算并附带当前最近的压力位和支撑位价格,方便挂单。
此版本有效期至2026年1月
Disclaimer / 免责声明
This script is for educational and analytical purposes only. Past performance does not guarantee future results. Please manage your risk strictly.
本脚本仅供教育和分析使用。过往表现不代表未来结果。请严格管理您的风险。

Stochastic RSI Forecast [QuantAlgo]🟢 Overview
The Stochastic RSI Forecast extends the classic momentum oscillator by projecting potential future K and D line values up to 10 bars ahead. Unlike traditional indicators that only reflect historical price action, this indicator uses three proprietary forecasting models, each operating on different market data inputs (price structure, volume metrics, or linear trend), to explore potential price paths. This unique approach allows traders to form probabilistic expectations about future momentum states and incorporate these projections into both discretionary and algorithmic trading and/or analysis.
🟢 How It Works
The indicator operates through a multi-stage calculation process that extends the RSI-to-Stochastic chain forward in time. First, it generates potential future price values using one of three selectable forecasting methods, each analyzing different market dimensions (structure, volume, or trend). These projected prices are then processed through an iterative RSI calculation that maintains continuity with historical gain/loss averages, producing forecasted RSI values. Finally, the system applies the full stochastic transformation (calculating the position of each forecasted RSI within its range, smoothing with K and D periods) to project potential future oscillator values.
The forecasting models adapt to market conditions by analyzing configurable lookback periods and recalculating projections on every bar update. The implementation preserves the mathematical properties of the underlying RSI calculation while extrapolating momentum trajectories, creating visual continuity between historical and forecasted values displayed as semi-transparent dashed lines extending beyond the current bar.
🟢 Key Features
1. Market Structure Model
This algorithm applies price action analysis by tracking break of structure (BOS) and change of character (CHoCH) patterns to identify potential order flow direction. The system detects swing highs and lows using configurable pivot lengths, then analyzes sequences of higher highs or lower lows to determine bullish or bearish structure bias. When price approaches recent swing points, the forecast projects moves in alignment with the established structure, scaled by ATR (Average True Range) for volatility adjustment.
Potential Benefits for Traders:
Explores potential momentum continuation scenarios during established trends
Identifies areas where structure changes might influence momentum
Could be useful for swing traders and position traders who incorporate structure-based analysis
The Structure Influence parameter (0-1 scale) allows blending between pure trend following and structure-weighted forecasts
Helps visualize potential trend exhaustion through weakening structure patterns
2. Volume-Weighted Model
This model analyzes volume patterns by combining On-Balance Volume (OBV), Accumulation/Distribution Line, and volume-weighted price returns to assess potential capital flow. The algorithm calculates directional volume momentum and identifies volume spikes above customizable thresholds to determine accumulation or distribution phases. When volume indicators align directionally, the forecast projects stronger potential moves; when volume diverges from price trends, it suggests possible reversals or consolidation.
Potential Benefits for Traders:
Incorporates volume analysis into momentum forecasting
Attempts to filter price action by volume support or lack thereof
Could be more relevant in markets where volume data is reliable (equities, crypto, major forex pairs)
Volume Influence parameter (0-1 scale) enables adaptation to different market liquidity profiles
Highlights volume climax patterns that sometimes precede trend changes
Could be valuable for traders who incorporate volume confirmation in their analysis
3. Linear Regression Model
This mathematical approach applies least-squares regression fitting to project price trends based on recent price data. Unlike the conditional logic of the other methods, linear regression provides straightforward trend extrapolation based on the best-fit line through the lookback period.
Potential Benefits for Traders:
Delivers consistent, reproducible forecasts based on statistical principles
Works better in trending markets with clear directional bias
Useful for systematic traders building quantitative strategies requiring stable inputs
Minimal parameter sensitivity (primarily controlled by lookback period)
Computationally efficient with fast recalculation on every bar
Serves as a baseline to compare against the more complex structure and volume methods
🟢 Universal Applications Across All Models
Each forecasting method projects potential future stochastic RSI values (K and D lines), which traders can use to:
▶ Anticipate potential crossovers: Visualize possible K/D crosses several bars ahead
▶ Explore overbought/oversold scenarios: Forecast when momentum might return from extreme zones
▶ Assess divergences: Evaluate how oscillator divergences might develop
▶ Inform entry timing: Consider potential points along the forecasted momentum curve for trade entry
▶ Develop systematic strategies: Build rules based on forecasted crossovers, slope changes, or threshold levels
▶ Adapt to market conditions: Switch between methods based on current market character (trending vs range-bound, high vs low volume)
In short, the indicator's flexibility allows traders to combine forecasting projections with traditional stochastic signals, using historical K/D for immediate reference while considering forecasted values for planning and analysis. As with all technical analysis tools, the forecasts represent one possible scenario among many and should be used as part of a broader trading methodology rather than as standalone signals.

Ellipse Price Action Indicator v3Successful Trade Setup Using Ellipse Price Action Indicator (EPAI) 🔥
With the help of the Ellipse Price Action Indicator, this bearish trade setup played out perfectly.
EPAI generated a Sell Signal with a red arrow.
According to the EPAI method:
🔹 If price makes a new high on the next candle — add one more unit.
🔹 Every time a new high forms, add one more unit per candle.
🔹 Exit all units at the Moving Average (MA) — this is the core risk-controlled exit rule.
This is why EPAI consistently provides successful trade setups when followed with discipline.
⚠ Important Notice — Last Chance!
The Ellipse Price Action Indicator (EPAI) will soon become PRIVATE.
Access will be restricted only to Premium Members.
✅ First 25 subscribers can use this indicator absolutely FREE.
After that, it will not be available publicly.

Green to Red Money RailsWhat this indicator does
Green to Red Money Rails (G2R Rails) is a price-action tool that draws dynamic “rails” from recent swing lows and highs. It tracks how support and resistance are shifting so you can see where trend pressure is building or weakening.
Core logic (high level)
Detects pivot lows and stores the last three (L1, L2, L3).
Builds green support “fans”: inner dotted rails L1→L2 and L2→L3, plus a main solid base rail L1→L3.
Detects pivot highs and, when the last high is lower than the previous one, draws a red resistance rail from H2→H3.
Optional labels mark the most recent swing low (“L”) and swing high (“H”).
How to use it
Use the green rails as dynamic support zones for trend-following, pullback entries, or stop placement.
Use the red rail as a visual ceiling in downtrends: breaks above it can signal the end of a sell-off; rejections at it confirm sellers still in control.
Works best on liquid markets and swing-trading timeframes (for example, 1h–1D). Always combine with your own risk management and higher-timeframe context.
This script does not auto-generate signals or manage risk for you; it is a visual framework for reading structure and building your own trading plans.

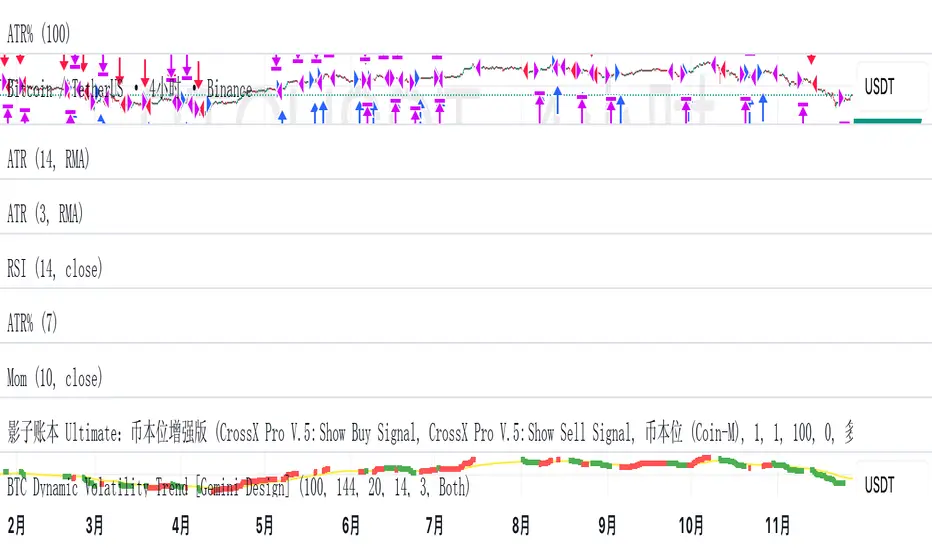
BTC Dynamic Volatility Trend Backtested from 2017 to present, this strategy has delivered a staggering 7100%+ cumulative return. It doesn't just track the market; it dominates it. By capturing major trends and strictly limiting drawdowns, it has significantly outperformed the standard 'Buy & Hold' BTC strategy, proving its ability to generate massive alpha across multiple bull and bear cycles.
自 2017 年至今,本策略实现了惊人的 7100%+ 累计收益率。它不仅仅是跟随市场,更是超越了市场。通过精准捕捉主升浪并严格控制回撤,该策略在穿越多轮牛熊周期后,大幅度跑赢了比特币‘买入持有’(Buy & Hold)的基准收益,展现了极致的阿尔法(Alpha)捕捉能力。"
Introduction :Simplicity is the ultimate sophistication. This strategy is designed specifically for Bitcoin (BTC), capturing its unique characteristics: high volatility, frequent fakeouts, and massive trend persistence. It abandons complex indicators in favor of a robust logic: "Follow the Trend, Filter the Noise, Let Profits Run."
Core Logic
Trend Filter (Fibonacci EMA 144): We use the 144-period Exponential Moving Average as the baseline. Longs are only taken above this line, and shorts only below. This keeps you on the right side of the major trend.
Volatility Breakout (Donchian Channel 20): Entries are triggered only when price breaks the 20-day high (for longs) or low (for shorts). This confirms momentum and avoids trading in chop.
Dynamic Risk Management (ATR Chandelier Exit):
Instead of fixed % stops, we use Average True Range (ATR) to calculate stop losses.
The Ratchet Mechanism: The stop loss moves up with the price but never moves down (for longs). This locks in profits automatically as the trend develops and exits immediately when volatility turns against you.
Why Use This Strategy?
Zero Repainting: All signals are confirmed.
No Curve Fitting: Uses classic parameters (144, 20) that have worked for decades.
Mental Peace: The strategy handles the exit. You don't need to guess where to sell. It holds through minor corrections and exits only when the trend truly reverses.
Settings
Leverage %: Adjust your position size based on equity (default 100% = 1x).
Timeframe: Recommended for 4H charts.
中文版 (Chinese Version)
简介 :大道至简。本策略专为 比特币 (BTC) 设计,针对其高波动、假突破多但趋势爆发力强的特点,摒弃了复杂的过度拟合指标,回归交易本质:“顺大势,滤噪音,截断亏损,让利润奔跑”。
核心逻辑
趋势过滤器 (斐波那契 EMA 144): 使用 144 周期指数移动平均线作为多空分水岭。价格在均线之上只做多,之下只做空。这能有效过滤掉大部分震荡市的噪音。
波动率突破 (唐奇安通道 20): 只有当价格突破过去 20 根 K 线的最高价(做多)或最低价(做空)时才进场。这确保了我们只在趋势确立的瞬间入场。
动态风控 (ATR 吊灯止损):
拒绝固定点数止损,使用 ATR(平均真实波幅)根据市场热度动态计算安全距离。
棘轮机制: 止损线会跟随价格上涨而上移,但绝不会下移(做多时)。这实现了自动化的“利润锁定”,既能扛住正常的波动回调,又能在大势反转时果断离场。
策略优势
绝不重绘: 所有信号均为收盘确认或实时触价。
拒绝拟合: 使用经过数十年市场验证的经典参数组合。
心态管理: 策略全自动管理出场。你不需要纠结何时止盈,它会帮你吃到完整的鱼身,直到趋势结束。
使用建议
资金管理: 可通过参数调整仓位占比(默认 100% = 1倍杠杆)。
推荐周期: 建议在4小时 图表上运行效果最佳。
Crypto Scalping Strategy by SAIFOverview
An optimized scalping strategy designed for cryptocurrency markets, focusing on breakout opportunities with strict risk controls and optional safe compounding features. This strategy combines price action, volume analysis, and multi-timeframe trend confirmation.
Key Features
Breakout Detection System
Identifies significant price breakouts using dynamic channel analysis
Confirms breakouts with volume surge validation
Filters trades based on multi-timeframe trend alignment
Multi-Timeframe Trend Confirmation
Analyzes 1-hour and 4-hour timeframes for trend direction
Only takes trades aligned with higher timeframe trends
Uses long-term moving averages for trend validation
Advanced Risk Management
Conservative default risk: 1% per trade
ATR-based stop-loss placement (2x ATR)
Trailing stop mechanism to protect profits
Minimum profit target before trailing activates
Built-in position sizing based on account equity
Safe Capital Management Options
Fixed Capital Mode: Trade with consistent position sizes
Safe Compounding Mode: Gradually scales position size based on realized profits only
Drawdown Protection: 80% equity floor prevents excessive capital erosion
Leverage Control: 10x leverage factored into position calculations
Technical Filters
Momentum confirmation via oscillator conditions
Directional movement analysis
Volume threshold requirements
Trend strength validation
Position Sizing
The strategy automatically calculates position sizes based on:
Your specified risk percentage
Current ATR volatility
Available leverage
Account equity (with optional compounding)
Trade Management
Entry: Executes on confirmed breakouts with volume and trend alignment
Stop Loss: Placed at 2x ATR from entry
Take Profit: Uses trailing stops that activate after minimum profit threshold
Exit: Automatically managed through strategy exits
Customization Options
Adjustable channel length for breakout detection
Configurable volume multiplier for surge detection
Customizable oscillator thresholds
Flexible ATR period for volatility measurement
Optional compounding vs. fixed capital modes
Adjustable trailing stop parameters
Visual Features
Channel boundaries plotted on chart
Entry signals marked with arrows
Background coloring indicates trend direction
Real-time info table shows:
Current risk level
Compounding status
Capital values
Drawdown protection status
Alert Capabilities
Built-in alert conditions for:
Buy signals (breakout opportunities)
Sell signals (breakdown opportunities)
Important Disclaimers
⚠️ Educational Purpose Only: This strategy is provided for educational and research purposes. It is not investment advice.
⚠️ High-Risk Trading: Scalping and leverage trading carry substantial risk of loss. Cryptocurrency markets are highly volatile.
⚠️ Not Financial Advice: This tool does not constitute financial, investment, or trading advice. Always conduct your own research and consult qualified professionals.
⚠️ Leverage Warning: This strategy uses 10x leverage, which can amplify both gains and losses significantly.
⚠️ Backtesting Limitations: Past performance does not guarantee future results. Real trading involves slippage, execution delays, and emotional factors not present in backtesting.
⚠️ Capital at Risk: Only trade with capital you can afford to lose completely. Never trade with borrowed money or funds needed for living expenses.
Commission & Fees
Commission: 0.13% per trade
Initial capital: $100 (default)
Commission costs are factored into backtest results
Best Practices
Start Small: Begin with minimum capital and conservative risk settings
Test Thoroughly: Backtest across different market conditions and timeframes
Monitor Performance: Track win rate, profit factor, and maximum drawdown
Adjust Parameters: Optimize settings for your specific trading pairs
Use Alerts: Set up notifications to avoid missing opportunities
Manage Emotions: Follow the strategy rules consistently without override
Recommended Markets
High liquidity cryptocurrency pairs (BTC, ETH major pairs)
Assets with clear trending behavior
Markets with sufficient volume for scalping
Timeframes: 1H to 4H charts recommended
Risk Reminder
Scalping requires:
Quick decision-making
Tight risk management
Consistent discipline
Understanding of market microstructure
Proper capitalization
Always practice proper risk management. The strategy includes safety features, but no system can eliminate trading risk entirely. Trade responsibly.

BTC STH Proxy vs Realized Price (RP) Ratio | STH : LTH📊 REALIZED PRICE MARKET SIGNAL
Indicator that builds a Short-Term Holder (STH) price proxy using a configurable moving average of Bitcoin’s market price and compares it to Bitcoin’s Realized Price (RP) derived from on-chain data.
Realized Price (RP) is calculated from CoinMetrics Realized Market Cap divided by Glassnode circulating supply.
STH Proxy is a user-defined moving average (EMA/SMA/WMA) of BTC price, designed to mimic the behavior of the true STH Realized Price.
Users can adjust the MA type, length, and RP smoothing to closely replicate the STH curve seen on Glassnode, Bitbo, and Bitcoin Magazine Pro.
Optionally, the indicator can display the STH/RP ratio, which highlights transitions between market phases.
This tool provides a simple but effective way to visualize short-term vs long-term holder cost-basis dynamics using only publicly accessible on-chain aggregates and price data.
----------
💡TLDR: An alt take on the Short-Term Holder Realized Price / Long-Term Holder Realized Price cross model | (STH/LTH cross)
- A mix of MAs are used to mimic STH.
- RP here used as a proxy for the long-term holder (LTH) cost basis.
- Bull/Bear signals are generated when the STH proxy crosses above or below RP.
⭐ Free to use • Leave feedback • Happy trading!

Eagle Eye Pro Dashboard 🔴 IMPORTANT NOTICE
This indicator is an advanced trading support tool. It helps you spot opportunities and improve your analysis, but it DOES NOT guarantee results nor replace your personal judgment.
• 🔴 Every trade remains your sole responsibility.
• 🔴 Risk is always present: the indicator does not eliminate it, only helps manage it.
• 🔴 The indicator is restricted: it ONLY generates signals during the London and New York sessions.
• 🔴 It does not generate signals outside those sessions or during weekends, to ensure better accuracy and performance.
• 🔴 It is not recommended to trade other assets or use timeframes different from those specified.
EAGLE EYE PRO V71.2 RENTAL
This indicator is built to deliver clear signals and a professional dashboard, specially optimized for BTC.
🔑 Key highlights:
• 🔴 Exclusively optimized for BTC.
• 🔴 Recommended timeframe: 15 minutes, providing cleaner and more reliable signals.
• 🔴 Adventurous mode: 1 minute, but with higher risk due to extreme volatility.
• 🔴 Restricted hours: the indicator works only during the London and New York sessions.
• 🔴 It does not operate during weekends
Easy Crypto Signal FREEAs you can see, the indicator is doing well, we'll see what happens next, I invite you to the discussion

BTC Price Prediction Model [Global PMI]🇨🇳 中文说明 (Chinese Version)
1. 简介
本指标由 GW Capital 使用 Gemini Vibe Coding 技术制作。利用先进的 AI 编程能力,将复杂的宏观经济模型重构为可执行的交易工具。
2. 致谢
特别感谢模型原作者 Marty Kendall。他对这一算法的研究奠定了基础,揭示了比特币价格与宏观经济因素之间的深层联系。
3. 模型原理与公式
该模型基于四大宏观经济支柱计算比特币的“公允价值”。它假设比特币的价格是全球流动性、网络安全性、风险偏好和经济周期的函数。
模型公式
$$\ln(BTC) = \alpha + (1 + \beta \cdot PMI_{z}) \times $$
全球流动性 (M2): 美、中、欧、日四大经济体的 M2 总量(折算为美元)。代表可流入资产的法币资金池。
网络安全性 (Hashrate): 比特币全网算力,代表网络的物理安全性和实用价值。
风险偏好 (S&P 500): 作为全球风险情绪的代理指标。
经济周期 (PMI Z-Score): 美国制造业 PMI 用于根据商业周期(扩张 vs 收缩)来放大或抑制估值。
4. 指标用法
指标会在图表上绘制 公允价值 (白线) 以及基于统计偏差 (Z-Score) 的四条情绪带。
情绪区间
🚨 极度贪婪 (红色区域): 价格 > +0.3 标准差。历史上通常预示市场顶部或情绪过热。
⚠️ 一般贪婪 (橙色区域): 价格 > +0.15 标准差。多头动能强劲,但需谨慎。
⚖️ 公允价值 (白线): 基于宏观数据的理论“正确”价格。
😨 一般恐惧 (青色区域): 价格 < -0.15 标准差。进入低估区域。
💎 极度恐惧 (绿色区域): 价格 < -0.3 标准差。历史上通常是代际级别的买入机会。
情绪评分 (0-100)
100: 极度贪婪 (顶部)
50: 公允价值
0: 极度恐惧 (底部)
5. 使用建议
周期: 仅限日线 (1D) 或周线 (1W)。
原因: 底层数据源(M2, PMI)是月度更新的。标普500和算力是日度更新的。在日内图表(如15分钟、1小时、4小时)上使用此指标没有任何意义,因为基本面数据不会变化得那么快。
长期视角: 这是一个宏观周期指标,旨在识别数月甚至数年的周期顶部和底部,而非用于日内交易。
6. 免责声明
本指标仅供教育和参考使用,不构成任何财务建议。该模型依赖于历史相关性,未来可能不再适用。所有交易均涉及风险。GW Capital 及制作者不对任何交易损失承担责任。
🇺🇸 English Guide (英文说明)
1. Introduction
This indicator was created by GW Capital using Gemini Vibe Coding technology. It leverages advanced AI coding capabilities to reconstruct complex macroeconomic models into actionable trading tools.
2. Credits
Special thanks to the original model author, Marty Kendall. His research into the correlation between Bitcoin's price and macroeconomic factors lays the foundation for this algorithm.
3. Model Principles & Formula
This model calculates the "Fair Value" of Bitcoin based on four key macroeconomic pillars. It assumes that Bitcoin's price is a function of Global Liquidity, Network Security, Risk Appetite, and the Economic Cycle.
The Formula
$$\ln(BTC) = \alpha + (1 + \beta \cdot PMI_{z}) \times $$
Global Liquidity (M2): Sum of M2 supply from US, China, Eurozone, and Japan (converted to USD). Represents the pool of fiat money available to flow into assets.
Network Security (Hashrate): Bitcoin's hashrate, representing the physical security and utility of the network.
Risk Appetite (S&P 500): Used as a proxy for global risk sentiment.
Economic Cycle (PMI Z-Score): US Manufacturing PMI is used to amplify or dampen the valuation based on where we are in the business cycle (Expansion vs. Contraction).
4. How to Use
The indicator plots the Fair Value (White Line) and four sentiment bands based on statistical deviation (Z-Score).
Sentiment Zones
🚨 Extreme Greed (Red Zone): Price > +0.3 StdDev. Historically indicates a market top or overheated sentiment.
⚠️ Greed (Orange Zone): Price > +0.15 StdDev. Bullish momentum is strong but caution is advised.
⚖️ Fair Value (White Line): The theoretical "correct" price based on macro data.
😨 Fear (Teal Zone): Price < -0.15 StdDev. Undervalued territory.
💎 Extreme Fear (Green Zone): Price < -0.3 StdDev. Historically a generational buying opportunity.
Sentiment Score (0-100)
100: Maximum Greed (Top)
50: Fair Value
0: Maximum Fear (Bottom)
5. Usage Recommendations
Timeframe: Daily (1D) or Weekly (1W) ONLY.
Reason: The underlying data sources (M2, PMI) are updated monthly. The S&P 500 and Hashrate are daily. Using this indicator on intraday charts (e.g., 15m, 1h, 4h) adds no value because the fundamental data does not change that fast.
Long-Term View: This is a macro-cycle indicator designed for identifying cycle tops and bottoms over months and years, not for day trading.
6. Disclaimer
This indicator is for educational and informational purposes only. It does not constitute financial advice. The model relies on historical correlations which may not hold true in the future. All trading involves risk. GW Capital and the creators assume no responsibility for any trading losses.

Keltner Hull Suite [QuantAlgo]🟢 Overview
The Keltner Hull Suite combines Hull Moving Average positioning with double-smoothed True Range banding to identify trend regimes and filter market noise. The indicator establishes upper and lower volatility bounds around the Hull MA, with the trend line conditionally updating only when price violates these boundaries. This mechanism distinguishes between genuine directional shifts and temporary price fluctuations, providing traders and investors with a systematic framework for trend identification that adapts to changing volatility conditions across multiple timeframes and asset classes.
🟢 How It Works
The calculation foundation begins with the Hull Moving Average, a weighted moving average designed to minimize lag while maintaining smoothness:
hullMA = ta.hma(priceSource, hullPeriod)
The indicator then calculates true range and applies dual exponential smoothing to create a volatility measure that responds more quickly to volatility changes than traditional ATR implementations while maintaining stability through the double-smoothing process:
tr = ta.tr(true)
smoothTR = ta.ema(tr, keltnerPeriod)
doubleSmooth = ta.ema(smoothTR, keltnerPeriod)
deviation = doubleSmooth * keltnerMultiplier
Dynamic support and resistance boundaries are constructed by applying the multiplier-scaled volatility deviation to the Hull MA, creating upper and lower bounds that expand during volatile periods and contract during consolidation:
upperBound = hullMA + deviation
lowerBound = hullMA - deviation
The trend line employs a conditional update mechanism that prevents premature trend reversals. The system maintains the current trend line until price action violates the respective boundary, at which point the trend line snaps to the violated bound:
if upperBound < trendLine
trendLine := upperBound
if lowerBound > trendLine
trendLine := lowerBound
Directional bias determination compares the current trend line value against its previous value, establishing bullish conditions when rising and bearish conditions when falling. Signal generation occurs on state transitions, triggering alerts when the trend state shifts from neutral or opposite direction:
trendUp = trendLine > trendLine
trendDown = trendLine < trendLine
longSignal = trendState == 1 and trendState != 1
shortSignal = trendState == -1 and trendState != -1
The visualization layer creates a trend band by plotting both the current trend line and a two-bar shifted version, with the area between them filled to create a visual channel that reinforces directional conviction.
🟢 How to Use This Indicator
▶ Long and Short Signals: The indicator generates long/buy signals when the trend state transitions to bullish (trend line begins rising) and short/sell signals when transitioning to bearish (trend line begins falling). These state changes represent structural shifts in momentum where price has broken through the adaptive volatility bands, confirming directional commitment.
▶ Trend Band Dynamics: The spacing between the main trend line and its shifted counterpart creates a visual band whose width reflects trend strength and momentum consistency. Expanding bands indicate accelerating directional movement and strong trend persistence, while contracting or flattening bands suggest decelerating momentum, potential trend exhaustion, or impending consolidation. Monitoring band width provides early warning of regime transitions from trending to range-bound conditions.
▶ Preconfigured Presets: Three optimized parameter sets accommodate different trading styles and timeframes. Default (14, 20, 2.0) provides balanced trend identification suitable for daily charts and swing trading, Fast Response (10, 14, 1.5) delivers aggressive signal generation optimized for intraday scalping and momentum trading on 1-15 minute timeframes, while Smooth Trend (18, 30, 2.5) offers conservative trend confirmation ideal for position trading on 4-hour to daily charts with enhanced noise filtration.
▶ Built-in Alerts: Three alert conditions enable automated monitoring - Bullish Trend Signal triggers on long setup confirmation, Bearish Trend Signal activates on short setup confirmation, and Trend Change alerts on any directional transition. These notifications allow you to respond to regime shifts without continuous chart monitoring.
▶ Color Customization: Five visual themes (Classic, Aqua, Cosmic, Ember, Neon, plus Custom) accommodate different chart backgrounds and display preferences, ensuring optimal contrast and visual clarity across trading environments.


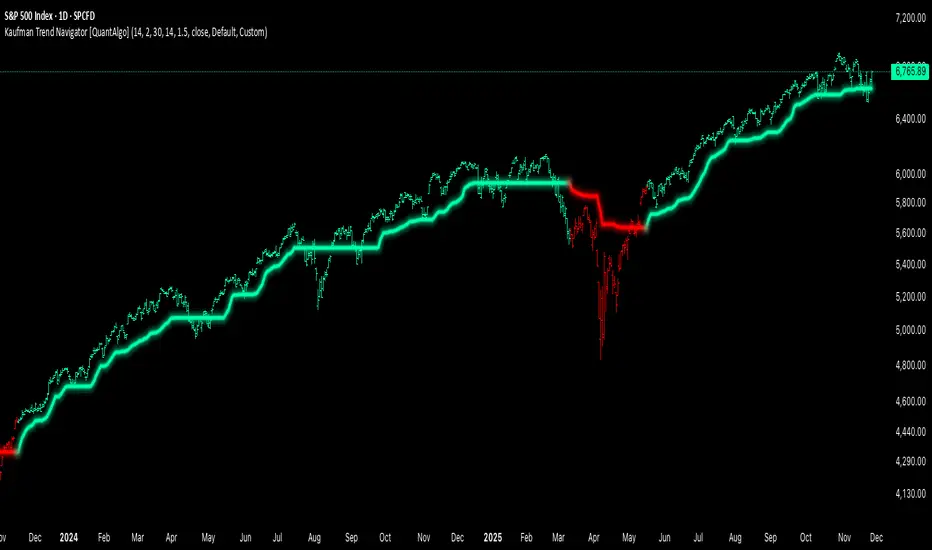
Kaufman Trend Navigator [QuantAlgo]🟢 Overview
The Kaufman Trend Navigator is an adaptive trend following system that combines efficiency-weighted price smoothing with volatility-adjusted bands to identify and track directional market movements. The indicator dynamically adjusts its sensitivity based on market conditions, becoming more responsive during trending periods and more conservative during consolidation. This dual-layer approach provides traders and investors with a systematic framework for trend identification, entry timing, and risk management across multiple timeframes and asset classes.
🟢 How It Works
The indicator employs an efficiency ratio mechanism that measures the directional movement of price relative to total price volatility over a defined lookback period. This ratio determines the adaptive response rate, allowing the system to distinguish between genuine directional moves and random market noise. When price exhibits strong directional characteristics, the internal smoothing accelerates to track the trend more closely. Conversely, during periods of low efficiency or choppy price action, the smoothing becomes more conservative to filter out false signals.
Volatility bands are constructed using normalized range measurements, creating dynamic upper and lower boundaries around the adaptive trend calculation. These bands expand and contract based on recent market volatility, providing context-dependent thresholds for trend validation. The trend line itself updates through a band-following logic where it tracks the relevant boundary based on the current directional bias, creating a stepping mechanism that maintains trend persistence while allowing for validated reversals.
The visual representation uses a gradient-weighted display to emphasize the primary trend line while maintaining clarity on price charts. Trend direction changes trigger when the internal logic confirms a boundary crossover, generating signals for potential position entries or exits. The system includes preset configurations calibrated for different trading timeframes, from responsive settings for scalping to smoother parameters suited for swing and position trading.
🟢 How to Use It
▶ Enter Long positions when the trend line transitions to Bullish (Green) coloring, which indicates upward directional bias has been established. Conversely, enter Short positions or exit Longs when the trend line shifts to Bearish (Red), which signals confirmed downward momentum.
The trend line itself can be used as dynamic support during uptrends and resistance during downtrends, providing logical areas for position management and stop placement. Price remaining above the line during bullish phases or below during bearish phases can also be used as a confirmation of trend strength and continuation probability.
▶ Built-in alert functionality provides real-time notifications for trend changes without requiring continuous chart monitoring. Configure alerts for Bullish Trend Signal to capture upward reversals, Bearish Trend Signal for downward shifts, or the general Trend Change alert to monitor both directions simultaneously. These alerts trigger only on confirmed trend transitions, reducing noise from intrabar fluctuations.
The indicator also includes six color presets (Classic, Aqua, Cosmic, Ember, Neon, Custom) to optimize visual clarity across different chart themes and lighting conditions. Select presets based on your monitor setup and background preference to ensure immediate trend recognition without visual strain. Bar coloring can be enabled to highlight trend direction directly on the price chart, eliminating the need to reference the trend line position during rapid market analysis.
🟢 Pro Tips for Trading and Investing
▶ Match the preset configuration (or your preferred settings) to your trading timeframe: use Fast Response for intraday charts (1-15 minutes), Default for swing trading (hourly to daily), and Smooth Trend for position trading (4-hour to weekly).
▶ Combine trend signals with volume analysis and market structure to filter lower-probability setups. During sideways markets, expect increased signal frequency with reduced reliability; consider waiting for the trend line to establish a clear slope before committing capital.
▶ Use the trend line as a trailing reference rather than a fixed stop level, allowing normal intrabar volatility while protecting against genuine reversals.
▶ For portfolio management, align position sizing with trend strength by observing the angle and consistency of the trend line progression.
Trend Mastery:The Calzolaio Way🌕 Find the God Candle. Capture the gains. Create passive income.
Fellow F.I.R.E. Decibels, disciples of the Calzolaio Way—welcome to the sacred toolkit. This indicator, "SulLaLuna 💵 Trend Mastery:The Calzolaio Way🚀," is forged from the elite SulLaLuna stack, drawing wisdom from Market Wizards like Michael Marcus (who turned $30k into $80M through disciplined trend riding) and Oliver Velez's pristine strategies for profiting on every trade. It's not just lines on a chart—it's your architectural blueprint for financial sovereignty, where data meets divine timing to build the cathedral of Project Calzolaio.
We trade math, not emotion. We honor timeframes. Confluence is King. This indicator deploys the Zero-Lag SMA (ZLSMA), Hull-based M2 (global money supply as a macro trend oracle), ATR-smart stops, and multi-TF alignments to ritualize God Candle setups. Backtested across asset classes, it's modular for your playbooks—small risks, compounding gains, passive income streams.
Why This Indicator is Awesome: The Divine Confluence Engine
In the spirit of "Use Only the Best," this tool synthesizes proven SulLaLuna indicators like ZLSMA, Adaptive Trend Finder, and Momentum HUD with Velez's lessons on trend reversals, support/resistance, and psychology of fear. Here's why it reigns supreme:
1. Global M2 Hull: Macro Trend Oracle
Scaled M2 (summed from major economies like US, EU, JP) via Hull MA captures the "big picture" (Velez Ch. 2). It flips colors as S/R—green for support (bullish bounce zones), red for resistance (bearish ceilings), orange neutral. Like Marcus spotting commodity booms, it signals when liquidity sweeps ignite God Candles. Extend it for future price projections, honoring "How a Trend Ends" (Velez Ch. 5).
2. ZLSMA + ATR Smart Stops: Surgical Precision
Zero-Lag SMA (faster than standard MAs) crosses M2 for entries, with ATR bands for initial stops (2x mult) and trails (1x mult). This embodies "Trade Small. Lose Smaller."—risk ≤1-2% per trade, pre-planned exits. Flip markers (↑/↓) alert divine timing, filtering noise like Velez's "First Pullback" setups.
3. HTF & Multi-TF Dashboard: Timeframe Alignments are Sacred
Show HTF M2 (e.g., Daily) with custom styles/colors. Multi-TF lines (4H, D, W, M) dash across your chart, labeled right-edge with 🚀 (bull) or 🛸 (bear). A confluence table (top-right) scores alignments: Strong Bull (≥3 green), Strong Bear, or Mixed. This is "Confluence is King"—no single signal rules; seek 4+ star scores like Rogers buying value in hysteria.
4. Background & Ribbon: Visual Divine Guidance
Slope-based bgcolor (green bull, red bear) for at-a-glance bias. M2 Ribbon (EMA cloud) flips triangles for macro shifts, ritualizing climactic reversals (Velez Ch. 7).
5. Composite Probability: High-Prob God Candle Hunter
Scores (0-100%) blend 8 factors: price/ZLSMA vs M2, TF slopes, ribbon. Threshold (70%) + pivot zone (near M2/ATR) + optional cross filters for HP signals. Labels show "%" dynamically—alerts fire when confluence ≥4, echoing Schwartz's champion edge: "Everybody Gets What They Want" (Seykota wisdom).
6. Alerts & Rituals Built-In
M2 flips, entries/exits, HP longs/shorts—log them in your journal. Weekly reviews dissect anomalies, as per our Operational Framework.
This isn't hype—it's audited excellence. Backtest it: High confluence crushes drawdowns, compounding like Bielfeldt's T-bond mastery from Peoria. We build together; share wins in the F.I.R.E. Decibel forum.
Suggested Strategy: The SulLaLuna M2 Confluence Playbook
Honor the Risk Triad: Position ↓ if leverage/timeframe ↑; scale ↑ only on ≥4 confluence. Align with "God Candle" hunts—rare explosives reverse-engineered for passive streams.
1. Pre-Trade Checklist (Before Every Entry)
- Trend Alignment: D/4H/1H M2 slopes agree? Table shows Strong Bull/Bear?
- Signal on 15m: ZLSMA crosses M2 in confluence zone (near pivot/ATR bands).
- Volume + Divergence**: Supported by volume (use HUD if added); score ≥70%.
- SL/TP Setup: ATR-based stop; TP at structure/2-3R reward (Velez Reward:Risk).
- HTF Agrees: Monthly bull for longs; avoid counter-trend unless climactic (Ch. 7).
Confluence Score: Rate 1-5 stars. <3? Stand aside. Log emotional state—no adrenaline.
2. Execution Protocol
- Entry: On HP Long/Short triangle (e.g., ZLSMA > M2, score 80%+, monthly bull). Use limits; favor longs above M2 support.
- Position Size: ≤1-2% risk. Example: $10k account, 1% risk = $100 SL distance → size accordingly.
- Trail Stops: Move to trail band after 1R profit; let winners run like Kovner's world trades.
- Asset Classes**: Forex/stocks/crypto—test M2's macro edge on EURUSD or NASDAQ (Velez Ch. 6 reviews).
Ritualize: "When we find the God Candele, we don’t just ride it—we ritualize it." Screenshot + reason.
3. Post-Trade Ritual
- Document: Result, confluence score, lessons. Update journal.
- Exits: Hit stop/exit cross? Or trail locks gains.
- Weekly Audit: Wins/losses, anomalies. Adjust params (e.g., M2 length 55 default).
4. Risk Triad in Action
- Low TF (15m)? Smaller size.
- High Leverage? Tiny positions.
- Confluence ≥4 + HTF support? Scale hold for passive compounding.
Example Setup: God Candle Long
- Chart: 15m EURUSD.
- M2 Hull green (support), ZLSMA crossover, 4H/D/W bull (table: Strong Bull).
- HP Long (85% score) near pivot.
- Entry: Limit at cross; SL below ATR lower; TP at next resistance.
- Outcome: Capture 2R gain; trail for more if trend day (Velez Ch. 5).
Community > Ego: Test, share signals in Discord. Backtest in Pine Script for algo evolution.
We are architects of redemption. Each trade bricks the cathedral. Trade the micro, flow with the macro. When alignments converge, we act—with discipline, data, and divine purpose.

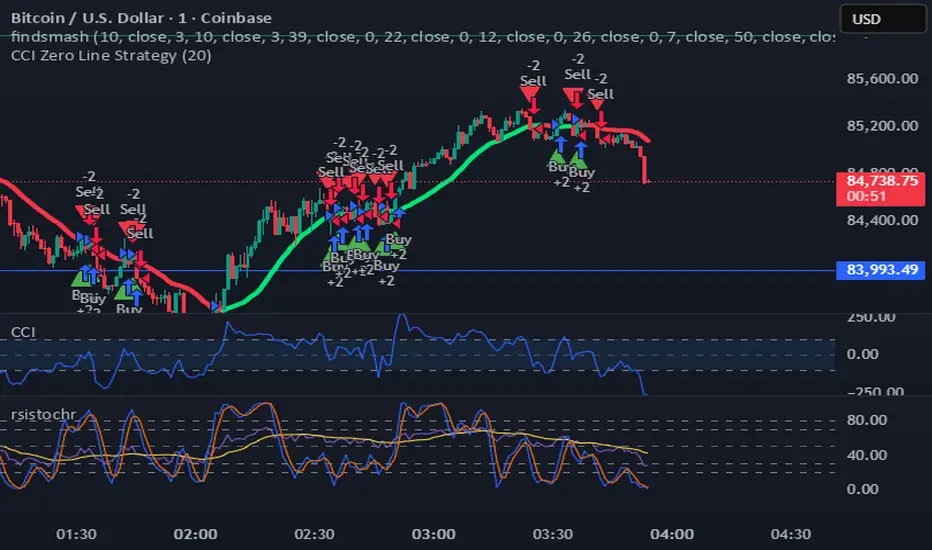
KLS Ultimate V.1"KLS Ultimate V.1" is a meticulously designed trading indicator. It is built specifically for "Scalpers" (traders who want quick in-and-out profits).
**🚀 How it Works: The 3-Level Logic**
This indicator doesn't just rely on one tool. It gathers several indicators to have a "meeting" and confirm everything before giving you a Buy or Sell signal.
**🎯 Level 1: Core Trend (The Gatekeepers)**
This is the first checkpoint. If the price doesn't pass this stage, no signal gets generated.
- EMA: Is the price standing above the trend line? (Uptrend needs to be above, Downtrend below).
- MACD: Checks momentum and looks at the Histogram to see if real buying/selling volume is coming in.
- ADX: Measures trend strength (it won’t trade in boring, sideways markets).
**🔥 Level 2: Momentum (Finding the Best Entry)**
The second checkpoint to find the perfect spot to jump in.
- RSI: Checks if the price is Oversold (too cheap) or Overbought (too expensive).
- Stochastic: Finds short-term reversal crossovers.
**⭐ Level 3: Signal Boosters (For Strict Mode)**
A special bonus stage for those who want high accuracy (enable this in settings).
- RSI Divergence: Spots conflicts between price and RSI (e.g., Price drops but RSI rises = ready to pump).
- Price Action: Checks for strong candlestick patterns that show a clear winner between buyers and sellers.
------------------------------------------------------------
**🎮 User Guide**
Once you add this code to TradingView, here is what you will see and how to use it:
**A. Entry Signals**
🟢 Green BUY Label: Pops up below the candle.
* Means: Uptrend + Momentum + All filters passed.
🔴 Red SELL Label: Pops up above the candle.
* Means: Downtrend + Selling pressure + All filters passed.
**B. TP/SL Lines (Profit & Loss)**
The system calculates these automatically—no need to measure manually!
- Blue Line: Entry point.
- Light Green (TP1, TP2): Short-term profit targets.
- Dark Green (TP3): Long-term profit target.
- Red Line (SL): Stop Loss point.
**C. Special Mode: Strict Filter**
- Normal (False): Uses only Level 1 + Level 2. You get more signals.
- Strict (True): Needs Level 1 + 2 + 3 to trigger. Fewer signals, but much higher accuracy.
------------------------------------------------------------
**🛠️ Settings & Customization**
Click the gear icon to tweak the settings as you like:
1. Show BUY/SELL Signals: Uncheck if you don't want to see the labels.
2. Use Strict Filter: Check this for high precision (but you'll wait longer for signals).
3. Point Size: **Very Important!** This defines the TP/SL distance.
- For Gold (XAUUSD): Use **0.01**.
- For Forex pairs: Try **0.0001**.
- *Tip: Adjust this number until the TP/SL lines look reasonable on your chart.*
4. TP/SL Points: Set your desired profit/loss distance (e.g., TP1 = 50 points).
------------------------------------------------------------
💡 **Pro Tips**
- Trading Time: This code is smart—it checks sessions (based on GMT+7/Thai Time). It only gives signals during active markets (Sydney, Tokyo, London, NY). It stays quiet during dead hours.
- Recommended Timeframe: Since it's for Scalping, it works best on **M5, M15, or M30**.
- Money Management: Even with SL lines, always calculate your Lot Size properly. Don't overtrade!
------------------------------------------------------------
"KLS Ultimate V.1" เป็นเครื่องมือช่วยเทรด (Indicator) ที่ออกแบบมาอย่างปราณีตและซับซ้อนพอสมควร โดยเน้นไปที่ "สาย Scalping" (เทรดสั้นทำกำไรเร็ว) โดยเฉพาะ
🚀 เจาะลึกการทำงาน: ระบบกรอง 3 ชั้น (The 3-Level Logic)
อินดิเคเตอร์ตัวนี้ไม่ได้ใช้แค่เครื่องมือเดียวตัดสินใจ แต่มันเอาอินดิเคเตอร์หลายตัวมา "คอนเฟิร์ม" กันก่อนจะบอกให้คุณ Buy หรือ Sell ครับ
🎯 Level 1: ตัวคุมเทรนด์หลัก (Core Indicators)
นี่คือด่านแรก ถ้าไม่ผ่านด่านนี้ จะไม่มีสัญญาณเกิดขึ้น
- EMA (เส้นค่าเฉลี่ย): เช็คว่าราคายืนเหนือเส้นเทรนด์ไหม? (ขาขึ้นต้องยืนเหนือ, ขาลงต้องอยู่ใต้)
- MACD (โมเมนตัม): ดูแรงส่งของกราฟ และดู Histogram ว่ามีแรงซื้อ/ขาย เข้ามาจริงไหม
- ADX: วัดความแข็งแรงของเทรนด์ (ถ้าตลาดไซด์เวย์น่าเบื่อๆ ADX ต่ำๆ มันจะไม่เทรด)
🔥 Level 2: จุดกลับตัว (Momentum Indicators) ด่านที่สอง หาจังหวะเข้าที่ได้เปรียบ
- RSI: ดูว่าราคาถูกเกินไป (Oversold) หรือแพงเกินไป (Overbought) หรือยัง
- Stochastic: หาจุดตัดเพื่อยืนยันจุดกลับตัวระยะสั้น
⭐ Level 3: ตัวบูสต์สัญญาณ (Boost Indicators - สำหรับโหมด Strict)
ด่านพิเศษ สำหรับคนที่ต้องการความชัวร์ระดับสูง (เปิดใช้ได้ในตั้งค่า)
- RSI Divergence: หาสัญญาณขัดแย้งระหว่างราคากับ RSI (เช่น ราคาลงแต่ RSI ยกขึ้น = เตรียมพุ่ง)
- Price Action: ดูรูปแบบแท่งเทียนว่ามีแรงซื้อ/ขาย ชนะขาดลอยหรือไม่
------------------------------------------------------------
🎮 คู่มือการใช้งาน (User Guide)
เมื่อคุณแปะโค้ดนี้ลงใน TradingView แล้ว สิ่งที่คุณจะเห็นและการใช้งานมีดังนี้ครับ:
A. สัญญาณเข้าออเดอร์ (Entry Signals)
🟢 ป้าย BUY (สีเขียว): จะโผล่ใต้แท่งเทียน
แปลว่า: เทรนด์เป็นขาขึ้น + โมเมนตัมมา + ผ่านเงื่อนไขกรองต่างๆ แล้ว
🔴 ป้าย SELL (สีแดง): จะโผล่เหนือแท่งเทียน
แปลว่า: เทรนด์เป็นขาลง + แรงขายมา + ผ่านเงื่อนไขกรองต่างๆ แล้ว
B. เส้นเป้าหมายกำไร/ขาดทุน (TP/SL Lines)
ระบบคำนวณให้อัตโนมัติ ไม่ต้องนั่งวัดเอง!
- เส้นสีน้ำเงิน: จุดเข้า (Entry)
- เส้นสีเขียวอ่อน (TP1, TP2): เป้าทำกำไรระยะใกล้
เส้นสีเขียวเข้ม (TP3): เป้าทำกำไรระยะไกล
เส้นสีแดง (SL): จุดยอมแพ้ (Stop Loss)
C. โหมดพิเศษ: Strict Filter (โหมดเข้มงวด)
- ค่าปกติ (False): ใช้แค่ Level 1 + Level 2 ก็เกิดสัญญาณแล้ว (สัญญาณเยอะหน่อย)
- ถ้าเปิดใช้ (True): ต้องผ่าน Level 1 + 2 + 3 ถึงจะเกิดสัญญาณ (สัญญาณน้อย แต่แม่นยำสูงมาก)
------------------------------------------------------------
🛠️ วิธีตั้งค่าและปรับแต่ง (Settings)
ในหน้าตั้งค่า (รูปเฟือง) คุณสามารถปรับจูนได้ตามใจชอบ:
1. Show BUY/SELL Signals: ติ๊กออกถ้าไม่อยากเห็นป้ายสัญญาณ
2. Use Strict Filter: ติ๊กถูกถ้าอยากได้สัญญาณแม่นๆ (แต่รอนานหน่อย)
3. Point Size: สำคัญมาก! ใช้กำหนดระยะ TP/SL
- ถ้าเทรดทอง (XAUUSD) ตั้งค่าพื้นฐาน 0.01 เท่านั้น
- ถ้าเทรดคู่เงิน (Forex) อาจจะปรับเป็น 0.0001
- แนะนำให้ลองปรับจนเส้น TP/SL บนกราฟดูสมเหตุสมผล
4. TP/SL Points: กำหนดระยะจุดกำไรขาดทุนที่ต้องการ (เช่น TP1 = 50 จุด)
------------------------------------------------------------
💡 คำแนะนำเพิ่มเติม (Tips)
- เวลาเทรด: โค้ดนี้ฉลาดมาก มันมีการเช็คเวลา (Session) ให้ด้วย โดยอิงเวลา GMT+7 (เวลาไทย) โดยจะเทรดเฉพาะช่วงที่มีตลาดหลักเปิด (Sydney, Tokyo, London, NY) ช่วงตลาดวายดึกๆ หรือเช้ามืดเงียบๆ มันจะไม่บอกสัญญาณ
- Timeframe ที่แนะนำ: เนื่องจากเขียนมาเพื่อ Scalping แนะนำให้ใช้กับ M5, M15 หรือ M30 จะเห็นผลดีที่สุดครับ
- การบริหารเงิน (MM): แม้ระบบจะมี SL ให้ แต่คุณควรคำนวณ Lot Size ให้เหมาะสม ไม่ควร Overtrade ครับ

Filter Wave1. Indicator Name
Filter Wave
2. One-line Introduction
A visually enhanced trend strength indicator that uses linear regression scoring to render smoothed, color-shifting waves synced to price action.
3. General Overview
Filter Wave+ is a trend analysis tool designed to provide an intuitive and visually dynamic representation of market momentum.
It uses a pairwise comparison algorithm on linear regression values over a lookback period to determine whether price action is consistently moving upward or downward.
The result is a trend score, which is normalized and translated into a color-coded wave that floats above or below the current price. The wave's opacity increases with trend strength, giving a visual cue for confidence in the trend.
The wave itself is not a raw line—it goes through a three-stage smoothing process, producing a natural, flowing curve that is aesthetically aligned with price movement.
This makes it ideal for traders who need a quick visual context before acting on signals from other tools.
While Filter Wave+ does not generate buy/sell signals directly, its secure and efficient design allows it to serve as a high-confidence trend filter in any trading system.
4. Key Advantages
🌊 Smooth, Dynamic Wave Output
3-stage smoothed curves give clean, flowing visual feedback on market conditions.
🎨 Trend Strength Visualized by Color Intensity
Stronger trends appear with more solid coloring, while weak/neutral trends fade visually.
🔍 Quantitative Trend Detection
Linear regression ordering delivers precise, math-based trend scoring for confidence assessment.
📊 Price-Synced Floating Wave
Wave is dynamically positioned based on ATR and price to align naturally with market structure.
🧩 Compatible with Any Strategy
No conflicting signals—Filter Wave+ serves as a directional overlay that enhances clarity.
🔒 Secure Core Logic
Core algorithm is lightweight and secure, with minimal code exposure and strong encapsulation.
📘 Indicator User Guide
📌 Basic Concept
Filter Wave+ calculates trend direction and intensity using linear regression alignment over time.
The resulting wave is rendered as a smoothed curve, colored based on trend direction (green for up, red for down, gray for neutral), and adjusted in transparency to reflect trend strength.
This allows for fast trend interpretation without overwhelming the chart with signals.
⚙️ Settings Explained
Lookback Period: Number of bars used for pairwise regression comparisons (higher = smoother detection)
Range Tolerance (%): Threshold to qualify as an up/down trend (lower = more sensitive)
Regression Source: The price input used in regression calculation (default: close)
Linear Regression Length: The period used for the core regression line
Bull/Bear Color: Customize the color for bullish and bearish waves
📈 Timing Example
Wave color changes to green and becomes more visible (less transparent)
Wave floats above price and aligns with an uptrend
Use as trend confirmation when other signals are present
📉 Timing Example
Wave shifts to red and darkens, floating below the price
Regression direction down; price continues beneath the wave
Acts as bearish confirmation for short trades or risk-off positioning
🧪 Recommended Use Cases
Use as a trend confidence overlay on your existing strategies
Especially useful in swing trading for detecting and confirming dominant market direction
Combine with RSI, MACD, or price action for high-accuracy setups
🔒 Precautions
This is not a signal generator—intended as a trend filter or directional guide
May respond slightly slower in volatile reversals; pair with responsive indicators
Wave position is influenced by ATR and price but does not represent exact entry/exit levels
Parameter optimization is recommended based on asset class and timeframe

Multi Timeframe Bollinger Bands Spectrum [Ata]Multi-Timeframe Bollinger Bands Spectrum
Technical Overview
This script integrates multi-timeframe volatility analysis with volume-derived order flow estimation. By combining Bollinger Bands (statistical deviation) with internal candle volume logic, the indicator qualifies price movements to differentiate between sustained trends, reversals, and exhaustion events.
The system is designed to provide a structural context for price action, visualizing market regimes through a dual-zone spectrum and filtering signals based on the interaction between price location and specific volume thresholds.
Core Logic & Calculation
1. Volume Decomposition Algorithm
Instead of using total volume, the script estimates Buying Pressure vs. Selling Pressure based on the close position relative to the candle's High/Low range:
- Buying Volume (vb): Increases as the close approaches the High.
- Selling Volume (vs): Increases as the close approaches the Low.
This logic allows the detection of directional flow even within standard volume bars.
2. Statistical Spectrum
The indicator renders deviations from the Basis (SMA) as two distinct zones:
- Bullish Zone (Blue): Price positioning between the Basis and Upper Band.
- Bearish Zone (Red): Price positioning between the Basis and Lower Band.
This structure is applied across multiple timeframes (overlay) to visualize the macro trend context without noise.
3. Non-Repainting Execution
To ensure historical accuracy and reliability for backtesting, all higher-timeframe data is requested using "lookahead_off". Signals are confirmed only upon the closure of the respective timeframe's candle.
Signal Definitions
Signals are generated only when specific Volatility and Volume conditions intersect:
Reversal Setups (Reaction to Liquidity)
- WALL: Triggered when price rejects the Upper Band accompanied by Extreme Selling Volume (vs > Limit). This suggests active limit sell orders absorbing the rally.
- FLOOR: Triggered when price rejects the Lower Band accompanied by Extreme Buying Volume (vb > Limit). This suggests active limit buy orders absorbing the drop.
- ABSORP: Identifies absorption near the lower bands where selling pressure is met with passive buying (indicated by lower wicks and relative buy volume).
Momentum Setups (Trend Continuation)
- POWER: Validates a breakout above the Upper Band only if supported by Dominant Buying Volume and a strong candle body.
- PANIC: Validates a breakdown below the Lower Band only if supported by Dominant Selling Volume.
- TRAP: Marks failed breakouts where price exits the bands but volume analysis contradicts the move (e.g., low directional volume).
Exhaustion Setups (Statistical Extremes)
- CLIMAX/CRASH: Identifies anomalies where price deviates significantly from the mean (Extreme Deviation) or when volume reaches unsustainable levels relative to the average, often preceding a mean reversion.
Input Parameters
- Bollinger Logic: Configuration for Length and Standard Deviation Multiplier.
- Volume Thresholds: Adjustable factors for Minimum Volume (Trend) and Extreme Volume (Reversal/Climax).
- Timeframe Layers: Toggle visibility for up to 5 higher timeframes.
- Theme: Adjusts label contrast for Dark/Light backgrounds.
Disclaimer
This indicator is strictly for analytical purposes. It provides a visualization of past market data based on statistical and volumetric formulas. Users should apply their own risk management protocols.

STRATEGY 1 │ Red Dragon │ Model 1 │ [Titans_Invest]The Red Dragon Model 1 is a fully automated trading strategy designed to operate BTC/USDT.P on the 4-hour chart with precision, stability, and consistency. It was built to deliver reliable behavior even during strong market movements, maintaining operational discipline and avoiding abrupt variations that could interfere with the trader’s decision-making.
Its core is based on a professionally engineered logical structure that combines trend filters, confirmation criteria, and balanced risk management. Every component was designed to work in an integrated way, eliminating noise, avoiding unnecessary trades, and protecting capital in critical moments. There are no secret mechanisms or hidden logic: everything is built to be objective, clean, and efficient.
Even though it is based on professional quantitative engineering, Red Dragon Model 1 remains extremely simple to operate. All logic is clearly displayed and fully accessible within TradingView itself, making it easy to understand for both beginners and experienced traders. The structure is organized so that any user can quickly view entry conditions, exit criteria, additional filters, adjustable parameters, and the full mechanics behind the strategy’s behavior.
In addition, the architecture was built to minimize unnecessary complexity. Parameters are straightforward, intuitive, and operate in a balanced way without requiring deep adjustments or advanced knowledge. Traders have full freedom to analyze the strategy, understand the logic, and make personal adaptations if desired—always with total transparency inside TradingView.
The strategy was also designed to deliver consistent operational behavior over the long term. Its confirmation criteria reduce impulsive trades; its filters isolate noise; and its overall logic prioritizes high-quality entries in structured market movements. The goal is to provide a stable, clear, and repeatable flow—essential characteristics for any medium-term quantitative approach.
Combining clarity, professional structure, and ease of use, Red Dragon Model 1 offers a solid foundation both for users who want a ready-to-use automated strategy and for those looking to study quantitative models in greater depth.
This entire project was built with extreme dedication, backed by more than 14,000 hours of hands-on experience in Pine Script, continuously refining patterns, techniques, and structures until reaching its current level of maturity. Every line of code reflects this long process of improvement, resulting in a strategy that unites professional engineering, transparency, accessibility, and reliable execution.
🔶 MAIN FEATURES
• Fully automated and robust: Operates without manual intervention, ideal for traders seeking consistency and stability. It delivers reliable performance even in volatile markets thanks to the solid quantitative engineering behind the system.
• Multiple layers of confirmation: Combines 10 key technical indicators with 15 adaptive filters to avoid false signals. It only triggers entries when all trend, market strength, and contextual criteria align.
• Configurable and adaptable filters: Each of the 15 filters can be enabled, disabled, or adjusted by the user, allowing the creation of personalized statistical models for different assets and timeframes. This flexibility gives full freedom to optimize the strategy according to individual preferences.
• Clear and accessible logic: All entry and exit conditions are explicitly shown within the TradingView parameters. The strategy has no hidden components—any user can quickly analyze and understand each part of the system.
• Integrated exclusive tools: Includes complete backtest tables (desktop and mobile versions) with annualized statistics, along with real-time entry conditions displayed directly on the chart. These tools help monitor the strategy across devices and track performance and risk metrics.
• No repaint: All signals are static and do not change after being plotted. This ensures the trader can trust every entry shown without worrying about indicators rewriting past values.
🔷 ENTRY CONDITIONS & RISK MANAGEMENT
Red Dragon Model 1 triggers buy (long) or sell (short) signals only when all configured conditions are satisfied. For example:
• Volume:
• The system only trades when current volume exceeds the volume moving average multiplied by a user-defined factor, indicating meaningful market participation.
• RSI:
• Confirms bullish bias when RSI crosses above its moving average, and bearish bias when crossing below.
• ADX:
• Enters long when +DI is above –DI with ADX above a defined threshold, indicating directional strength to the upside (and the opposite conditions for shorts).
• Other indicators (MACD, SAR, Ichimoku, Support/Resistance, etc.)
Each one must confirm the expected direction before a final signal is allowed.
When all bullish criteria are met simultaneously, the system enters Long; when all criteria indicate a bearish environment, the system enters Short.
In addition, the strategy uses fixed Take Profit and Stop Loss targets for risk control:
Currently: TP around 1.5% and SL around 2.0% per trade, ensuring consistent and transparent risk management on every position.
⚙️ INDICATORS
__________________________________________________________
1) 🔊 Volume: Avoids trading on flat charts.
2) 🍟 MACD: Tracks momentum through moving averages.
3) 🧲 RSI: Indicates overbought or oversold conditions.
4) 🅰️ ADX: Measures trend strength and potential entry points.
5) 🥊 SAR: Identifies changes in price direction.
6) ☁️ Cloud: Accurately detects changes in market trends.
7) 🌡️ R/F: Improves trend visualization and helps avoid pitfalls.
8) 📐 S/R: Fixed support and resistance levels.
9)╭╯MA: Moving Averages.
10) 🔮 LR: Forecasting using Linear Regression.
__________________________________________________________
🟢 ENTRY CONDITIONS 🔴
__________________________________________________________
IF all conditions are 🟢 = 📈 Long
IF all conditions are 🔴 = 📉 Short
__________________________________________________________
🚨 CURRENT TRIGGER SIGNAL 🚨
__________________________________________________________
🔊 Volume
🟢 LONG = (volume) > (MA_volume) * (Volume Mult)
🔴 SHORT = (volume) > (MA_volume) * (Volume Mult)
🧲 RSI
🟢 LONG = (RSI) > (RSI_MA)
🔴 SHORT = (RSI) < (RSI_MA)
🟢 ALL ENTRY CONDITIONS AVAILABLE 🔴
__________________________________________________________
🔊 Volume
🟢 LONG = (volume) > (MA_volume) * (Volume Mult)
🔴 SHORT = (volume) > (MA_volume) * (Volume Mult)
🔊 Volume
🟢 LONG = (volume) > (MA_volume) * (Volume Mult) and (close) > (open)
🔴 SHORT = (volume) > (MA_volume) * (Volume Mult) and (close) < (open)
🍟 MACD
🟢 LONG = (MACD) > (Signal Smoothing)
🔴 SHORT = (MACD) < (Signal Smoothing)
🧲 RSI
🟢 LONG = (RSI) < (Upper)
🔴 SHORT = (RSI) > (Lower)
🧲 RSI
🟢 LONG = (RSI) > (RSI_MA)
🔴 SHORT = (RSI) < (RSI_MA)
🅰️ ADX
🟢 LONG = (+DI) > (-DI) and (ADX) > (Treshold)
🔴 SHORT = (+DI) < (-DI) and (ADX) > (Treshold)
🥊 SAR
🟢 LONG = (close) > (SAR)
🔴 SHORT = (close) < (SAR)
☁️ Cloud
🟢 LONG = (Cloud A) > (Cloud B)
🔴 SHORT = (Cloud A) < (Cloud B)
☁️ Cloud
🟢 LONG = (Kama) > (Kama )
🔴 SHORT = (Kama) < (Kama )
🌡️ R/F
🟢 LONG = (high) > (UP Range) and (upward) > (0)
🔴 SHORT = (low) < (DOWN Range) and (downward) > (0)
🌡️ R/F
🟢 LONG = (high) > (UP Range)
🔴 SHORT = (low) < (DOWN Range)
📐 S/R
🟢 LONG = (close) > (Resistance)
🔴 SHORT = (close) < (Support)
╭╯MA2️⃣
🟢 LONG = (Cyan Bar MA2️⃣)
🔴 SHORT = (Red Bar MA2️⃣)
╭╯MA2️⃣
🟢 LONG = (close) > (MA2️⃣)
🔴 SHORT = (close) < (MA2️⃣)
╭╯MA2️⃣
🟢 LONG = (Positive MA2️⃣)
🔴 SHORT = (Negative MA2️⃣)
__________________________________________________________
🎯 TP / SL 🛑
__________________________________________________________
🎯 TP: 1.5 %
🛑 SL: 2.0 %
__________________________________________________________
🪄 UNIQUE FEATURES OF THIS STRATEGY
____________________________________
1) 𝄜 Table Backtest for Mobile.
2) 𝄜 Table Backtest for Computer.
3) 𝄜 Table Backtest for Computer & Annual Performance.
4) 𝄜 Live Entry Conditions.
1) 𝄜 Table Backtest for Mobile.
2) 𝄜 Table Backtest for Computer.
3) 𝄜 Table Backtest for Computer & Annual Performance.
4) 𝄜 Live Entry Conditions.
_____________________________
𝄜 BACKTEST / PERFORMANCE 𝄜
_____________________________
• Net Profit: +634.47%, Maximum Drawdown: -18.44%.
🪙 PAIR / TIMEFRAME ⏳
🪙 PAIR: BINANCE:BTCUSDT.P
⏳ TIME: 4 hours (240m)
✅ ON ☑️ OFF
✅ LONG
✅ SHORT
🎯 TP / SL 🛑
🎯 TP: 1.5 (%)
🛑 SL: 2.0 (%)
⚙️ CAPITAL MANAGEMENT
💸 Initial Capital: 10000 $ (TradingView)
💲 Order Size: 10 % (Of Equity)
🚀 Leverage: 10 x (Exchange)
💩 Commission: 0.03 % (Exchange)
📆 BACKTEST
🗓️ Start: Setember 24, 2019
🗓️ End: November 21, 2025
🗓️ Days: 2250
🗓️ Yers: 6.17
🗓️ Bars: 13502
📊 PERFORMANCE
💲 Net Profit: + 63446.89 $
🟢 Net Profit: + 634.47 %
💲 DrawDown Maximum: - 10727.48 $
🔴 DrawDown Maximum: - 18.44 %
🟢 Total Closed Trades: 1042
🟡 Percent Profitable: 63.92 %
🟡 Profit Factor: 1.247
💲 Avg Trade: + 60.89 $
⏱️ Avg # Bars in Trades
🕯️ Avg # Bars: 4
⏳ Avg # Hrs: 15
✔️ Trades Winning: 666
❌ Trades Losing: 376
✔️ Maximum Consecutive Wins: 11
❌ Maximum Consecutive Losses: 7
📺 Live Performance : br.tradingview.com
• Use this strategy on the recommended pair and timeframe above to replicate the tested results.
• Feel free to experiment and explore other settings, assets, and timeframes.

CCI Zero Line StrategyCCI Zero Line Strategy i have created this using cci just check in different time frame you and check the results