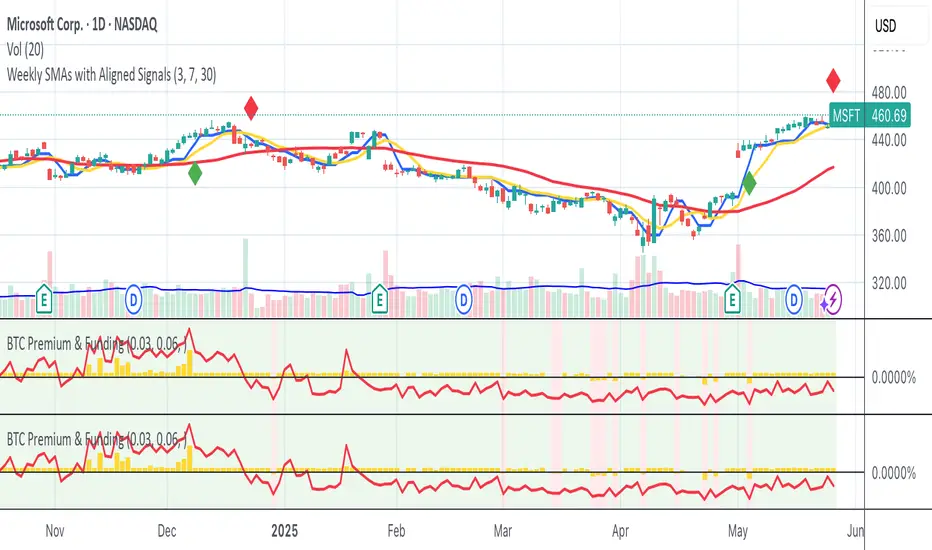
Bitmex BTC Perpetual Premium and FundingThis script tracks the premium (default red line) and the funding rate (default yellow area) of the Bitmex XBTUSD pair perpetual contract.
The calculations are based on the 8H TWAP of interest rates and premium index from Bitmex.
BTCUSD
[VIP] Composite BTC Funding Rate APR
Calculates and displays a BTC funding rate (positive or negative) in terms of APR. Positive APR = Positive funding. Negative APR = Negative funding
This calculation is sourced from a variety of spot and perpetual markets on a couple of top-volume exchanges, Binance, FTX, etc.
This logic is utilized in Dip Hunter and Take Profit Hunter
Code is open source! All feedback and improvements encouraged

Universal logarithmic growth curves, with support and resistanceLogarithmic regression is used to model data where growth or decay accelerates rapidly at first and then slows over time. This model is for the long term series data (such as 10 years time span).
The user can consider entering the market when the price below 25% or 5% confidence and consider take profit when the price goes above 75% or 95% confidence line.
This script is:
- Designed to be usable in all tickers. (not only for bitcoin now!)
- Logarithmic regression and shows support-resistance level
- Shape of lines are all linear adjustable
- Height difference of levels and zones are customizable
- Support and resistance levels are highlighted
Input panel:
- Steps of drawing: Won't change it unless there are display problems.
- Resistance, support, other level color: self-explanatory.
- Stdev multipliers: A constant variable to adjust regression boundaries.
- Fib level N: Base on the relative position of top line and base line. If you don't want all fib levels, you might set all fib levels = 0.5.
- Linear lift up: vertically lift up the whole set of lines. By linear multiplication.
- Curvature constant: It is the base value of the exponential transform before converting it back to the chart and plotting it. A bigger base value will make a more upward curvy line.
FAQ:
Q: How to use it?
A: Click "Fx" in your chart then search this script to get it into your chart. Then right click the price axis, then select "Logarithmic" scale to show the curves probably.
Q: Why release this script?
A: - This script is intended to to fix the current issues of bitcoins growth curve script, and to provide a better version of the logarithmic curve, which is not only for bitcoin , but for all kinds of tickers.
- In the public library there is a hardcoded logarithmic growth curve by @quantadelic . But unfortunately that curve was hardcoded by his manual inputs, which makes the curve stop updating its value since 2019 the date he publish that code. Many users of that script love using it but they realize it was stop updating, many users out there based on @quantadelic version of "bitcoin logarithmic growth curves" and they tried their best to update the coordinates with their own hardcode input values. Eventually, a lot of redundant hardcoded "Bitcoin growth curve" scripts was born in the public library. Which is not a good thing.
Q: What about looking at the regression result with a log scale price axis?
A: You can use this script that I published in a year ago. This script display the result in a log scale price axis.

BTC Golden Bottom with Adaptive Moving AverageIntroduction:
This study uses Adaptive Moving Average with 1 year of length to plot on all time history Index Calculated by Tradingview . All previous $BTC bear runs bottomed on this curve which makes it important enough. Use this only on " "
Default Values:
AMA length is 1 year
Minor length is 50
Major length is 100

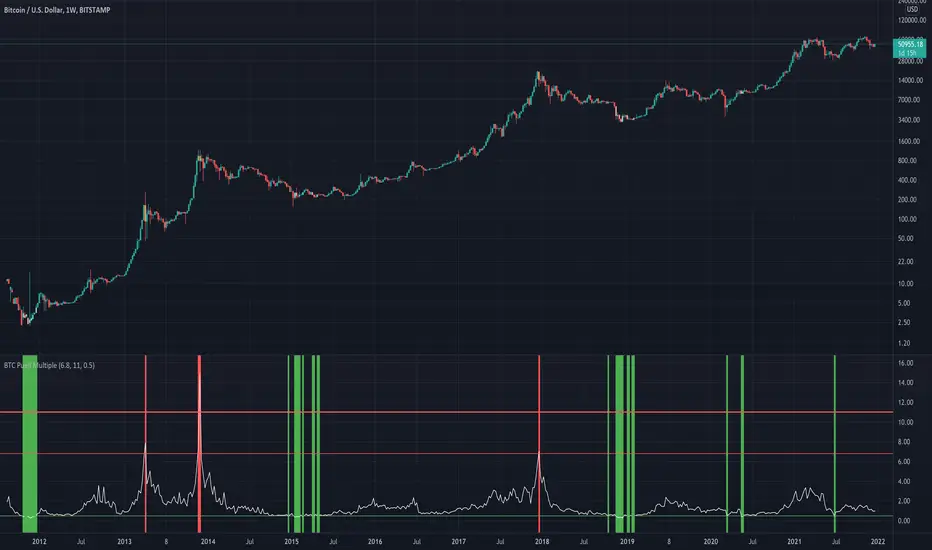
BTC Puell Multiple with alert functionThe Puell Multiple examines the fundamentals of mining profitability and the way they shape market cycles. It is calculated by taking a ratio of daily coin issuance (in USD) and the 365 moving average of daily coin issuance (in USD).
Interpretation of the Puell Multiple can generally be considered in the following framework:
high values indicate that current miner profitability if high compared to the yearly average. As such, the incentive for miners to liquidate their treasuries is high and greater sell pressure may be expected.
Low values indicate that current miner profitability is low compared to the yearly average. As such, income stress may become a factor, and some miners may need to start reducing hash-power by switching off rigs. This increases the hash-share of remaining miners who can then sell fewer coins to cover their operations, reducing their impact on liquid supply.
Halving events will drop the current coin issuance by 50% relative to the preceding year creating an immediate halving of the Puell Multiple also. The effect on miner profitability will thus be as per the point on low values above.
60-Day Accumulated Increasing RateIs this Bitcoin bull run still driven by new investors and new funds? Definitely. That’s why the 60-day accumulative increasing rate is so important and it can even determine everything. The only thing that can be trusted is the math. In history, each capital inflow uptrend bull run has ended once the 60-day accumulative increasing rate reached a high level and when the short-term euphoric investors push BTC price to rise at a fast speed and use up all kinds of leverages. At that point, there’s no time for new investors and new funds to flow in, thus the cryptocurrency market will crash from the global top.
In that sense, the crashes on 4th September, 2017 and 19th May, 2021 didn’t end the bull run, instead,they lengthened the bull run span.The last bull run cycle (2017) might have ended prematurely when BTC reached $10,000, recording 150% accumulated increase over 60 days. Then BTC won’t be pumped up to $20,000 if the course wasn’t interrupted by September 4th, 2017 incident.
Technical analysts(they are far from trustworthy, full of bollocks) call the correction of BTC: “consolidation or wipeout”, just like that diabetes is called as Liver Qi Stagnation, weight lossing, being thirsty and other symptoms. It’s quite fun to watch so many people explaining it in a false concept. Everyone knows what the maths is. That’s enough.
PS: This indicator can only be applied to Bitcoin daily chart!

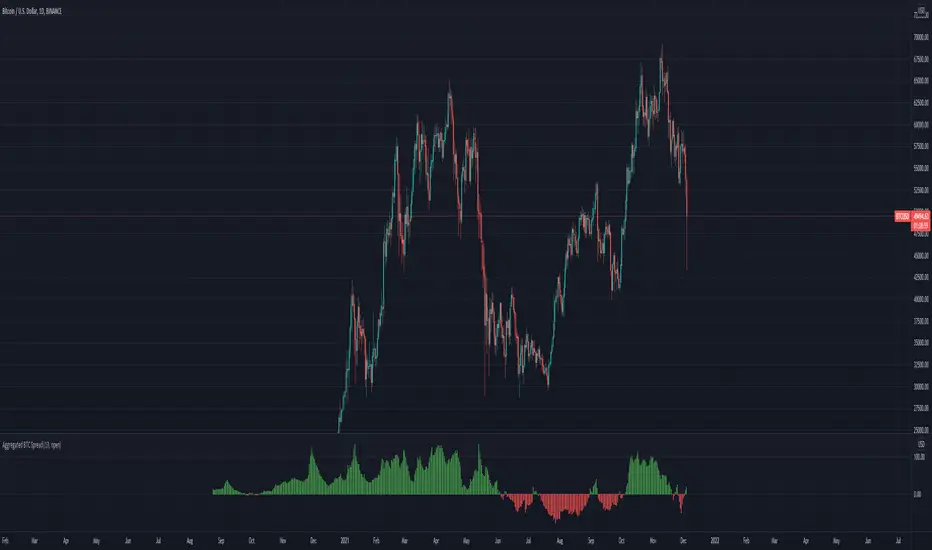
Aggregated BTC SpreadThis script is used to aggregate the bitcoin spread on futures contracts on different platforms.
It works by averaging the for every selected exchange, and apply an EMA of .
It is supporting
Binance (USD / USDT)
Okex
FTX
Huobi
Deribit
Ascendex
CME (BTC1!)
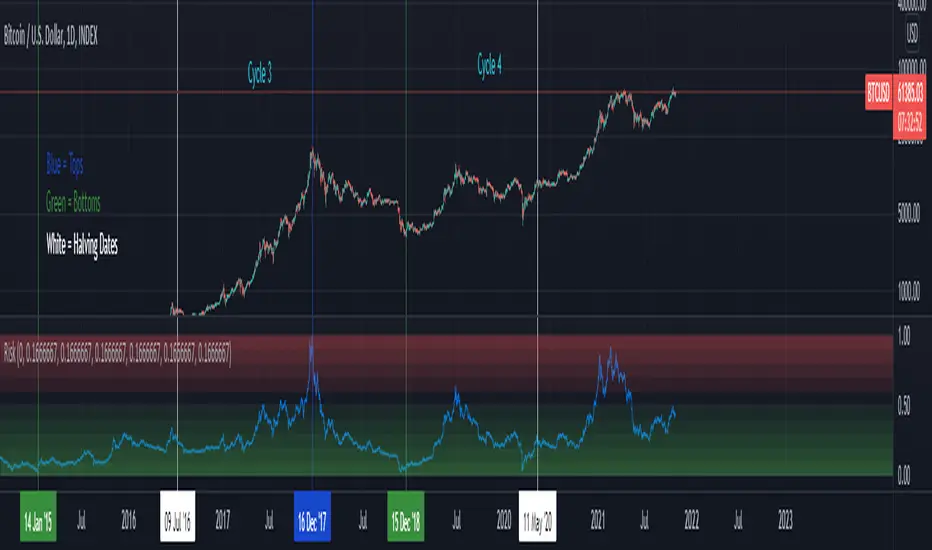
BTC Risk Metric - Estimates the risk of BTC price versus the USD
- To be used on the daily timeframe
- Works best on a BTC pair that has a lot of bars, e.g. The Bitcoin All Time History Index
- 0 is the lowest risk, 1 is the highest risk
- Historically, buying when the risk was low and selling when the risk was high would have yielded good ROI
- The risk bands are 0.1 in width and are highlighted on the plot
Typical Strategy:
- weighted DCA into the market when risk <0.5, do nothing between 0.5-0.6 and weighted DCA out of the market when risk >0.6
- x = buy amount per DCA interval
- y = 1/10th total BTC held by the user
- if 0 ≤ Risk < 0.1 then buy 5x
- if 0.1 ≤ Risk < 0.2 then buy 4x
- if 0.2 ≤ Risk < 0.3 then buy 3x
- if 0.3 ≤ Risk < 0.4 then buy 2x
- if 0.4 ≤ Risk < 0.5 then buy x
- if 0.5 ≤ Risk < 0.6 then do nothing
- if 0.6 ≤ Risk < 0.7 then sell y
- if 0.7 ≤ Risk < 0.8 then sell 2y
- if 0.8 ≤ Risk < 0.9 then sell 3y
- if 0.9 ≤ Risk ≤ 1.0 then sell 4y

Roberts Pi Cycle Top and Bottom Indicator BTCIndicator Overview
The Pi Cycle Top Indicator has historically been effective in picking out the timing of market cycle highs to within 3 days.
It uses the 111 day moving average (111DMA) and a newly created multiple of the 350 day moving average, the 350DMA x 2.
This updated indicator is based on the original x2 Daily Simple Moving Average Pi Cycle Top Indicator for BTCUSD but with the addition of a 3rd 350 SMA
Standard Pi Cycle SMA = 350*2 SMA + 111 SMA
Updated Pi Cycle SMA = 350*2 SMA + 111 SMA + 350 SMA
How It Can Be Used / How to Read:
Chart should be used on BTCUSD only
Chart should be set to Daily Timeframe only
Buy signal RED SMA crosses up over WHITE SMA
Sell Signal RED SMA crosses up over GREEN SMA (a vetical yellow line will indicate the cycle top)

[CP]Pivot Boss Floor Pivots with ATR Dilation and Dynamic LevelsINTRODUCTION:
Compared to all the Pivot Indicators available on Trading View Public Library, this Floor Pivots Indicator differentiates itself in two major original ways:
Dilates the Pivot Support/Resistance Levels into Support/Resistance Bands based on volatility
Displays the S/R Levels Dynamically , that is, only those levels will be shown that are close enough to the price resulting in much cleaner looking charts.
There were a few features whose logic I had figured out, but I could not implement them due Pine Script’s Limitation (they should really work on increasing Pine Script’s capacity instead of adding more and more features to the language in order to make it look ‘better’):
Showing multiple timeframe pivots at the same time (not possible due to Pine Script’s limitation on the ‘Max Number of Outputs’ )
Automatic Detection of highly profitable Double Hot Pivot Zones (DPZ), also due to the ‘Max Number of Outputs’ limit
GENERAL USER INPUTS:
Most of the settings are self-explanatory, however, a few of them need some explanation:
Show Floor Pivots Dynamically – This will turn ON the dynamic pivot levels, please note that this function will work ONLY IN INTRADAY timeframes.
Dynamic Pivot ATR Period – Period over which the ATR value is calculated to show the pivots dynamically.
ATR Threshold for Dynamic Floor Pivots – Simply put, the indicator will start displaying Pivot Levels if they fall within the 2*ATR distance (default value) of the price. You can increase this number if the volatility increases and vice-versa.
Use ATR to Dilate Intraday Pivot Levels – This will turn ON Floor Pivot Dilation, turning pivot ‘lines’ into ‘bands’ .
ATR Dilation Factor – This number decides the width of the Pivot bands. Larger this number, thicker the bands. Typically, high volatility stocks will require a higher number.
ATR Period – Same as Dynamic Pivot ATR Period, but for Pivot Level Dilation.
INDICATOR USAGE EXAMPLES:
This indicator works great in conjunction with my Pivot Boss Candlestick Scanner indicator.
There are a lot of optimizations I have done in the code, although it looks trivial at first glance, but it's fairly complex.
Feel free to use it and modify it as you wish.
Here are a few examples where the indicator has shown great entries and exits, with the default settings:
NIFTY 5m Chart
Reliance 5m Chart
Tesla 5m Chart
Bitcoin-USDT 15m Chart
FINAL WORDS:
Please understand that I have Cherry Picked the examples to showcase the capability of the indicator and its usage.
DO NOT conflate the accuracy of examples with the accuracy of this indicator.
Once you start using floor pivots, you will realize that a lot of days simply don’t give any high probability setups and you will simply sit out of the market and do nothing (which is a good thing).
If you really want to learn how to use Pivots, read the book ’Secrets of a Pivot Boss’ . This book can change your life.

BTCUSD Risk Oscillator- To be used with the BTCUSD All Time History Index (on the daily)
- Estimates the current risk of BTCUSD
- The risk model oscillates between 0 and 1 (0 is the lowest risk, 1 is the highest)
- Historically, buying when the risk is low and selling when the risk is high yields good ROI
- User inputs generally do not need to be changed, they are used to create integers for the normalization process
Bitcoin Logarithmic Fractal Growth Model By ARUDDThis model, which I'm calling the Logarithmic Fractal Growth Mode (L.F.G) , uses Bitcoin's mathematical monetary policy to evaluate the future possible price valuation.
It takes into account fractal (and logarithmic) growth as well as how those who hold bitcoins might react to certain events such as changes in supply and demand. It also shows that it is mathematically logical that someday it must become stable.
The information gained from knowing this helps people make more informed decisions when buying bitcoin and thinking of its future possibilities.
The model can serve as some type of general guideline for determining how much bitcoins should be worth in the future if it follows a certain path from its current price.
Modeling Bitcoin's money supply mathematically, and knowing that there is a finite number of them, makes this whole process much more rational than just thinking about the possibilities in pure subjective terms.
Before going any further I want to say that no one can know with absolute certainty what will happen to bitcoins price in the future, but using mathematics gives us an idea of where things are headed.
The results presented here are based on very reasonable assumptions for how bitcoin might continue to grow (and then level out) once there are over 21 million bitcoins in existence.
The model shows that bitcoin's price can never go down to zero (thus creating the "death spiral" phenomenon), and as such, bitcoin has an extremely high probability of becoming stable as it approaches infinity.
Conversely, this model also shows that at some point there is a high probability that bitcoin will not continue to grow exponentially forever.
Credit goes to Quantadelic for the awesome original script.
ARUDD

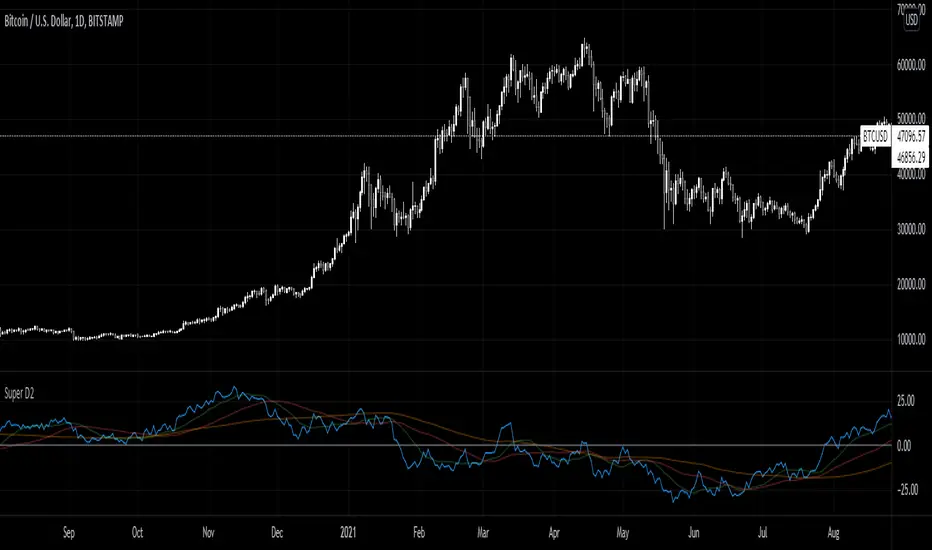
Super D2Momentum Indicator based on previous candle structure over past 40 periods
- Blue is momentum score
- Green = 15 ema
- Red = 50 sma
- orange = 100 sma
The indicator looks at the previous candles differences between open, close, high, and low to determine momentum. A high close relative to open or low indicates very strong momentum for example.
Kimchi Premium Indicator with Selectable SymbolsThis indicator is the Korea Premium, also known as “Kimchi Premium” indicator, which shows how expensive and cheap the bitcoin price of the bitcoin exchange in Korea as compared to the bitcoin price traded in dollars or tether. Previously, the Kimchi premium indicator in TradingView does not have the recently added Upbit BTCKRW market, and it is not possible to select markets. In addition to the recently added Upbit BTCKRW market, this indicator is convenient because you can select all markets offered by TradingView. Therefore, not only bitcoin but also altcoin kimchi premium can be plotted.
▶ Usefulness and Originality
- Users can choose from various BTCKRW and BTCUSD markets.
- Users can plot altcoin Kimchi Premium in addition to Bitcoin.
_____________________________________________________________
이 지표는 달러 혹은 테더로 거래되고 있는 비트코인 가격 대비 한국에 있는 비트코인 거래소의 비트코인 원화 가격이 얼마나 비싸고 싼 지를 나타내는 코리아 프리미엄, 일명 "김치 프리미엄" 지표입니다. 이전에 트레이딩뷰에 있는 김치 프리미엄 지표는 최근에 추가된 업비트 BTCKRW 시장이 없을 뿐만 아니라 마켓을 선택할 수가 없습니다. 이 지표는 최근에 추가된 업비트 BTCKRW 마켓과 더불어 트레이딩뷰에서 제공하는 모든 마켓을 선택할 수 있어 편리합니다. 따라서 비트코인 뿐 만 아니라 알트코인의 김치 프리미엄도 plot할 수가 있습니다.
▶ 유용성과 독창성
- 사용자가 다양한 BTCKRW 및 BTCUSD 마켓을 선택할 수 있음
- 사용자가 비트코인 외에 알트코인 김치프리미엄도 plot 할 수 있음

Chanu Delta IndicatorThe Chanu Delta Indicator was created as the price difference between the two markets using the principle that the Bitcoin price fluctuations in the BTCUSD market on the BYBIT exchange are greater in the BTCUSDT market. This indicator shows the strength of the current market's buys and sells, and helps in short-term trading.
Chanu Delta Indicator (Δ) = BTCUSD ($) - BTCUSDT ($) (Unit: Dollar, Source: Close)
● Δ > 100 : Strong Buy
● 20 < Δ < 100 : Buy
● -20 < Δ < 20 : Neutral
● -100 < Δ < -20 : Sell
● Δ < -100 : Strong Sell

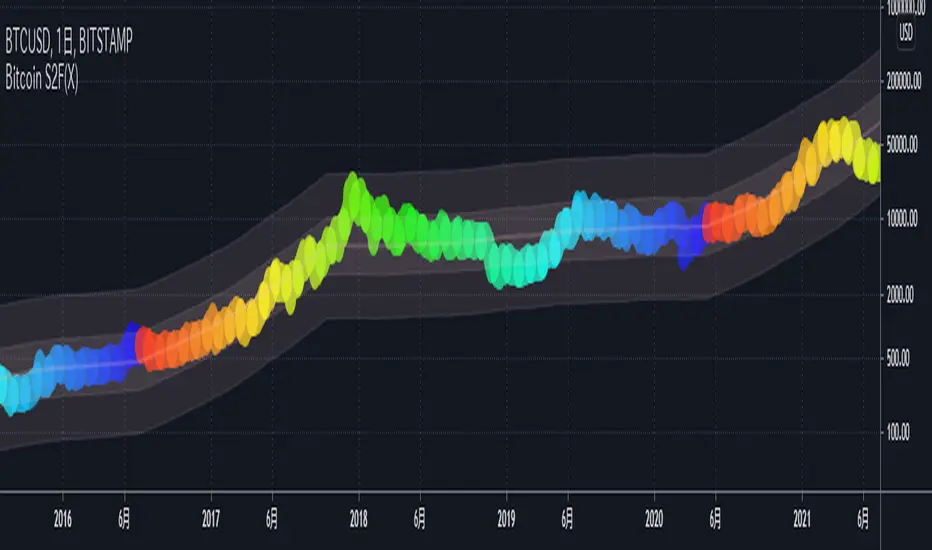
Bitcoin S2F(X)This indicator shows the BTCUSD price based on the S2F Model by PlanB.
We can see not only the S2F(Stock-to-Flow) but also the S2FX(Stock-to-Flow Cross Asset) model announced in 2020.
█ Overview
In this model, bitcoin is treated as comparable to commodities such as gold .
These commodities are known as "store of value" commodities because they retain their value over time due to their relative scarcity.
Bitcoins are scarce.
The number of coins in existence is limited, and the rate of supply is at an all-time low because mining the 2.2 million outstanding coins that have yet to be mined requires a lot of power and computing power.
The Stock-to-flow ratio is used to evaluate the current stock of a commodity (the total amount currently available) versus the flow of new production (the amount mined in a given year).
The higher this ratio, the more scarce the commodity is and the more valuable it is as a store of value.
█ How To View
On the above chart price is overlaid on top of the S2F(X) line. We can see that price has continued to follow the stock-to-flow of Bitcoin over time. By observing the S2F(X) line, we can expect to be able to predict where the price will go.
The coloured circles on the price line of this chart show the number of days until the next Bitcoin halving event. This is an event where the reward for mining new blocks is halved, meaning miners receive 50% fewer bitcoins for verifying transactions. Bitcoin halvings are scheduled to occur every 210,000 blocks until the maximum supply of 21 million bitcoins has been generated by the network. That makes stock-to-flow ratio (scarcity) higher so in theory price should go up.
The stock-to-flow line on this chart incorporates a 463-day average into the model to smooth out the changes caused in the market by the halving events.
I recommend using this indicator on a weekly or monthly basis for BITSTAMP:BTCUSD .
█ Reference Script
Bitcoin Stock to Flow Multiple by yomofoV
Trend From Volume And Price (TFVAP)Indicator that indicates buying and selling times based on price and volume and who is imposed of the two (VAP).
It uses the trends of the Dow theory (primary: 365 days/1 year, secondary: 90 days/3 months and tertiary: 21 days/3 weeks) and the identification of Elliot waves, both impulse and correction, based on the Fibonacci retracements (23.61% , 38.2%, etc.).
- Purple line is the evolution in percentage of the price in the primary trend
- Blue line is the evolution in percentage of the volume in the primary trend
- White line is the evolution in percentage of the (volume % - price %) in the primary trend, if white line > 0
- Green triangleup is time of start to buy
- Green square is time of stop to buy
- Red triangledown is time of sell
To understand it better:
If the purple line goes up it indicates that the price is rising, if it goes down, that the price is down.
If the blue line is greater than 0 it indicates that there are more purchases than sales, if the blue line is less than 0 it indicates that there are more sales than purchases.
If the white line is greater than 0 there is a high volume of purchases or low sales for the price that there is, it is likely that the price will rise.
If the white line is less than 0 there is a low volume of purchases or high sales for the price that there is, it is likely that the price will go down.
PD: Ignore the chart drawings, the indicator script is only represented at the bottom

Low Timeframe POCI have recently made a High Timeframe POC script (HFT POC) which is pretty popular. Thanks for this!
There are many requests to include lower timeframes in this script, that is why I created this script. I could have incorporated all the timeframe POC's into one indicator but I went this route to keep things more organized between all the different timeframes.
Currently included: Daily, 6H, 3H and 1H
/* DEFINITION */
Point Of Control (= POC) is a price level at which the heaviest volumes were traded.
/* HOW TO TRADE WITH THIS INDICATOR */
The basis for POC is determining bias on whichever timeframe you choose.
1. Identify a POC on the timeframe of your choosing.
/* If you choose the lowest timeframe (1H here) then always make sure to look at the higher timeframes to see how it is trading against a HTF POC.
2. When the price is moving away from the POC (either to the upside or downside) this can confirm or invalidate a trade.
3. You can now enter the trade on bias or wait for a retest of the same POC.
/* EXAMPLE TRADES /*
Here is a screenshot of some of the trades that are possible using these Low Timeframe POC's and some common sense.
s3.tradingview.com

High Timeframe POCBecause the big Bitcoin crash I have been looking a lot at high timeframe metrics. I never spent much time learning POC so I decided to create a little script for determining these on higher timeframes.
Currently included: Monthly, 3 months and 6 months.
/* DEFINITION */
Point Of Control (= POC) is a price level at which the heaviest volumes were traded.
Value Area High/Low (=VAH/VAL) is a range of prices where the majority of trading volume took place. Naturally, Value Area High being the top price level and Value Area Low being the lowest. POC always is between the two.
/* HOW TO TRADE WITH THIS INDICATOR */
The basis for POC is determining bias on whichever timeframe you choose.
1. Identify a POC on the timeframe of your choosing.
/* If you choose a "low" timeframe (monthly here) then make sure to look at the higher timeframes to see how it is playing against a higher timeframe POC.
2. When the price is moving away from the POC (either to the upside or downside) this will confirm or invalidate the trade.
3. You can now enter the trade on bias or wait for a retest of the same POC.
/* EXAMPLE TRADES /*
Here is a screenshot of some of the trades that are possible solely using the POC and some common sense.
s3.tradingview.com

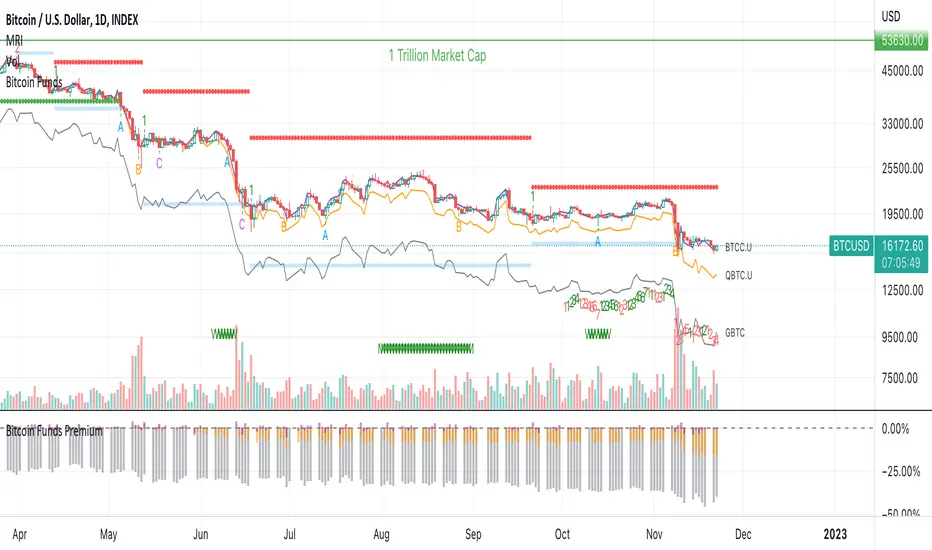
Bitcoin Funds PremiumDisplay the % premium of 4 different Bitcoin Funds relative to the price of Bitcoin in your current chart.
BTCC ETF
QBTC Fund
GBTC Trust
VBTC ETN
This indicator uses the metrics from the fund management websites to calculate the "Net Asset Value per Unit (NAVPU)" to calculate the true underlying value of the fund.
The difference is then compared to the price of Bitcoin in the chart you have open.
Note that the metrics change and therefore the graph is not accurate for long past timeframes.
If TradingView would expand their script language in a way to ingest CSV data from the funds website then this could be improved.
You can update the metrics for each fund in the settings dialogue.
The script will autodetect the currency pairs of your current graph and only display compatible funds:
BTC / USD will show BTCC.U, QBTC.U and GBTC
BTC / CAD will show BTCC and QBTC
BTC / EUR will show VBTC
The script should not show in other currency pairs so it will not mess up other charts you might switch to.
If you find bugs with this logic, please comment below so I can fix them.
Due to TradingViews "no-links in description" policy, you need to google each funds website yourself to find the current metrics. These search terms should help:
BTCC search "Purpose Bitcoin ETF"
QBTC search "3iq The Bitcoin Fund (QBTC)"
GBTC search "Grayscale® Bitcoin Trust"
VBTC search "VanEck Vectors Bitcoin ETN"
BTC Multi Exchange Perpetual PremiumThis script tracks the premium/discount of Bitcoin perpetual contracts at various exchanges.
The premium/discount is calculated against an index price. The index price is calculated from spot exchange prices and are weighted as follows:
Bitstamp:28,81%
Bittrex:5,5%
Coinbase: 38,07%
Gemini: 7,34%
Kraken: 20,28
The difference between this script and other available scripts, is that exciting script seems to only focus on one exchange. This script is also open source.

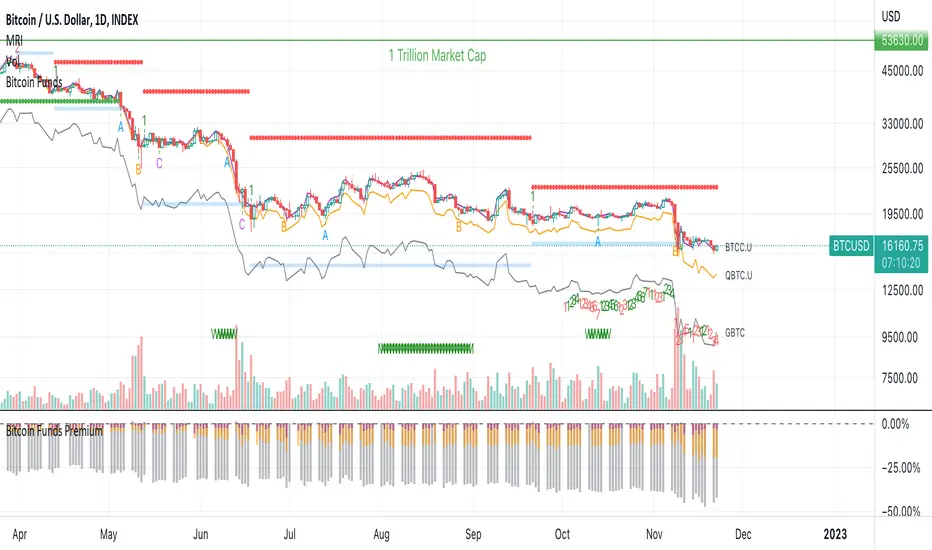
Bitcoin Funds OverlayOverlay the Net Asset Value per Unit (NAVPU) of 4 different Bitcoin Funds on your Bitcoin chart.
BTCC ETF
QBTC Fund
GBTC Trust
VBTC ETN
This indicator uses the metrics from the fund management websites to calculate the "Net Asset Value per Unit (NAVPU)" to display the true underlying value of the fund.
Note that the metrics can change and therefore the graph is not accurate for long past timeframes.
You can update the metrics for each fund in the settings dialogue.
The script will autodetect the currency pairs of your current graph and only display compatible funds:
BTC / USD will show BTCC.U, QBTC.U and GBTC
BTC / CAD will show BTCC and QBTC
BTC / EUR will show VBTC
The script should not show in other currency pairs so it will not mess up other charts you might switch to.
If you find bugs with this logic, please comment below so I can fix them.
Due to TradingViews "no-links in description" policy, you need to google each funds website yourself to find the current metrics. These search terms should help:
BTCC search "Purpose Bitcoin ETF"
QBTC search "3iq The Bitcoin Fund (QBTC)"
GBTC search "Grayscale® Bitcoin Trust"
VBTC search "VanEck Vectors Bitcoin ETN"
Binance Z VolumeBTC perpetual volume on Binance is about 4x spot volume.
Comparing spot and perpetual volumes could provide useful insights into market sentiment.
Abnormal increases in the spot market could be associated with accumulation. Abnormal increases in the perpetual market, on the other hand, could predict volatility as well lows and highs.
This script represents a Z-score of the volume of perpetual and 4xspot on Binance.
High values above 0 mean that the volume is skewed towards perpetual contracts. Values below 0 mean that the volume is skewed towards spot contracts.
Feel free to suggest changes and improvements of this script.
Translated with www.DeepL.com (free version)
BIO
