[astropark] DMI/ADX strategy [alarms]Dear Followers,
today I'm happy to share with you my DMI / ADX Strategy .
It provides directional trend information, so if a bullish or a bearish trend is going to start. Statistically it works better on lower timeframes (from 5 minutes to 1 hour).
It is both a Swing and Scalping Strategy indicator , based on a simple trend following theory , good for trading FOREX, Indexes, Stocks, Commodities and Cryptocurrencies.
To help in Taking Profits, the strategy integrates 2 special other than bull/bear signals:
Overbought and Oversold RSI Signals , which appear both as darker background (the darker the color, the more the price is in overbought/oversold) and green "ob"-"tp" / red "os"-"tp" labels (they optionally pop up only on a configurable stronger overbought/oversold condition) (you can enable/disable it optionally)
Peak Profit Tracker , which resets every time a new trade starts and keeps track of price fluctuation during the trade: the message is don't be too greedy and take profits or lock them with a stoploss in profit (you can enable/disable it optionally)
You can edit many options in order to
have more/less bull/bear signals
enable/disable showing bull/bear signals
enable/disable showing RSI TP signals (you can edit RSI length, overbought (OB) and oversold (OS) levels)
enable/disable showing peak profits on each trade
The user who wants to use this strategy, especially via an automated bot, must always set a stoploss (example 150$ from entry on bitcoin ) or use a proper risk management strategy .
This is not the "Holy Grail", so use it with caution. It's highly suggested to use a proper money management .
This script will let you set all notifications you may need in order to be alerted on each triggered signals.
You can find the strategy version for backtesting here below:
Here there are some examples how this DMI / ADX strategy works on many markets:
LTC/USDT 15m
BTC/USD 15m
BNB/BTC 15m
ETH/USD 15m
GOLD (XAU/USD) 15m
GOLD (XAU/USD) 1h
FB 15m
AAPL 15m
TSLA 1h
BANKNIFTY Index 5m
NIFTY 50 Index 5m
This is a premium indicator , so send me a private message in order to get access to this script .
Corak Bulis

TBT ForecasterThe TBT Forecaster is a visual representation of the "weather forecast" for the crypto market, mainly Bitcoin and ALT coins.
Purpose:
The reason behind creating this indicator is to help give crypto traders a sense of what to expect in crypto currency markets. In general, crypto markets (ALT coins) are extremely dependent on the price action and sentiment of Bitcoin. By knowing what to expect for both BTC and ALT markets, crypto traders will have an edge on other traders by:
knowing when it's a good time to run BTC or stable coin pairs for bots on 3Commas
knowing when the ALT market is in a Bullish or Bearish mood
knowing if we're in a true ALT season or not
knowing if they should be focusing more on active trading on the BTC or stable coin market
Time Frame:
The TBT Forecaster can be viewed on any time frame, but it was originally designed to work off of the 6-hour time frame. Note that faster (higher) time frames can make the tool somewhat unreliable since faster (higher) time frames are subject to more sudden, volatile movements compared to the 6-hour or Daily time frames. To help users of the TBT Forecaster keep a healthy perspective, the indicator can be set to "same as symbol" (the indicator will adapt to any time frame you use) or "6 hours" (the original and intended time frame).
Metrics:
The two lines of the indicator represent Bitcoin (top) and ALT coins (below). The TBO Forecaster uses information derived from the price of Bitcoin, Bitcoin price volatility, moving averages, ATR (Average True Range), Bitcoin Dominance, and the ALT coin indexes (TOTAL2 and OTHERS). All of these metrics are combined and weighted into a system that quantifies the market sentiment for BTC and ALTs.
Sentiment:
The TBT Forecaster shows a gradient of market sentiment, from Bearish to Bullish. These market sentiment labels consist of a variety of different metrics that have to do with volume, price action, and several indices. The full gradient of sentiment is:
Bearish
Weak Bearish (ALT line only)
Neutral
Weak Bullish
Bullish
Realistic Expectations:
Note that it is impossible and unrealistic for the ALTs line to represent every single ALT coin/token/chart/symbol on every exchange. In my experience, there are always good charts to trade no matter what Bitcoin is doing. However, if we as traders know that ALTs are Bearish, then we can focus our efforts on trading Bitcoin (or just staying out of the ALT market until conditions change).
Use the link below to obtain access to this indicator

NSDT Background Bear Bull DayA very basic script that changes the background color of the chart to Green if the price closes over the previous day close, and to Red if the price closes under the previous day close. This allows you to easily see if it is currently a Bull or Bear market with a glance. Alerts added.
[astropark] Nova BandsDear followers,
today a new analysis and scalping tool for day trading on low timeframes (5-15 minutes) or to plan swing trades on hourly timeframes. It can be used also on high timeframes just for analysis current market trend.
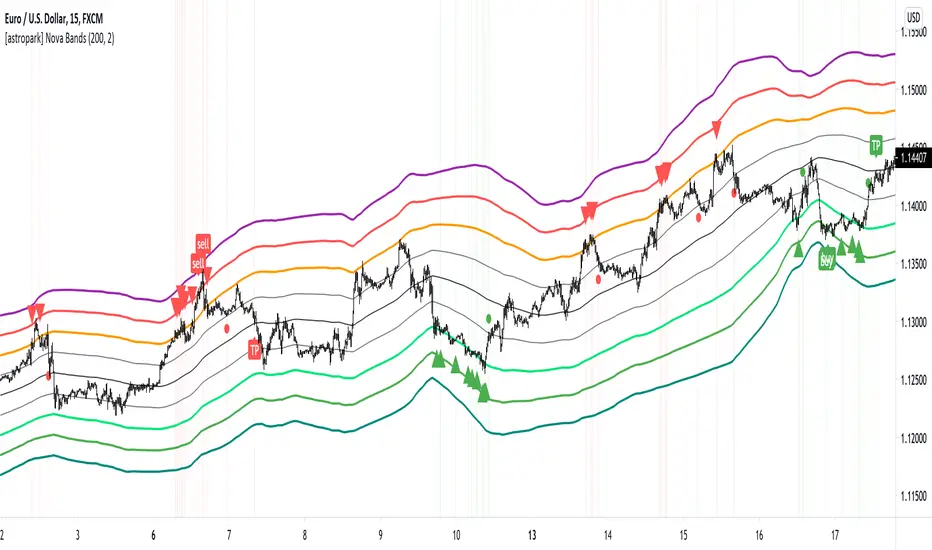
The indicator plots a series of levels which create a nice bands flow.
The slope of levels make you easily understand when price is in consolidation, in uptrend or in downtrend.
The golden rule is always the same: buy low and sell high .
This indicator plots:
3 "price is low here" levels (from dark green to light green)
3 "price is average here" levels
3 "price is high here" levels (from purple to orange)
When bands are flat, price is in consolidation and this is best condition to trade with nova bands.
When price reaches higher bands, you will open a short position with targets below levels, fully closing your position when price hits the average level (black).
Here an example on Bitcoin on 15m using 1h resolution:
The same applies when price reaches lower bands, you will open a long position with targets above levels, fully closing your position when price hits the average level (black).
When bands get nearer and nearer is called "Bands Squeeze": price is next to a main breakout move, volatility is coming!
Here an example of SPX500: after long consolidation and bands getting nearer and neared, we had the breakout, downwards in this case.
In this screenshot you can see what signals algorithm provided:
Our suggestion is to play safe these kind of scenarios, no reason to FOMO buy/sell. Just wait for price consolidation / getting back inside the bands.
For example you would have skip first three buy signals, while you would have longed the last two as price came back inside bands after the big volatility which made price went below bands.
Another example is TSLA stock on 15m with 1h resolution:
Price touched the first bullish level and made a big move upwards, breaking bands with a +90% move.
In this case, you would have skipper first 2 sell signals, while you would have accepted next two with stoploss above recent high.
Acceptable also the other two sell signals, which you may have closed when price retraced to lower levels:
You can of course run trends like this buying on price hitting bullish/lower levels after a long consolidation and sell on price hitting middle and higher levels:
A trader who wants to be a winner must understand that money and risk management are very important, so manage your position size and always have a stop loss in your trades.
Here some examples how the indicator works on different markets:
EURUSD 15m with standard settings and 1h resolution
GOLD (XAUUSD) 15m with standard settings and 1h resolution
Facebook (FB) 15m with standard settings and 1h resolution
This is a premium indicator , so send me a private message in order to get access to this script.
[SCL] True Market StructureSee market structure at a glance with Higher Highs and Lower Lows. Bullish/Bearish/Ranging market bias is automatically derived. Optionally get alerted for breaks in market structure. Uses true Local Highs/Lows instead of simply the highest/lowest "pivot" for x bars. Can be useful as a support for learning market structure or for alerts for a change in structure while you're not at the computer.

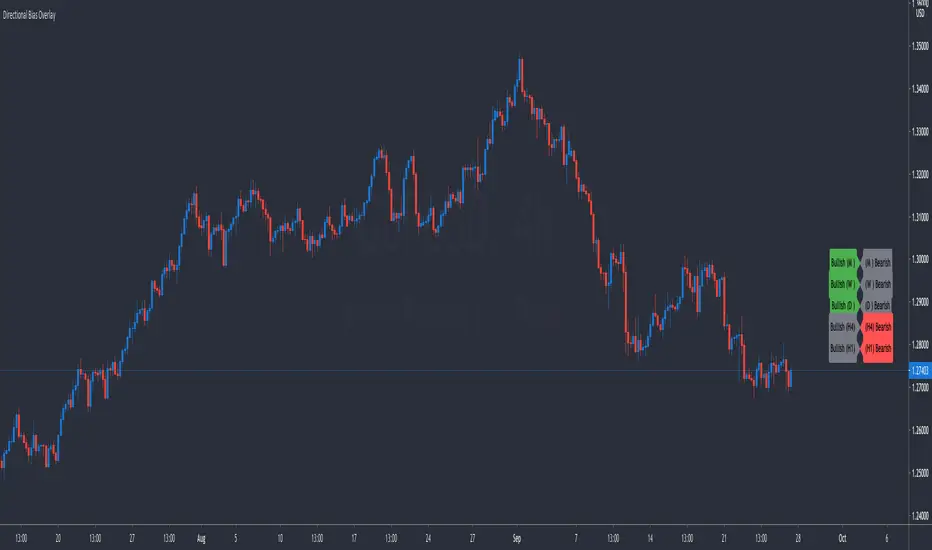
Directional Bias OverlaySimple indicator that keeps track of your thoughts on directional bias from the Monthly Timeframe down to the 1 Hour Timeframe. Features include:
Toggle Timeframes On or Off
Keep Track Of Up To 10 Currency Pairs At A Time
Adjust The Offset From Price So The Indicator Is Out Of The Way
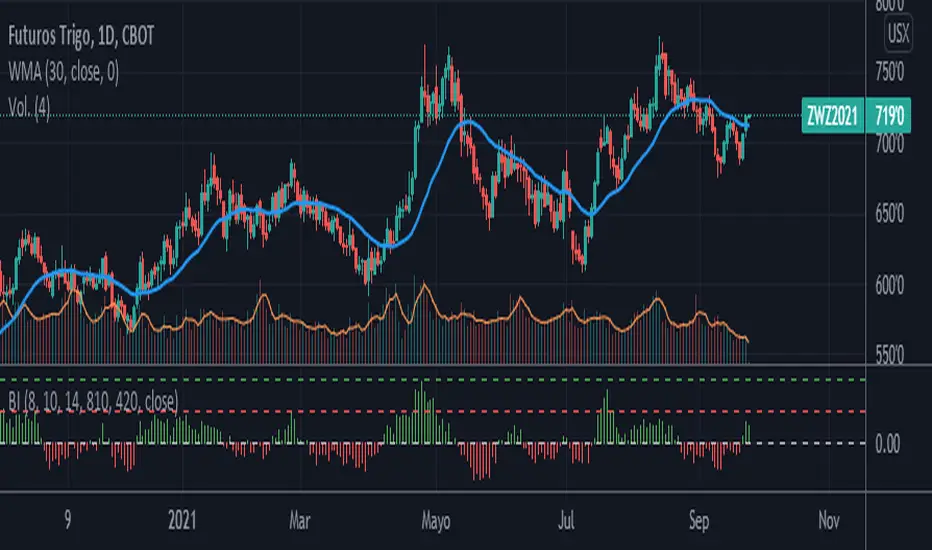
Bullish InertiaThe Bullish Inertia is an indicator that measures the strength of an asset with respect to its volatility, calculated as:
Strength / Volatility = Bullish Inertia (BI)
Parameters:
Len1 = Length of ROC1
Len2 = Length of ROC2
Len3 = Length of the ATR
//Spanish
La inercia alcista es un indicador que mide la fortaleza de un activo respecto a su volatilidad, calculado como:
Fortaleza / Volatilidad = Inercia Alcista (IA)
Parametros:
Len1 = Longitud de ROC1
Len2 = Longitud del ROC2
Len3 = Longitud del ATR
Bullish and Bearish by NicolErazoFThis indicator changes the color of the candlesticks when there’s a change in the trend to the rising or falling trend.
BEARISH ENGULFING: Yellow candlestick. It is an engulfing falling trend reversal; you must make a sell decision.
BEARISH HARAMI: White candlestick. Indicates a possible falling trend change, you must be alert for a possible sale.
BULLISH ENGULFING: Black candlestick. It is a change in the engulfing rising trend, you must make a purchase decision.
BULLISH HARAMI: Blue candlestick. Indicates a possible rising trend change, you should be alert for a possible purchase.
On the chart, you can see the 4 candles, on September 11 the black candle appears indicating a change in the uptrend. But today, the white candle is seen, which appears on September 8, indicating a rebound with a possible change in trend to bearish.
Previous days, on August 26, you see the blue candle with a possible change in the upward trend, which then, on August 28, a yellow candle appears with a change in the downward trend.
The Engulfing indicator (yellow and black) says that the candle has an engulfing change that is radical.
On the other hand, the Harami (blue and white) indicates a possible change in trend that must be previously analyzed.
Harami candles are smaller than Engulfing candles, since Harami in a Japanese term that means pregnancy, where the previous candle is the woman and the next candle is the baby.
___________________________________________________________________________
ESPAÑOL
Este indicador cambia las velas de color cuando ocurre un cambio de tendencia ALCISTA o BAJISTA
BEARISH ENGULFING: Vela de color amarillo. Es una cambio de tendencia bajista envolvente, debes tomar una decisión de venta.
BEARISH HARAMI: Vela de color blanco. Indica un posible cambio de tendencia bajista, debes estar alerta para una posible venta.
BULLISH ENGULFING: Vela de color negro. Es un cambio de tendencia alcista envolvente, debes tomar una decisión de compra.
BULLISH HARAMI: Vela de color azul. Indica un posible cambio de tendencia alcista, debes estar alerta para una posible compra.
En el gráfico, se pueden ver las 4 velas, el 11 de Septiembre aparece la vela negra que indica un cambio de tendencia alcista. Pero hoy, se ve la vela blanca, que aparece el 8 de septiembre, indicando un rebote con un posible cambio de tendencia a bajista.
Días anteriores, el 26 de Agosto, se ve la vela azul con un posible cambio de tendencia alcista, que luego, el 28 de agosto aparece una vela amarilla con cambio de tendencia bajista.
El indicador Engulfing (amarillo y negro) dice que la vela tiene un cambio envolvente que es radical.
En cambio, el Harami (azul y blanco) indica un posible cambio de tendencia que debe ser previamente analizado.
Las velas Harami son más pequeñas que las Engulfing , ya que Harami en un término japonés que significa embarazo, en donde la vela anterior es la mujer y la vela siguiente es el bebé.

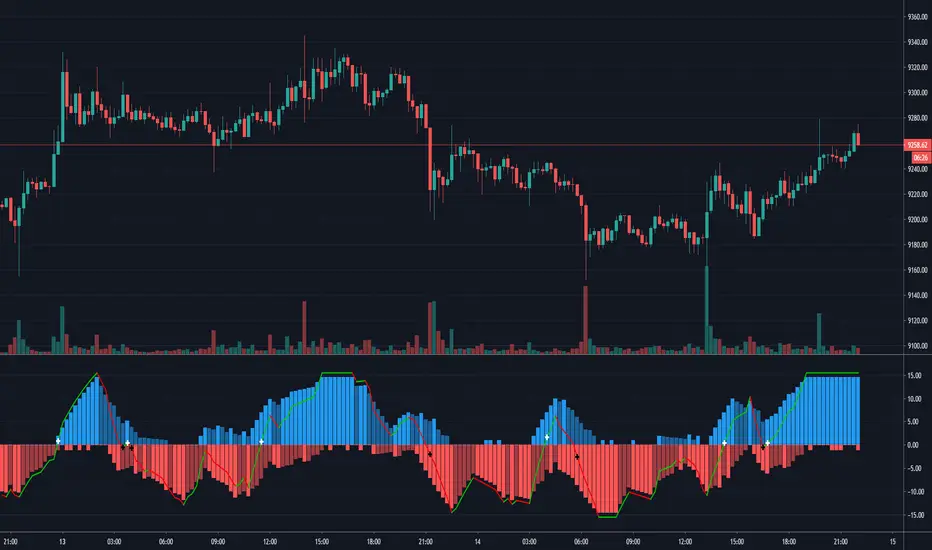
Patreon Bull Bear OscillatorThe Patreon bull-bear oscillator (PBBO) was carefully designed to give as much information as possible to the user without sacrificing readability. With it, you can detect the direction of trends, detect whether the market is ranging or trending, tell if a given signal is false, and easily spot divergences, in fact, the PBBO is the only indicator of the trend trading tier that was designed to spot potential reversals.
The indicator comes with alerts.
Settings
Length: Control the sensitivity to price variations, with a higher value aiming to detect longer-term trends.
Control Line Divisor: Divisor of the control line
Src: Source input of the indicator
Pre-Smoothing: If true, smooth "Src" before calculating the PBBO
Smooth: Period of the moving average used for pre-smoothing
Pre-Smoothing Method: Determine the type of moving average to be used during the pre-smoothing step. Available options are: EMA, TMA (triangular moving average), HULL, LSMA (least squares moving average)
Filter Alerts Based On The Control Line: Add an additional condition for the alerts.
Detecting The Direction Of A Trend
The indicator display three lines, one bull line (in blue), one bear line (in red), and a control line (in green). A bullish market is detected when the bull line is over the bear line, while a bearish market is detected when the bear line is over the bull line.
When one of the lines is declining, it means that the current trend is weakening, showing the potential for a retracement or reversal.
Filter Out False Signals With The Control Line
The PBBO is still subject to all the price variations you will see on your chart, and as such can return false signals, it is important to tell if a bullish/bearish market is significant before making a move, and this is what the control line aims to do.
The control line divisor can provide a way to control the position of the control line, with lower values of the divisor requiring even more significant moves in order to trigger a signal. A value of 2 for the control line divisor is recommended in order to filter out false signals.
Detecting Whether Market Is Trending Or Ranging
Telling when the market is trending is primordial in trend trading, and many indicators that aim to return this information have been proposed. The PBBO is also able to give such information. First, you can look at the bull and bear lines, if both are equal to 0, it means the market is ranging.
You can also use the control line to tell whether the market is trending or not, with a bull/bear line above the control line telling the market is trending.
Spotting Divergences With The PBBO
Spotting divergences is a simple way to detect potential reversals, and it was important for me to start working on an indicator able to detect them while trying to make everything super simple for the user.
With the PBBO you don't need to look at both the price and oscillator lines in order to detect divergences, you can simply look at the peaks made by the bull or bear line, if a peak is lower than a previous one, then a reversal might occur.
Above, we can see that the bull line made several peaks during the up-trend, with the last peak being lower than the previous one, we thus detect a bearish divergence and could expect a reversal. If the same case scenario occur but with peaks made by the bearish line then we detected a bullish divergence.
It can be difficult to tell whether a divergence is significant or not, it can also be hard for beginners to tell which peaks they must look at. A good rule of thumb would be to check if both peaks are coming from two different movements, this is done by seeing if the first peak has reached 0 before the second one occurred.
The control line is also useful to tell when peaks are significant or not, with peaks that are higher than the control line being more significant.
Alerts
By default, a buy alert is given once the bull line is greater than the bear line, and vice versa for a sell alert, the setting "Filter Alerts Based On The Control Line" allows you to only have an alert when the bull/bear line is greater than the control line.
Gaining Access To The Indicator
Only my Patrons can get access to this indicator, you can go to my Patreon page by clicking on the link in my signature. Note that you will also have access to the Patreon trailing stop and Patreon moving average.

Donchian WicksNote: This script does not perform well on its own and is meant to inspire other coders, just sharing it because why not :)
The idea is simple, highest only gets calculated for green candles, lowest only gets calculated for red candles. a yellow dot gets created when a candle gets below lowest line and closes bullish, vise versa for red dots.
Hope someone can use it.

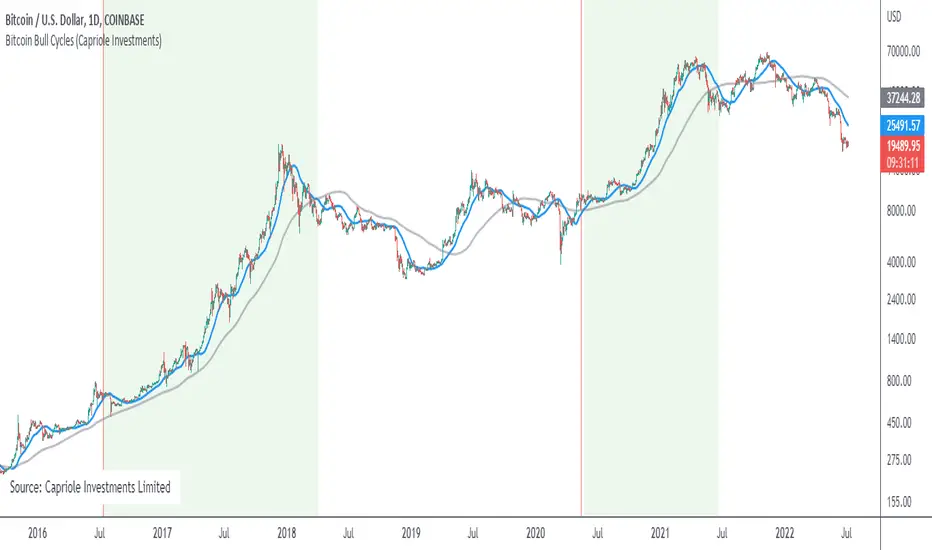
Bitcoin Bull CyclesA simple indicator that identifies the primary upswing of Bitcoin following each Halving, the "Bull Cycle".
A "Bull Cycle" is identified as the first period of positive momentum after each Halving date, defined as the 50 Daily Moving Average (DMA) being above the 200 DMA.
Bull/Bear Probability [Anan]Hello Friends,,,
===================================
This indicator is based on Bayes' Theorem and is fully based on probabilities.
===================================
Formula For Bayes' Theorem:
P(Bull|Bear) = P(Bear∣Bull) * P(Bull) / P(Bear)
where:
Bull and Bear are events and P is probability
P(Bull|Bear) is the posterior probability, the probability of Bull after taking into account Bear
P(Bear∣Bull) is the conditional probability or likelihood, the degree of belief in Bear given that proposition of Bull belief (Bull true)
P(Bull) is the prior probability, the probability of Bull belief
P(Bear) is the prior probability, the probability of Bear belief
===================================
The indicator output 2 trend lines and (Bull/Bear) Signal :
Bull/Bear Probability Trend :
when the price is above it = Up Trend
when the price is below it = Down Trend
Bull/Bear Probability Trend Moving Average :
when the price is above it = Up Trend
when the price is below it = Down Trend
(Bull/Bear) Signal :
when Probability Trend Moving Average crossover Probability Trend = Bull Signal
when Probability Trend Moving Average crossunder Probability Trend = Bear Signal
===================================
Disclaimer:
This script is for informational and educational purposes only.
Use of the script does not constitutes professional and/or financial advice.
You alone the sole responsibility of evaluating the script output and risks associated with the use of the script.
===================================
Thanks to my friends dgtrd because he inspired me about probability, take a look at his scripts.
===================================

Bullish Piercing ScannerA piercing pattern is known in technical analysis to be a potential signal for a bullish reversal. The formation in its strictest form is rather rare, but tends to perform better the longer the downtrend in front of it. When technical studies such as RSI, Stochastic or MACD are showing a bullish divergence at the same time a piercing pattern appears, it strengthens the likelihood that this two-day pattern is meaningful.
This is a two-candle pattern. The previous candle must be bearish, the recent candle must open below the close of the previous candle, the recent candle must close above the middle of the previous candle. You can adjust the closing and opening gap between the two candles within this scanner's settings (price).

Bullish-Bearish OscillatorThis is my attemption to create oscillator that will show when the market is bullish and when its bearish . Fight between those two forces will be shown on the chart.
It is based on price action versus two moving averages.
* You can choose from 4 different MAs in settings: McGinley , SMA , EMA and VWAP .
* You can set up 2 Moving Averages (fast and slow)
* Amount of bars back from PriceAction versus MAs is calculated
ps. This script is invite-only for the members of our trading group (info in signature, group is free of charge).
RSI Season Tracker by KrisWatersSeason tracker identifies the momentum with tracking dominance and market capitalization data of Bitcoin , Altcoin and USDT .
With this indicator you can able to get know about Bitcoin, Altcoin and USDT dominance and market capitalization easily.
Backgrond Color Definations:
If the background color of indicator is ORANGE means that Bitcoin dominance is the most powerful. It is a good sign for Bitcoin.
If the background color of indicator is BLUE means that Altcoin dominance is the most powerful. It is a good sign for Altcoins.
If the background color of indicator is GREEN means that USDT dominance is the most powerful. It is a good sign for USDT.
Plus Sign (+) Meaning and Color Definations:
If ORANGE plus sign is visible on indicator means that market capitalization of Bitcoin is increasing. It is a good sign for Bitcoin.
If BLUE plus sign is visible on indicator means that market capitalization of Altcoin is increasing. It is a good sign for Altcoins.
If GREEN plus sign is visible on indicator means that market capitalization of Bitcoin and Altcoins are decreasing. It is not a good sign for both.
Light and Dark RSI Line Color Definations:
If the line of Bitcoin color is Orange means that, RSI value was increased compared with previous bar. It is one of the good sign of the momentum strength.
If the line of Bitcoin color is Yellow means that, RSI value was decreased compared with previous bar. It is not a good sign.
If the line of Altcoin color is Navy means that, RSI value was increased compared with previous bar. It is one of the good sign of the momentum strength.
If the line of Altcoin color is Blue means that, RSI value was decreased compared with previous bar. It is not a good sign.
If the line of USDT color is Green means that, RSI value was increased compared with previous bar. It is one of good the sign of the momentum strength.
If the line of USDT color is Lime means that, RSI value was decreased compared with previous bar. It is not a good sign.
Simple RSI rules are valid for this indicator.
RSI value is under 30 indicates that asset is OVERSOLD .
RSI value is upper 70 indicates that asset is OVERBOUGHT .
Important Notice: Dominance data is not correlated with price. For example; sometimes dominance is increasing but the price is not. And that's where the market capitalization comes in.
If the plus sign is not visible , you can get questioning for the movement. It is not a good sign at all.
If the plus sign is visible and RSI is increasing , It is a good sign for the strength of assets movement.
I recommended to use on DAILY timeframe . But you can use different timeframes as well.
Please leave comment below If you have any question or development idea.

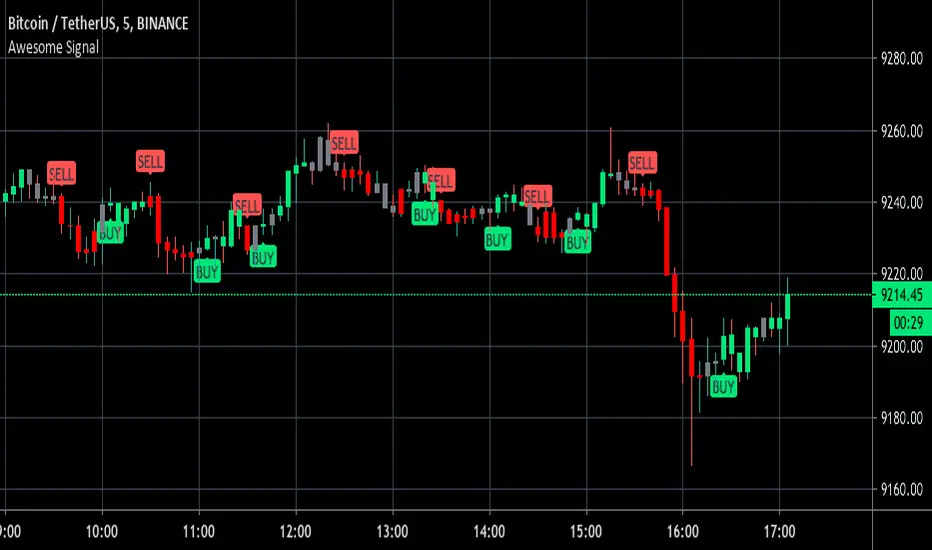
Awesome Buy/Sell SignalBuy and Sell signals using Bill William oscillators. Works for anything with high volume both crypto and stocks.
Optimal at Lower time frames and larger time frames can give you trend.
Green painted bars bullish momentum
Grey painted bars undecided momentum
Red painted bars bearish momentum.
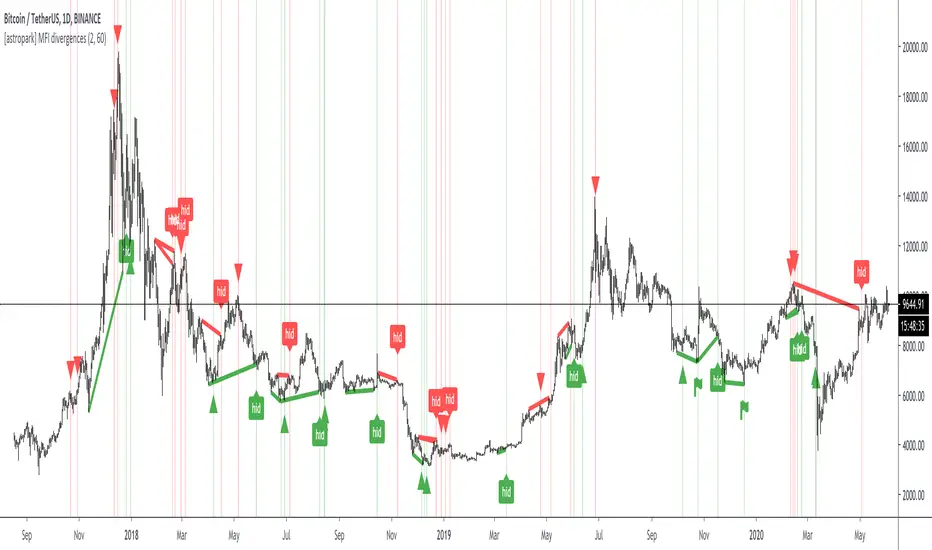
[astropark] MFI divergencesDear Followers,
today a new great Scalper Tool , based on a custom version of Money Flow (MFI) oscillator, which works on both Candlesticks, Heiking Ashi and Renko charts , from 1 second Renko chart and above (on non Renko charts, the higher, the better of course!), both on FOREX, Cryptocurrencies, Stocks and Commodities!
This tool has some cool features:
it works on all timeframes , on both Renko, Heikin Ashi and Candlesticks chart
it shows you both bullish and bearish divergences with a triangle up or down respectively
when it finds a strong bullish/bearish divergence , a flag will be displayed instead of a triangle
it shows you both hidden bullish and bearish divergences with a label "hid"
This script will let you set all notifications you may need in order to be alerted on each triggered divergence.
You may like to use it together with my Renko OBV Divergences indicator (which works on Candlesticks and Heiking Ashi too)
and my Renko RSI Divergences indicator (which works on Candlesticks and Heiking Ashi too)
On Bitmex/ByBit/Binance Bitcoin/USD chart best Renko settings is Traditional Renko chart with 11$ box size, while 0.5$ box size is suggested on Ethereum/USD pair.
This is a premium indicator , so send me a private message in order to get access to this script.
Separated ATR - evoThis script plots two ATR (Average True Range) values, one based on only bullish and the other based on only bearish bars. If the current bar is positive, the negative ATR will use its last known negative bar for the calculation. You can smooth bar directions by using the Heikin Ashi setting.
Use this the same way how you would use the regular ATR indicator, but with the added value of knowing which side of the market has more volatility.


Strategy Follow Line MTF Any MM AverageThe objective is only to evaluate different configurations of the indicator "Follow Line MTF Any MM Average".
The strategy does not have position management, it's very basic, this indicator should be used to see trend, range zones, evaluate the best areas to enter the market, use higher time frames to confirm a direction can be useful.
I do not recommend using only this indicator to trade, because you can lose all your money if you do not know what you are doing.
I hope you find it useful.
Successes
Follow Line MTF Any MM AverageThe original version uses SMA, in this new version you can choose any type of MA and time frame.
- RMA,SMA,EMA,WMA,VWMA,SMMA,KMA,TMA,HullMA,DEMA,TEMA,CTI
- 1 min, 3 min, 5 min, 15 min, 30 min, 45min, 1h, 2h, 3h, 4h, 1d, 1w, 1M
- Alerts
Combine multiple time frames, this will come in handy ¡¡¡¡
Success in your trade ¡¡¡¡
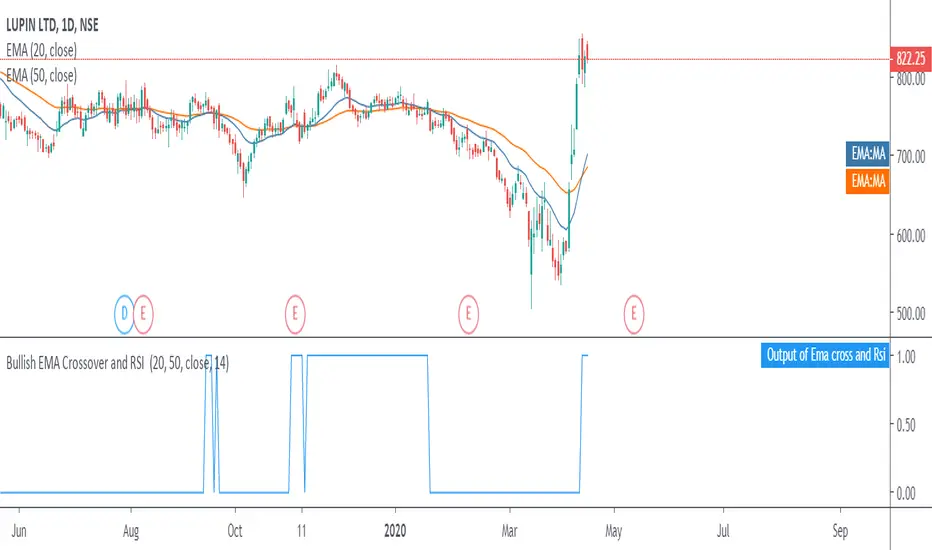
Moving Average Exponential crossover with bullish RSI signalsWhen the market is giving the signals for bullish trend, which shows the shorter period exponential(20) moving average crossing the longer period moving average(50), with a strength shown in the market i.e. RSI greater than 40.
So when all these conditions are met a buy signal is generated in output (Output of Ema cross and Rsi) having value as 1.
So a trader can enter into a long position when the value is 1 and exits a stock when value is 0.
This script is not to be used for selling the stocks in downtrend
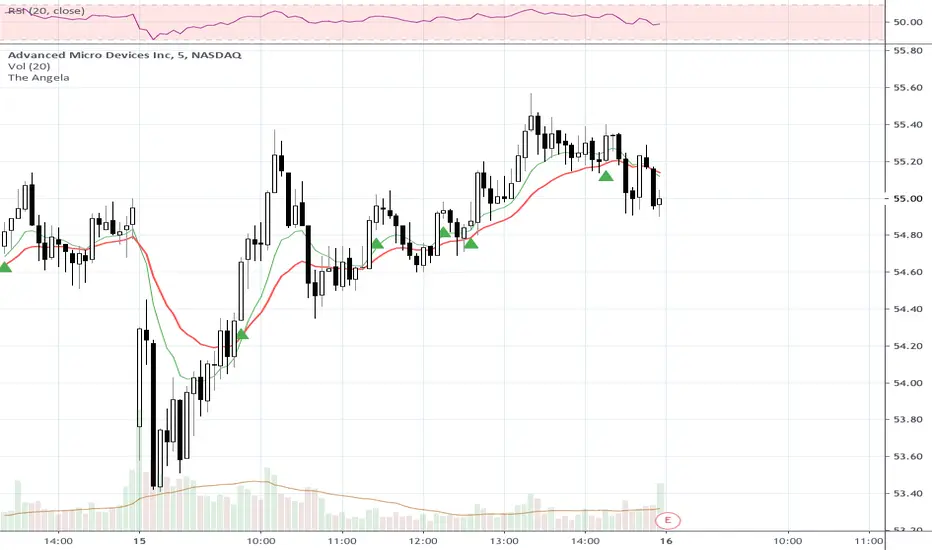
The AngelaThis script is based on Angela, an RLT trading LEGEND. The green line=10ema, red=20ema. The green triangle shows up when the buy signal is triggered. This script also has a BUY ZONE alert that can be setup as well.