Penunjuk Pine Script®
Corak Bulis

Engulfing Scanner v1This indicator helps you to quickly identify bullish and bearish engulfing patterns.
Works on currencies only (pips required).
Penunjuk Pine Script®

Penunjuk Pine Script®

Engulfing Pattern Hello Traders,
Sharing one of my favorite candlestick pattern with everyone. Feel free to use it.
Regards,
Intraday Guruji
Penunjuk Pine Script®

Sentiment Zone OscillatorHere's a (forgotten but still useful) Sentiment Zone Oscillator. The Sentiment Zone Oscillator takes a sum of positive price candles over a user-specified window length. Normally, a triple exponential moving average of the sum is used, but we opted to just go with a double EMA for the sake of more responsiveness. When the histogram is green it is bullish and red/pink means bears.
Penunjuk Pine Script®

Bilateral Stochastic Oscillator - For The Sake Of EfficiencyIntroduction
The stochastic oscillator is a feature scaling method commonly used in technical analysis, this method is the same as the running min-max normalization method except that the stochastic oscillator is in a range of (0,100) while min-max normalization is in a range of (0,1). The stochastic oscillator in itself is efficient since it tell's us when the price reached its highest/lowest or crossed this average, however there could be ways to further develop the stochastic oscillator, this is why i propose this new indicator that aim to show all the information a classical stochastic oscillator would give with some additional features.
Min-Max Derivation
The min-max normalization of the price is calculated as follow : (price - min)/(max - min) , this calculation is efficient but there is alternates forms such as :
price - (max - min) - min/(max - min)
This alternate form is the one i chosen to make the indicator except that both range (max - min) are smoothed with a simple moving average, there are also additional modifications that you can see on the code.
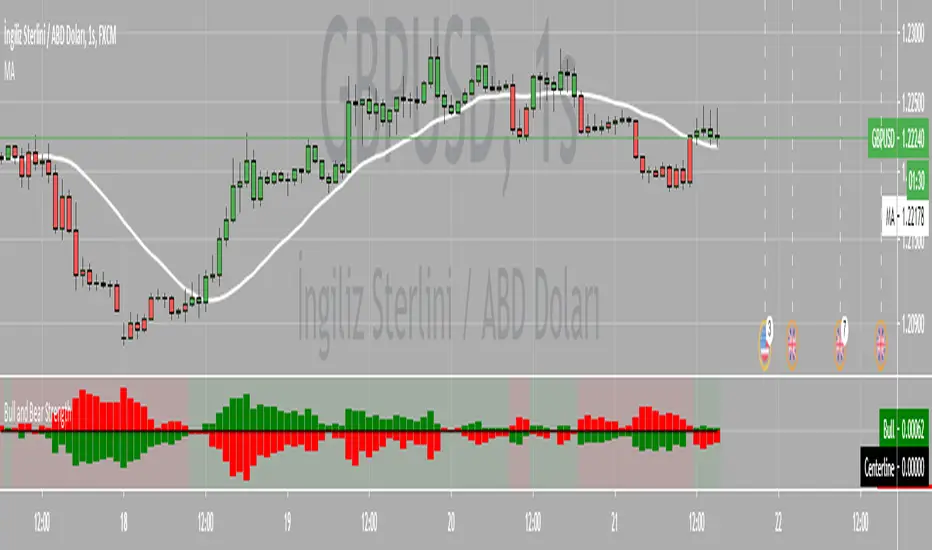
The Indicator
The indicator return two main lines, in blue the bull line who show the buying force and in red the bear line who show the selling force.
An orange line show the signal line who represent the moving average of the max(bull,bear), this line aim to show possible exit/reversals points for the current trend.
Length control the highest/lowest period as well as the smoothing amount, signal length control the moving average period of the signal line, the pre-filtering setting indicate which smoothing method will be used to smooth the input source before applying normalization.
The default pre-filtering method is the sma.
The ema method is slightly faster as you can see above.
The triangular moving average is the moving average of another moving average, the impulse response of this filter is a triangular function hence its name. This moving average is really smooth.
The lsma or least squares moving average is the fastest moving average used in this indicator, this filter try to best fit a linear function to the data in a certain window by using the least squares method.
No filtering will use the source price without prior smoothing for the indicator calculation.
Relationship With The Stochastic Oscillator
The crosses between the bull and bear line mean that the stochastic oscillator crossed the 50 level. When the Bull line is equal to 0 this mean that the stochastic oscillator is equal to 0 while a bear line equal to 0 mean a stochastic oscillator equal to 100.
The indicator and below a stochastic oscillator of both period 100
Using Levels
Unlike a stochastic oscillator who would clip at the 0 and 100 level the proposed indicator is not heavily constrained in a range like the stochastic oscillator, this mean that you can apply levels to trigger signals
Possible levels could be 1,2,3... even if the indicator rarely go over 3.
Its then possible to create strategies using such levels as support or resistance one.
Conclusion
I've showed a modified stochastic oscillator who aim to show additional information to the user while keeping all the information a classical stochastic oscillator would give. The proposed indicator is no longer constrained in an hard range and posses more liberty to exploit its scale which in return allow to create strategies based on levels.
For pinescript users what you can learn from this is that alternates forms of specific formulas can be extremely interesting to modify, changes can be really surprising so if you are feeling stuck, modifying alternates forms of know indicators can give great results, use tools such as sympy gamma to get alternates forms of formulas.
Thanks for reading !
If you are looking for something or just want to say thanks try to pm me :)
Penunjuk Pine Script®

SMA 50 collectorHello traders
The SMA 50 is known to define a trend. If price is closing above, trend is bullish, if below, trend is bearish.
That's why I like to have all of them on my chart :)
Enjoy
David
Penunjuk Pine Script®

24/9 EMA with Bias & SignalsThis is a simple indicator that plots the 24 & 9 EMAs.
It also highlights the potential bias of the market (bull or bear) based on if the 9 EMA is above or below the 24 EMA.
In addition there are signal crosses that you can use for alerts.
This indicator is best used to confirm a particular underlying bias on the 5m, 15M, 1HR, 4HR, and Daily timeframes.
It's important to note on lower timeframes that the bias can be counter trend bias of the overall larger momentum of the instrument you are trading.
For clarity this means that many retraces get going when the 9 crosses the 24. But ultimately the larger timeframe bias will continue after this counter trend retraces.
Combining this indicator with value channels and ATR is what I recommend.
Penunjuk Pine Script®

Turbo TriggerSome Words
This indicator is a collaboration between me and Himeyuri, i encourage you to check her profile and follow her www.tradingview.com
Introduction
A lot of indicators include a "trigger" line, it can be a smoothed version of another input, in this case the trigger will generate signals from his crosses with the input. The purpose of this indicator is to provide a fast trigger line to generate earlier signals as well as avoiding some whipsaw.
The Indicator
There are two lines, a bull line (blue) and the trigger (orange) , when the trigger cross over the bull line a buy signal is generated, when the trigger cross under the bull line a sell signal is generated. The trigger is made from the smoothed difference between the bull and bear line.
smooth control the smoothness of the output. The Bull/Bear Mode is an idea proposed by Himeyuri that involve plotting the bear line instead of the trigger.
Bull/Bear Mode, the lines are somewhat asymmetrical from each others.
Conclusion
We have showcased a new indicator who use a really fast trigger line to generate earlier signals, if some are way to earlier you can still increase smooth in order to correct reactivity. I hope you find a use to it.
Thanks for reading !
A big thanks to Himeyuri who is a great student and great pinescripter.
Penunjuk Pine Script®

Penunjuk Pine Script®
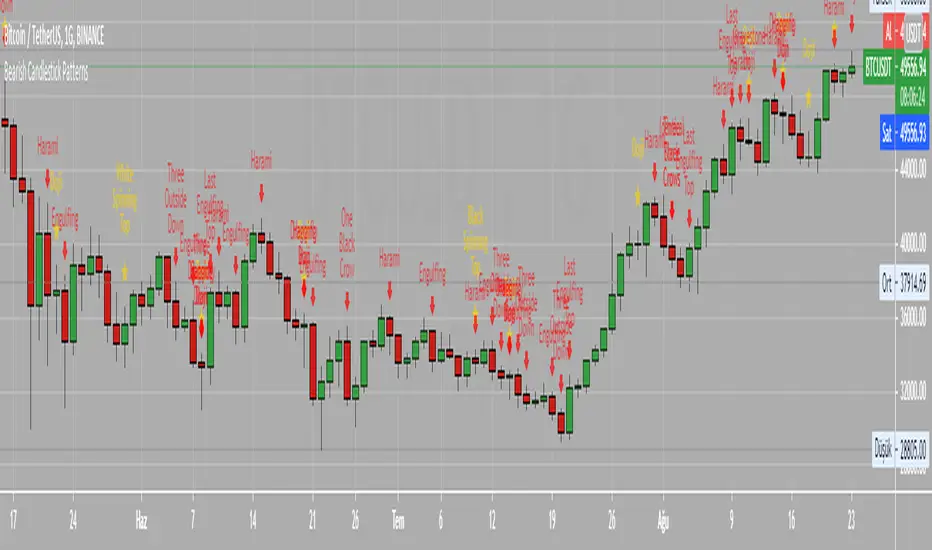
Bearish Candlestick PatternsDoji
Black Spinning Top
White Spinning Top
Bearish Abandoned Baby
Bearish Advance Block
Bearish Below The Stomach
Bearish Belt Hold
Bearish Breakaway
Bearish Counter Attack Lines
Bearish Dark Cloud Cover
Bearish Deliberation Blok
Bearish Descending Hawk
Bearish Doji Star
Bearish Downside Gap Three Methods
Bearish Downside Tasuki Gap
Bearish Dragonfly Doji
Bearish Engulfing
Bearish Evening Doji Star
Bearish Evening Star
Bearish Falling Three Methods
Bearish Falling Window
Bearish Gravestone Doji
Bearish Hanging Man
Bearish Harami
Bearish Harami Cross
Bearish Hook Reversal
Bearish Identical Three Crows
Bearish In Neck
Bearish Island Reversal
Bearish Kicking
Bearish Ladder Top
Bearish Last Engulfing Top
Bearish Low Price Gapping Play
Bearish Mat Hold
Bearish Matching High
Bearish Meeting Line
Bearish On Neck
Bearish One Black Crow
Bearish Separating Lines
Bearish Shooting Star
Bearish Side by side White Lines
Bearish Three Black Crows
Bearish Three Gap Up
Bearish Three Inside Down
Bearish Three Line Strike
Bearish Three Outside Down
Bearish Three Stars in the North
Bearish Thrusting Line During Dowtrend
Bearish Tower Top
Bearish Tristar
Bearish Tweezers Top
Bearish Two Black Gapping
Bearish Two Crows
Bearish Upside Gap Two Crows
Penunjuk Pine Script®
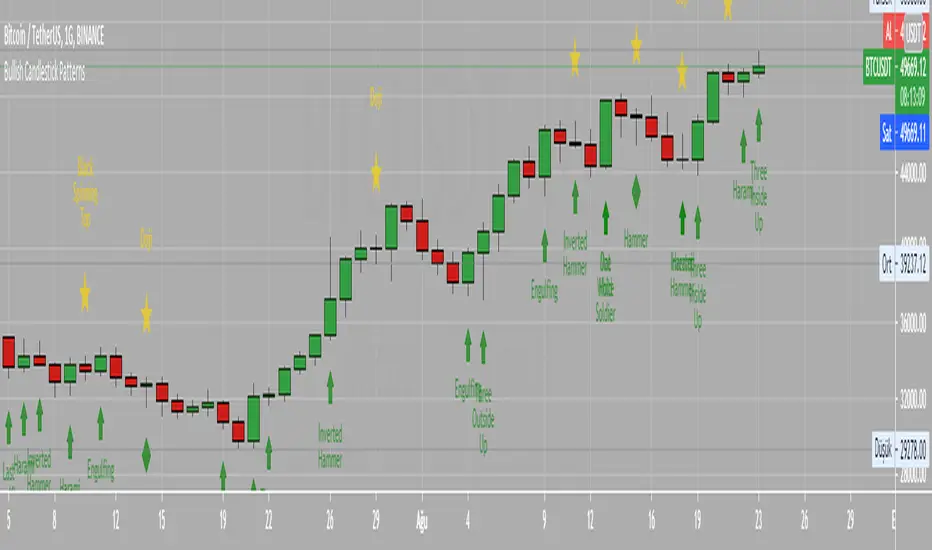
Bullish Candlestick PatternsBullish Abandone Baby
Bullish Above The Stomach
Bullish Belt Hold
Bullish Breakaway
Bullish Concealing Baby Swallow
Bullish Counterattack Lines
Bullish Deliberation Block
Bullish Descent Block
Bullish Doji Star
Bullish Downside Gap Two Rabbits
Bullish Dragonfly Doji
Bullish Engulfing
Bullish Hammer
Bullish Harami
Bullish Harami Cross
Bullish High Price Gapping Play
Bullish Homing Pigeon
Bullish Hook Reversal
Bullish Inverted Hammer
Bullish Island Reversal
Bullish Kicking
Bullish Ladder Bottom
Bullish Last Engulfing Bottom
Bullish Mat Hold
Bullish Matching Low
Bullish Meeting Line
Bullish Morning Doji Star
Bullish Morning Star
Bullish On Neck
Bullish One White Soldier
Bullish Piercing Line
Bullish Rising Three Methods
Bullish Rising Window
Bullish Separating Lines
Bullish Side by Side White Lines
Bullish Stick Sandwich
Bullish Takuri Line
Bullish Three Gap Downs
Bullish Three Inside Up
Bullish Three Line Strike
Bullish Three Outside Up
Bullish Three Stars in the South
Bullish Three White Soldiers
Bullish Thrusting Line During Uptrend
Bullish Tower Bottom
Bullish Tristar
Bullish Tweezers Bottom
Bullish Two Rabbits
Bullish Unique Three River Bottom
Bullish Upside Gap Three Methods
Bullish Upside Tasuki Gap
Penunjuk Pine Script®
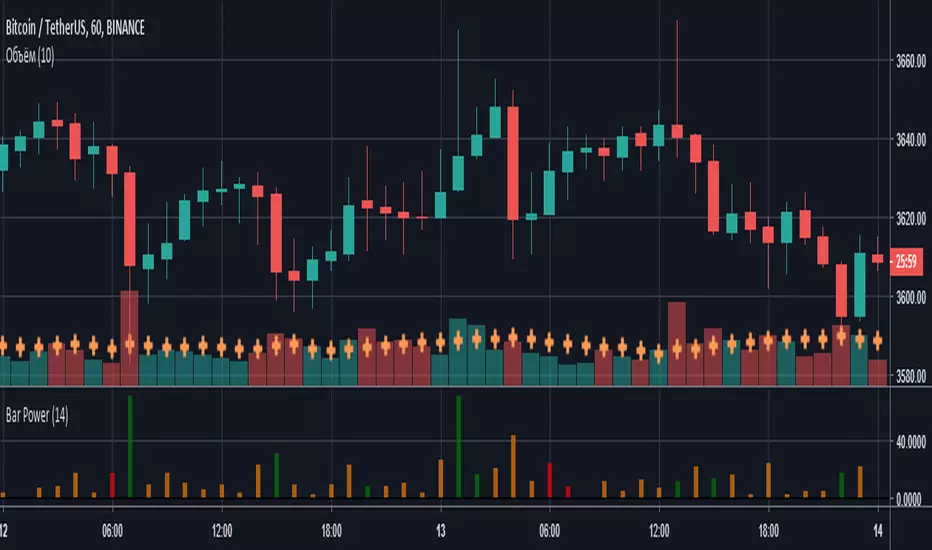
Bar PowerВысота столбцов характеризует силу (то, на сколько быки/медведи были активнее) сформированной свечи, а цвет - количество затраченной на это энергии (объем).
- Красный - маленький объем;
- Оранжевый - средний объем;
- Зеленый - высокий объем.
Penunjuk Pine Script®
BH - Candlestick Pattern DetectionThis is a script to help the beginners locate the candle patterns. It has a nice code that can be used in other scripts too. Easy to use with separated functions, simple patterns and complex patterns detections.
I have done some updates at the Candlestick Patterns Identified script by @repo32. Was a good start of my ideia. Tks for sharing repo.
It will be always under constant development but I want to share this first version to know what can be done to get better, improve, get more desired patterns, know what are you guys using that could be helpful.
I still need to check if all patterns are correct.
Any comments, help and suggestions will be appreciated.
Marcos Issler @ Isslerman
Penunjuk Pine Script®

Bitfinex Sentiment Index [Long-Short]BSI provides two attractive graphs that breakdown the long (green area) and short (red area) positions ratio for the all Bitfinex margin cryptocurrency pairs only .
It is a quantitative measure of the bullishness or bearishness that can be used as a trading rule or in a trading system entries or exits. Included slow stochastic oscillator.
Penunjuk Pine Script®

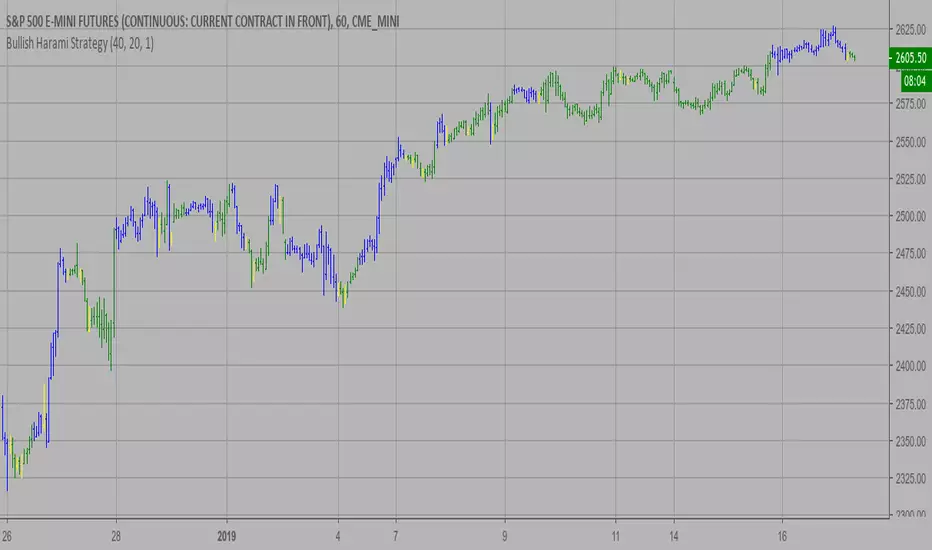
Bullish Harami Strategy This is a bullish reversal pattern formed by two candlesticks in which a small
real body is contained within the prior session's unusually large real body.
Usually the second real body is the opposite color of the first real body.
The Harami pattern is the reverse of the Engulfing pattern.
WARNING:
- This script to change bars colors.
Penunjuk Pine Script®
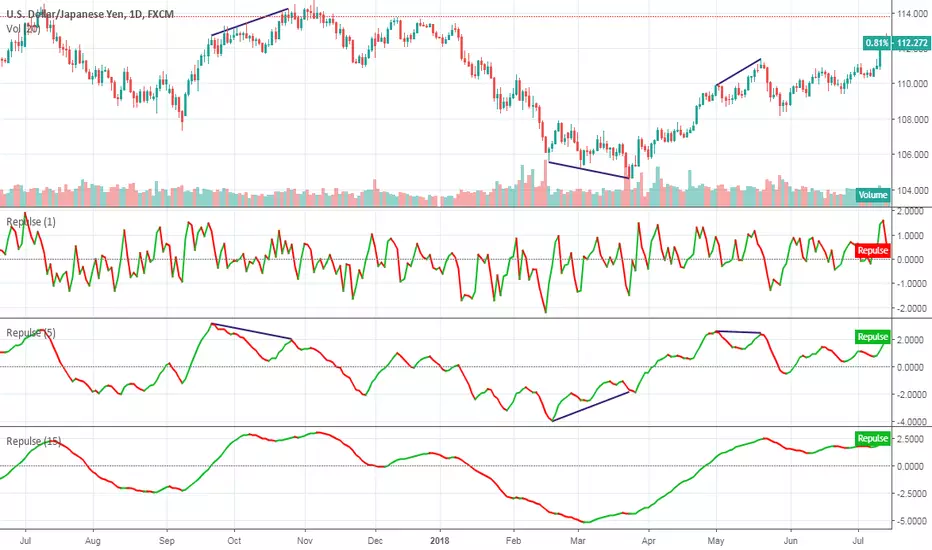
RepulseThis indicator was originally developed by Eric Lefort, a professional trader and author from France.
It gauges and displays the bullish or bearish pressure.
Like and follow for more open source indicators!
Happy Trading!
Penunjuk Pine Script®
Bullish Engulfing Strategy This is a bullish reversal pattern formed by two candlesticks. Following a downtrend,
the first candlestick is a down candlestick which is followed by an up candlestick
which has a long real body that engulfs or contains the real body of the prior bar.
The Engulfing pattern is the reverse of the Harami pattern.
WARNING:
- This script to change bars colors.
Penunjuk Pine Script®

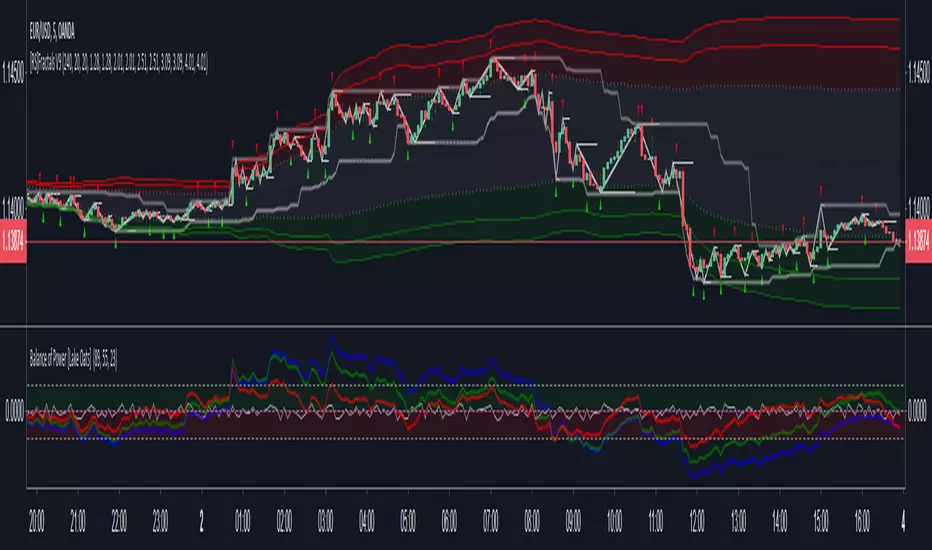
Balance of Power [Lake Oats] Balance of Power indicator - Useful tool for finding great Timing upon Entering Postions and Existing Postions, Also Useful for finding Normal and Hidden Divergences
Penunjuk Pine Script®
Buying with momentumThis is a beginner script, any feedback is welcome.
It indicates a bull trend with or without volume (yellow and green arrow) and give a buy signal (green flag) once the trend is "confirmed" and the stock became good for the buy market.
I look forward to make this for a bear market as well, but it's not good for now.
Symbols and its meanings:
Yellow Arrows --> When the EMA of 9 candles and the MA of 21 candles are higher then the previous candle.
Green Arrows --> When the EMA of 9 candles and the MA of 21 candles are higher then the previous candle and the volume is higher than the MA of 21 candles.
Green Flag --> The previous candles has a green arrow and the running candle reaches the previous candle high + 1 point/cent.
Penunjuk Pine Script®

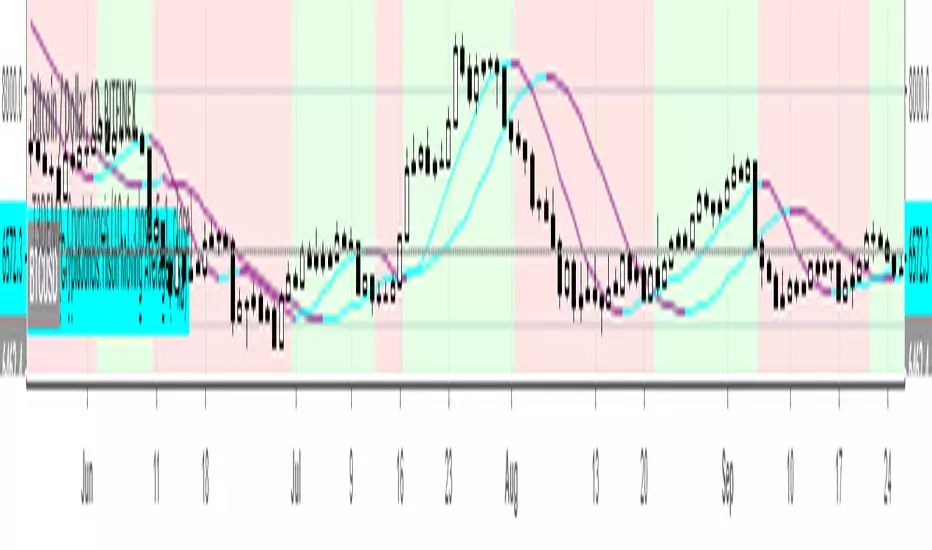
T3DMA Trend DirectionI am using T3 moving averages to generate the idea of what kind of bias I should take in a current market.
So, how does this works?
When the close is higher than T3EMA10, the trend direction is upwards,
When the close is lower than T3EMA10, the trend direction is downward.
Using this, we can assume that there is higher probability for market to continue it's trend up or down, hence trade only in that direction. T3EMA5 is used to exit any open positions before trend changes it's direction.
Have a nice day trading and enjoy.
Penunjuk Pine Script®
Penunjuk Pine Script®

EnaCrypto / MA50-EMA144-MA200// Special Thanks to EnaCrypto. This is his idea on bullish graphs.
// How to understand if the graph is bullish?
// 1.MA50 must be at top.
// 2.MA200 must be at the bottom.
// Strategy
// In 4H Graph when the MA50-EMA144-MA200 is int he right order, sell if the price is below MA50. Otherwise hodl.
Penunjuk Pine Script®
