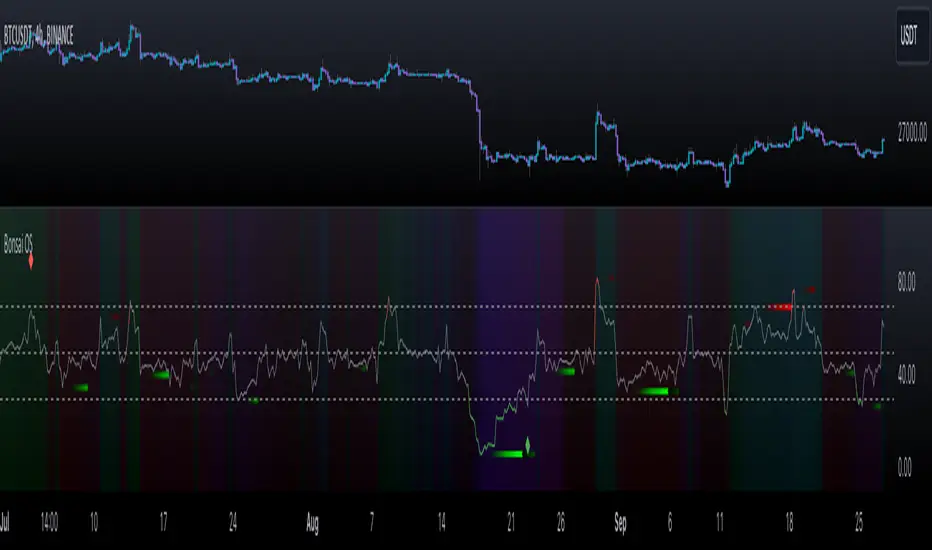
Bonsai OS (Oscillators)Bonsai OS combines four oscillators (RSI, CCI, Stochastic, MACD) in one interface. Features divergence detection, color-intensity, and insights into divergences. Assists traders in spotting potential pivot points.
═════════════════════════════════════════════════════════════════════════
🌳 Bonsai OS 🌳 Advanced Oscillator Suite
📘 Overview
Bonsai OS is a tool tailored for traders focusing on reversal strategies and those keen on identifying market divergences. Combining multiple oscillators into one unified interface, it aids traders in pinpointing potential pivot reversal points.
📌 Algorithm Logic
• Multi-Oscillator Integration: Bonsai OS calculates and integrates the values from four standard oscillators: RSI, CCI, Stochastic, and MACD. Each oscillator's value is derived from its respective mathematical formula, analyzing historical data points.
• Divergence Detection: The tool runs a series of comparisons between price action and oscillator values. When discrepancies (divergences) are observed, they are highlighted, suggesting potential market reversals.
• Price Strength Visualization: A gradient background that is determined by an average of the oscillator values in relation to their historical norms, thereby providing a visual cue about the current price strength, whether it is strong or weak.
• Alerts: Users can set up notifications based on specific divergence insights. Once set criteria are met, alerts are triggered.
🎯 Purpose
• For Professionals: Bonsai OS offers integrated oscillator readings, allowing a more in-depth market analysis.
• For Beginners: Simplified readings and visual cues make it easier for newcomers to understand oscillator indicators and market conditions.
🛠 Distinctive Elements
• Oscillator Fusion: Bonsai OS goes beyond just grouping oscillators. It looks for matching divergences across them, aiming to find stronger signals for market reversals.
• Divergence Indicators: Bonsai OS identifies divergence patterns between price trends and oscillator readings, highlighting their intensity with color variations.
• Insight into Failed Divergences: Recognizing not all divergences lead to reversals, Bonsai OS provides markers for potential false signals, helping traders exercise caution and fine-tune their strategies.
Getting Bullish/Bearish and Divergences
📊 Features
• Data Source Customization: Users have the flexibility to choose between default data inputs or adjust to their preferred price points (like High & Low).
• Combined Divergence Signals: Beyond individual oscillator divergences, Bonsai OS identifies instances when several oscillators indicate divergence at the same time.
• Adaptable Outputs: Outputs like 'Bullish Divergence ▲', 'Getting Bullish ▲', 'Getting Bearish ▼' and 'Bearish Divergence ▼' are plotted as non-displayable 1 or 0 for seamless integration into other custom indicators, ensuring a harmonious integration.
Here's an example of a custom indicator that can be used for inputting data from external sources:
//@version=5
indicator("My Script Template", overlay = true)
group_name = "External Source"
external = input.source(title = "Source", defval = close, inline = "external", group = group_name)
val = input.int(title = ">", defval = 0, inline = "external", group = group_name)
// Your logic follows here...
Bonsai OS as External Source
🎛 How To Use Bonsai OS
1. Select the desired oscillator.
2. Monitor the color changes for market condition insights.
3. Look out for divergence markers to anticipate potential market shifts.
4. If required, set up alerts for real-time updates.
Indicator Settings Menu
📜 Feedback & Continual Development
We welcome your feedback. It's essential for the continuous improvement of Bonsai OS and to better serve the TradingView community.
❗️ Disclaimer
Trading involves risks. Bonsai OS aims to provide an analytical tool to support traders, but it's essential to complement its insights with other research. Always seek advice from financial professionals and trade responsibly.
Divergence Bulis
Lune Oscillator Premium⬛️ Overview
Lune Oscillator is an advanced and innovative TradingView indicator designed to enhance your market analysis. Rather than merely improving visuals or merging traditional indicators, it introduces a series of unique features, each with its unique value proposition. This script stands out due to its originality, and the significant utility it brings to traders.
🟦 Features
Oscillator features an assortment of sophisticated tools aimed at refining your trading strategies:
🔹 Trend Oscillator: This feature integrates market trend and momentum analysis into one dynamic oscillator. It's designed to facilitate market trend and momentum analysis, and is invaluable to traders as it combines both trend and momentum analysis into one tool. For instance, if a ticker shows signs of slowing momentum after a recent rally, the Trend Oscillator could predict a potential trend reversal. The Trend Oscillator’s sensitivity and velocity settings can be tailored to suit your trading style and strategy. It is developed using a custom formula similar to WaveTrend but optimized for better detection of trend and momentum shifts.
🔹 Market Peak: Market Peak identifies potential market peaks and troughs using a percentile-based system. It's aimed at detecting overextensions in the Trend Oscillator, indicating potential market reversals. Compact and user-friendly, this feature signals potential trade exit points in case of an impending market reversal. Its sensitivity can be adjusted to react to either short-term or long-term market changes. By analyzing the market's average move, it detects overbought or oversold conditions when the percentage gets too extreme.
🔹 Money Pulse: The Money Pulse feature serves as a radar for money inflow or outflow, helping users detect nascent trends and reversals. It enables traders to spot early opportunities and reversals and align their strategies with institutional and large players. For example, a bullish Money Pulse during market consolidation could signal money influx and the beginning of an accumulation phase. The sensitivity of the Market Pulse can be adapted to short-term or long-term changes. This feature employs an improved version of the Money Flow concept.
🔹 Liquidity Pulse: Liquidity Pulse provides a unique perspective of asset liquidity by tracking market inflow and outflow volumes. It assists traders in understanding the market's liquidity sentiment, which is particularly useful for long-term trades and confluence. For instance, a bullish Liquidity Pulse could signal abundant liquidity, potentially driving up the price. The sensitivity setting can be adjusted for short-term or long-term liquidity changes. This feature utilizes an enhanced version of the On-Balance Volume concept.
🔹 Institutional Wave: This feature tracks the cumulative inflow and outflow for a specific ticker, helping traders monitor institutional money flows. It enables the analysis of a ticker's accumulation and distribution, assisting in detecting early trade entries and avoiding dumps. For example, a decrease in volume during consolidation after a price rally could indicate sell-off and potential price drop. The Institutional Wave's sensitivity can be adapted to either short-term or long-term changes. It operates on the Accumulation and Distribution concept.
🔹 Power Wave: The Power Wave evaluates market strength and momentum, indicating market power shifts. It helps traders understand the true power behind a market move. For instance, a decreasing Power Wave during a bullish move could indicate a weakening trend, suggesting a bearish strategy instead. The sensitivity of the Power Wave can be set for short-term or long-term market changes. The Power Wave calculates market strength by evaluating price change volatility.
🔹 Market Pressure: This feature detects shifts in buy and sell pressure, signaling potential turning points. It helps traders understand the power balance in the market. For example, a bullish Market Pressure shift during a short trade could suggest a momentum gain by bulls, indicating a trade exit. The Market Pressure's sensitivity can be adjusted for short-term or long-term changes. This feature uses volume data and moving averages to detect market pressure shifts, filtering out false and volatile signals.
🔹 Oscillator Copilot: Incorporating Smart Bias and Reversal Radar, the Oscillator Copilot helps identify market trends and potential reversals. It searches for confluence within multiple Oscillator features, providing a straightforward assistive tool. For example, a bullish Smart Bias signal during a long trade could suggest staying in the trade longer, while a bearish Reversal Radar signal could indicate the need to exit the trade.
🔹 Divergence Detection: This feature offers a sophisticated detection system for both regular and hidden market divergences, providing additional confluence and highlighting hard-to-detect divergences. For instance, a bullish Regular Divergence could signal a potential trade entry or exit depending on your overall market sentiment and bias. This feature uses fractals to effectively detect divergences in the market based on the Trend Oscillator.
🔹 Color Themes: Personalize your charting experience with various color themes. This feature enhances the visual appeal of your chart, offering easy setup and use. For example, use the “Ice” theme for a unique and colorful experience or the “Dark” theme for a more subdued look. Themes available include Default, Light, Dark, and Ice. This feature modifies the colors of your candles and features based on the selected theme.
These features and tools collectively offer a comprehensive solution for traders to understand and navigate the financial markets. It's important to remember that they are designed to assist in making informed trading decisions and should be used as part of a balanced trading strategy.
🟧 Usage
Lune Oscillator's features are designed to be both standalone tools and components of a larger, integrated trading strategy. It is important to understand each feature and experiment with different configurations to best suit your unique trading needs.
🔸 Example #1: The following demonstrates how the Oscillator Copilot can be an excellent trade assistant.
The Oscillator Copilot leverages multiple Lune Oscillator features, allowing traders to quickly assess overall market sentiment. It uses Smart Bias and Reversal Radar tools to deliver these insights. For instance, at point 1, a bullish Smart Bias (denoted by a green circle) represents a collective bullish sentiment from multiple components of Lune Oscillator, often leading to a price increase. Conversely, at point 2, we identify two bearish reversal signals from the Reversal Radar (highlighted by red triangles). This convergence of bearish signals from multiple components hints at a potential market reversal, often followed by a gradual price decline.
🔸 Example #2: This example shows how the Market Peak feature can aid in detecting potential market tops and bottoms.
Market Peak calculates how overbought or oversold a ticker is using a percentile system, offering insights into potential reversals. At points 1 and 2, we observe bearish Market Peaks suggesting overbought conditions and indicating a possible shift in trend. Subsequent to these peaks, we witness a price drop, mirroring the overbought market conditions. In contrast, at point 3, a bullish Market Peak suggests an oversold market, indicating a potential trend reversal and subsequent price increase.
🔸 Example #3: This is an example of how combining various features such as the Money Pulse, Liquidity Pulse, Institutional Wave, and Market Peak, can help make more informed trades.
Money Pulse and Liquidity Pulse provide insights into the money and liquidity flow in the market, respectively, while the Institutional Wave monitors the cumulative volume shifts and changes. Together with Market Peak, they offer a comprehensive view of the market's state.
At point 1, the positive Liquidity Wave (crossing above 0) suggests a bullish market volume. At point 2, a bullish Market Pressure indicates an increase in buying pressure, reinforcing the bullish sentiment. At point 3, a negative Liquidity Wave (crossing below 0) indicates a bearish sentiment, suggesting that market participants are exiting their positions. The concurrent Market Pressure hints at an increase in selling activity. Taking all these factors into account provides a strong indicator that the market sentiment has turned bearish.
🟥 Conclusion
Lune Oscillator aims to provide a suite of tools that bring unique value to traders. Each feature is designed to offer different, yet complementary, perspectives on the market, allowing users to piece together a more comprehensive understanding of their trading environment.
🔻 Access
You can see the Author's instructions below to get instant access to this indicator & our Premium Suite.
🔻 Disclaimer
Lune Oscillator is a tool for aiding in market analysis and is not a guarantee of future market performance or individual trading success. We strongly recommend that users combine our tool with their trading strategies and do their due diligence before making any trading decisions.
Remember, past performance is not indicative of future results. Please trade responsibly.

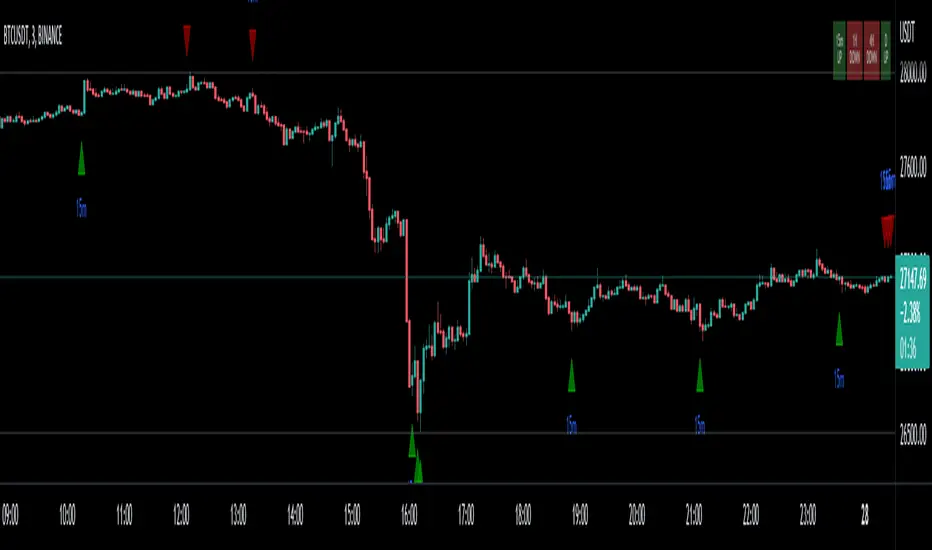
Steel Step Assistant: Trend Visualizer + Divergence Signal 1.0Disclaimer: Nobody should use this indicator as a confirmation signal for entry/exit for your trades. Please message me on how to use this indicator correctly. This indicator was designed to be used in conjunction with my Steel Step strategy, hence the name.
This indicator simply gives you a signal of trend reversals.
The trend visualizer is an ordinary table that shows you the trends of different time frames.
The signal is designed with the Steel Step strategy for determining the more important reversals/pivots.
Being an indicator, it is prone to a certain extent of inaccuracy. It is programmed to provide an accurate market trend reversal to the best of its abilities.
Always remember that the Steel Step strategy does not rely on indicators to trade.
This indicator can be used on all charts and markets; crypto, commodities, forex, stock, indices, etc.
It is suitable for intra-day traders. Another version with all time frames is being made as I publish this.
One way of using this is to enhance your information gathering on trends in order to understand the market structure or direction better.
This indicator helps educate users on the market structure. Users can quickly break down the market into layers, analyze the layers and connect them all to understand the market as a whole. After users understand the market, users need to decide and choose a specific trend they want to trade. The basic idea is to flow with the market.
This indicator can be combined with EW theory to understand the market structure easily.
When I understand the whole market structure, it boosts my trading performance to the maximum.
The user inputs (settings) should be very straightforward. The default settings produce directions that are very similar to what I use for my strategy. You can change the settings as desired.
The default settings are configured to show you the trend reversal or market direction of "one layer" above "the current time frame layer". You can find educational materials about the layer logic from my Steel Step strategy.
Find the instructions on how to view signals below.
***SIGNAL GUIDE***
To view signals/set signal alerts:
- To view 15min signals, use 3min chart
- To view 1H signals, use 15min chart
A second version to include more time frames and trends will be published soon. Look forward to it!
Please comment below or message me if you have any questions. Enjoy!
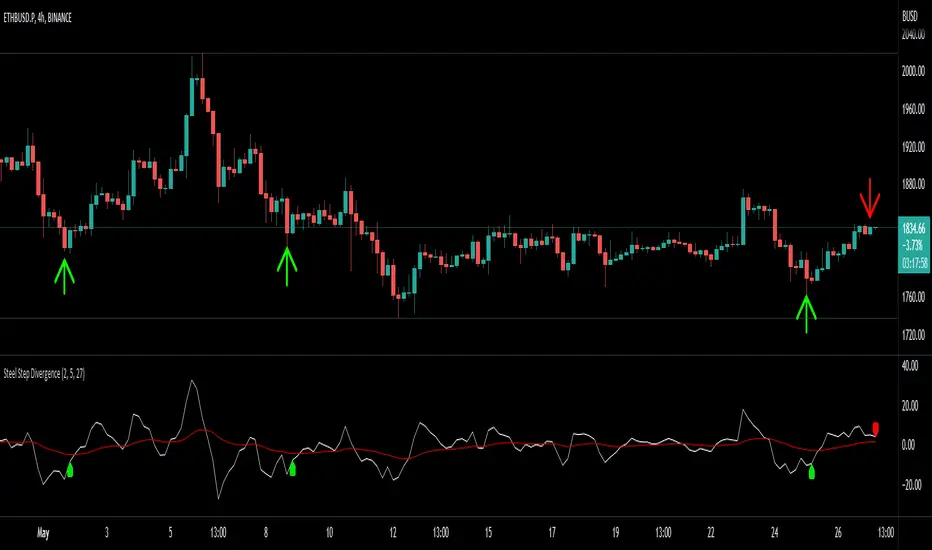
Steel Step Assistant: Divergence IndicatorDisclaimer: Nobody should use this indicator as a confirmation signal for entry/exit for your trades. Please message me on how to use this indicator correctly. This indicator was designed to be used in conjunction with my Steel Step strategy, hence the name.
This indicator simply gives you a signal of a trend reversal.
The default settings produce directions that are very similar to what I use for my strategy. You can change the settings as desired.
The user inputs (settings) should be very straightforward. Length is the distance you want to compare the price.
This indicator can be used on all charts and markets; crypto, commodities, forex, stock, indices, etc.
It is suitable for intra-day traders, as well as HTF traders.
The default settings are configured to show you the trend reversal or market direction of "one layer" above "the current time frame layer". You can find educational materials about the layer logic from my Steel Step strategy.
One way of using this is to enhance your information gathering on trends in order to understand the market structure or direction better.
This indicator educates users on the market structure. Users can quickly break down the market into layers, analyze the layers and connect them all to understand the market as a whole. After users understand the market, users need to decide and choose a specific trend they want to trade. The basic idea is to flow with the market.
This indicator can be combined with EW theory to understand the market structure easily.
When I understand the whole market structure, it boosts my trading performance to the maximum.
Please comment below or message me if you have any questions. Enjoy!
Divergence Indicator Screener [Trading Solutions]It's been a while since the last publication on the platform. We've been studying the charts and developing some interesting strategies and indicators, so we'll be posting some ideas in the near future.
Overview
This indicator allows you to find divergences between the price action and the classic RSI. It has the ability to anticipate trend changes.
Highs and Lows are determined using Pivot Points, wich can be adjusted in settings.
You can use this indicator to find two kind of divergences, Regular and Hidden:
Regular is when price makes a higher high, but the RSI makes a lower high
Hidden is when price makes a lower high, but the RSI makes a higher high
The opposite case for Bearish Divergence
The most important functionality of this indicator is that we can be alerted when a divergence occurs in different trading pairs, without the necessity of checking different charts at the same time, and seize opportunities offered by the market. You only have to go to Alerts Tab , click on Create Alert , select Divergence Indicator Screener and wait for the Notification in your favorite device.
You can choose any ticker to be plotted on chart and even add a new one.
Settings
To get everything started with this indicator, here are the different inputs:
RSI Settings: Period y Source
Pivot Point: Left and Right lookback bars
Filter Divergences: Regular and Hidden and max and min distance from the pivot points to consider a valid divergence
Draw table and Filter how much bars to look for a divergence in the past and plot it in the table: The fewer bars, less divergences shown
We hope you can take the most of this tool, and helps improve your day to day trading. Feel free to comment and make suggestions. We will be updating soon

Ultimate Bullish Divergence for RSI MFI RVSI OBV w/ Buy SignalsThis strategy is based on the Indicator below and includes all of its features.
This version Includes the Strategy tester and a dynamic SL
The only drawdown of this version is that Alerts are not as customizable
Ultimate Bullish Divergence for RSI OBV RVSI MFI w/ Buy Alerts

Ultimate Bullish Divergence for RSI OBV RVSI MFI w/ Buy AlertsThis Indicator detects Divergence based on multiple Pivot points instead of just one.
- You can detect divergence on these Oscillators:
- RSI, RVSI, MFI, TRIX RSI, OBV and more soon
You can detect bullish and hidden bullish divergence:
- bullish divergence: Oscillator makes a higher low while price is making a lower low
- hidden bullish divergence: Oscillator makes a lower low while price is making a higher low
ranges where it should look for Divergence:
- To reduce false positives you are able to define and combine the following ranges:
- Manual Ranges: you’re able to type in the ranges that you came up with your manual technical analysis
- Auto Fib Ranges: option to only look for divergence below/above/within multiple Fibonacci levels
- Oversold limit: option to only look for divergence below a certain Oscillator Level
- EMA Ranges: Only look for divergence if below/above/within certain EMA's
- VWAP Ranges: option to only look for divergence below/above/within VWAP levels
Multiple options of waiting for confirmation:
- Waiting for X candle closes
- Wait for a price bounce
- Wait for an Oscillator to Oscillator EMA cross
- Wait for EMA cross (coming soon)
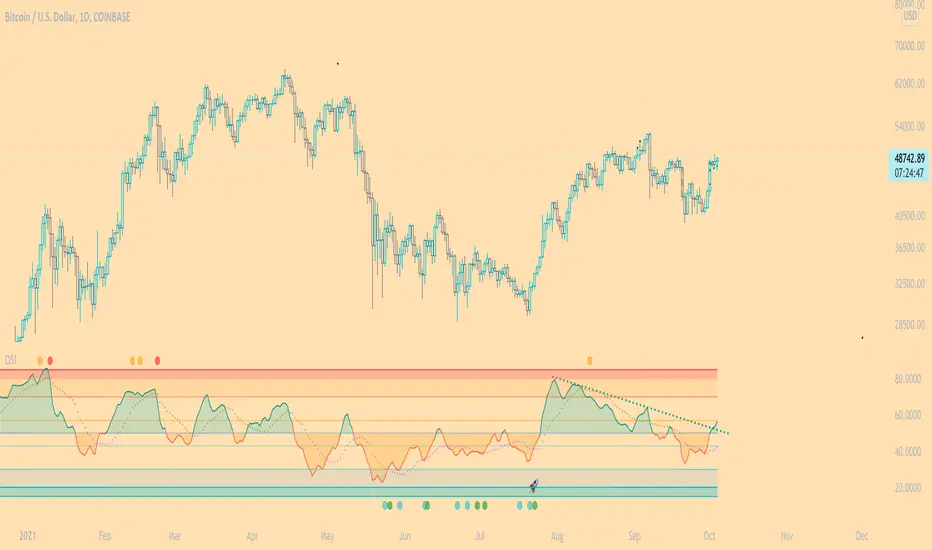
DSI - Dynamic Strength Index The DSI is a volume weighted momentum indicator similar but superior to the traditional RSI.
The DSI algorithm takes values for RSI, MFI, OBV and stochastics, then gives them each a different weighting depending on their historic reliability in different market conditions, and then averages out the values.
This results in a very reliable, noise-free momentum indicator, especially reliable on high timeframes.
Further features include:
Auto Trendlines - Up-downtrend lines to show support, resistance and breakouts
Supertrend- A momentum (ATR based) version of the Supertrend.
Divergences - Bullish and bearish momentum divergences, with confirmation signals.
General Rules:
Bullish above 50
Bearish below 50
Enjoy!
MM
[astropark] Cumulative Volume Delta (CVD)Dear Followers,
today another awesome Analysis Tool, that you can use in your trading journey: Cumulative Volume Delta (CVD) , also known as Cumulative Delta Volume (CDV)!
Volume says a lot about price action:
price drops with low volume? or price pumps but no volume increase?
big sellers volume but price does not drop? or big buyers volume but price does not increase?
The Cumulative Volume Delta measures the effectiveness of buyers and sellers' actions, so basically if the volume they generate with their buy and sell market orders is effective on price or not.
When it's not effective, a divergence appears and we, as traders, can profit from it.
Here some examples how you can use the indicator by spotting divergences between price and cumulative volume delta.
EURUSD, 15m
sellers trying hard to make price fall, but volume is lacking on CVD (exhaustion): bullish divergence
EURUSD, 15m
buyers trying hard to make price go up, but volume is lacking on CVD (exhaustion): many bearish divergences
SPX500, 15m
buyers exhaustion: bearish divergence
XAUUSD, 15m
sellers exhaustion: bullish divergences
XAGUSD, 15m
buyers exhaustion: bearish divergence
BTCUSD, 15m
buyers exhaustion: bearish divergence (in red)
buyers absorbed sellers' pressure: hidden bullish divergence (in green)
BTCUSD, 15m
inefficiency by buyers: higher and higher buy volume but it's not effective on price (sellers absorbed): hidden bearish divergence (in blue)
sellers exhaustion: bullish divergences (in green)
buyers exhaustion: bearish divergence (in red)
ETHBTC, 15m
buyers exhaustion: bearish divergence (in red)
inefficiency by sellers: higher and higher sell volume but it's not effective on price (buyers absorbed): hidden bullish divergence (in blue)
TSLA, 15m
inefficiency by sellers, sellers pressure absorbed by buyers: hidden bullish divergence (in blue)
buyers exhaustion: bearish divergence (in red)
sellers exhaustion: bullish divergence (in green)
inefficiency by buyers, sellers pressure absorbed by sellers: hidden bearish divergence (in fuchsia)
This indicator works on every timeframe, market and pair, by the way must be said that it works best on 15m and 5m timeframes, as you can have access to a more detailed volume information.
As I always say, all tools are great if you use them correctly: this is not the "Holy Grail", so always use proper money and risk management strategies.
This is a premium indicator , so send me a private message in order to get access to this script.

Divergence+ [MS]Divergence indicator for any asset and any time frame that shows bullish and bearish regular (dotted) and hidden (dashed) divergences.
Simple to use, just add to your chart and select the size of divergences you want to see.
Scalping? Use a lower number.
Swing trading? Use a higher number.
Set alerts on when divergences appear.
Settings
• Set the divergence size
• Show hidden divergences
• Show signals with divergences
Use the link below or PM us to obtain access to this indicator.

Divergence FinderHello Fellow Traders!
Divergence Finder is a custom script built upon request from a PRO user to help find Divergences & Hidden Divergences using OBVM & Fractal Levels of Support and Resistance along with visuals and alerts. This script also only looks at the divergences that happen with the greater macro trend, meaning price is trending above the 200 EMA of the current period.
Features
----------------------
Custom Alerts are built into the script for manual or automatic trading.
Multiple MA's to show overall trend and EMA supports for manual traders
Custom icons to indicate BULL, BEAR, HIDDEN BEAR, HIDDEN BULL --> the ghost emoji means hidden
Alerts Added for every point
Visual Entry & Exit Points for each level
Visual Trend Bands
You can get access to any of my scripts by visiting my website below , all links are down below in my signature!

inwCoin Bullish/Bearish Divergence - Risk% StrategyEnglish
=========
inwCoin RSI Bullish/ Bearish Divergence Startegy.
RSI Bullish and Bearish divergence is a popular strategy that most people use to find the "reversal pattern" and bet on it.
...But is it really profitable in long run?
To find the answer, I write this strategy to test this hypothesis and the result is interesting.
------
How it work?
------
As you know, the main logic of bullish / bearish divergence are..
Buy Signal : RSI higher low in Oversold zone and price lower low
Sell Signal : RSI lower high in Overbought zone and price lower high
I also add some parameters to my strategy
1) Use stop loss + specific stop loss level
2) lookback period = RSI / Price lookback period to find divergence
----------
The result
----------
Not working at all.
It working ok in some period of time like in sideway market
But when uptrend established, it can't make any profit ( well, it's mean reversion strategy after all haha )
Also, when market keep crashing like in Nov 2018.
This strategy got stop out so many times before you can make 1 profitable trade....
But that trade won't last long because you have to take profit when you got bearish divergence signal.
----------
Conclusion
----------
Combine with trend following strategy.
This strategy might be able to fill the gap of sideway market.
But don't depend solely on this strategy because in long run, it can't beat the market.

RSI DIVRSI divergence Detector
What is Divergence :
The word divergence itself means to separate and that is exactly what we are looking for today. Typically RSI will follow price as the EURUSD declines so will the indicator. Divergence occurs when price splits from the indicator and they begin heading in two different directions.
How to use :
Use the H Plot means Hidden divergence condition
Use the R Plot means Regular divergence condition
Red R above bar = Regular Bearish
Green R below bar = Bullish
Blue H Below bar = Hidden Bullish
Orange H above bar = Hidden Bearish

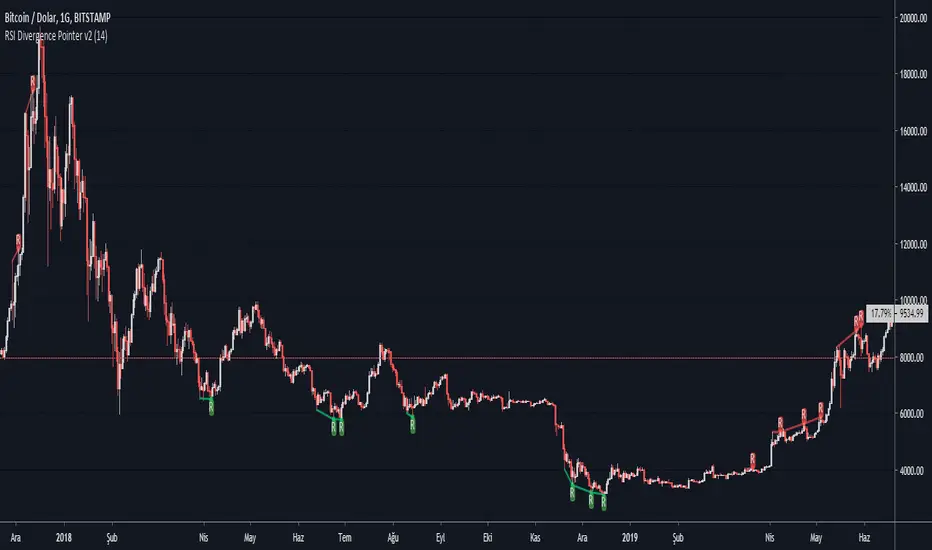
RSI Divergence Pointer v2This script points regular and optionally hidden types of bullish and bearish RSI divergences on the chart by drawing the divergence lines and optionally labels.
Hidden divergence is disabled by default, it can be enabled over settings window.
There is an option to display the price channel additionally.
Added alerts for 4 types of divergences
Titles and messages are the same:
"Regular Bearish Divergence"
"Regular Bullish Divergence"
"Hidden Bearish Divergence"
"Hidden Bullish Divergence"
BOSS Relative Strength MeterTHE BEST FOREX, STOCKS, COMMODITIES , AND CRYPTO INDICATORS FOR TRADINGVIEW.COM
The relative strength meter (RSM) is a momentum indicator that measures the magnitude of recent price changes to evaluate overbought or oversold conditions in the price of a stock or other asset.
The RSM is displayed as a color coded meter.
GREEN: Bullish Uptrend
RED: Bearish Downtrend
YELLOW: Disbursement
Highlights:
Add to any chart or time frame
Prints on the current bar in real time
DOES NOT repaint several bars after the fact
Freedom to Tune
User can change colors
Available Here: bosscripts.com
7_Day Trial: bosscripts.com

Stoch-RSI Divergence PointerThis script points regular and optionally hidden types of bullish and bearish Stoch-RSI divergences on the chart by drawing the divergence lines and optionally labels.
Hidden divergence is disabled by default, it can be enabled over settings window.
Regular divergence is enabled by default, it can be disabled over settings window.
There is an option to display the price channel additionally.
