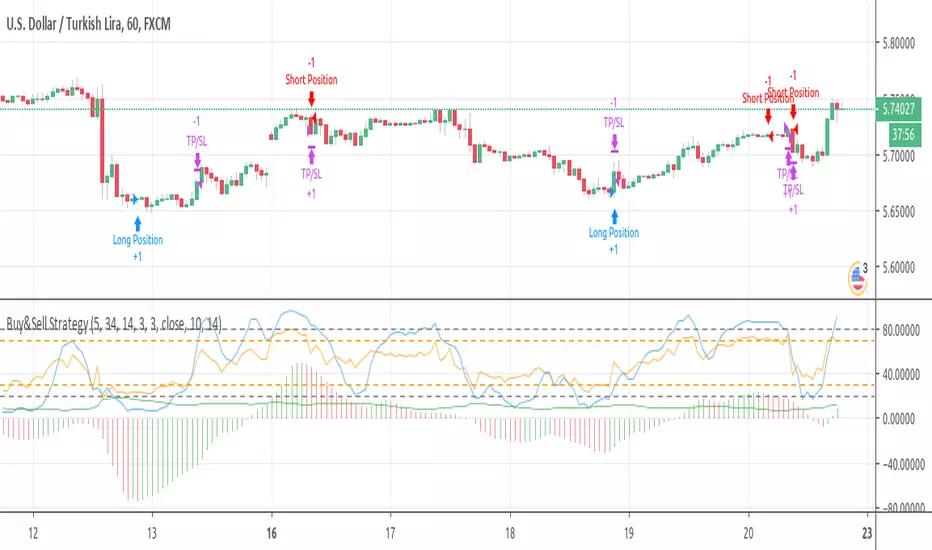
Retail Slayer StrategyRetail Slayer Strategy
Intended Markets: Forex, Indices, Cryptocurrencies, and metals (Gold, Silver)
Timeframe Use: 15 minutes only
Trailing Stop: 35-pips for Forex
The purpose of this strategy is to answer the question many retail traders have: Why does it feel like trades go against me immediately after placing a buy/sell? This strategy puts you into the position of taking trades against the majority of retail traders.
The underlying logic of this strategy involves the use of specific momentum, volatility, intra-week, and intra-day data to determine whether certain extremes that exist in common retail oscillators are truly indicative of a corrective move or a trend reversal. This strategy checks against those conditions to monitor whether certain breaks of certain price ranges are truly honest, or just fake-outs.
The 35-pip trail is intended for all of the Intended Markets listed above (ticks/points where necessary), and the 15-minute chart is also intended for all of the above-Intended Markets. There are options for you to adjust the trailing-stop, profit target, and stop(s) to fine-tune an instrument to your desired settings. However, I would recommend you stick with the 15-min, 35-pip default settings until you are more familiar with how this strategy works.
To utilize this strategy as an alert, simply add it to your chart then click on the Strategy Tester below. You will see a small alarm clock icon next to the cog-wheel - click the Alarm Icon and you can create the alert utilizing this strategy.
You will receive a notification warning you that this strategy can cause issues with repainting, and that is a known issue. However, with any strategy, it pays to confirm and do your own due diligence before committing to any trade. This strategy is intended to help identify and confirm entries in conjunction with your own analysis.
To inquire about access, please send me a PM. Please reach out if you have any questions.
Buy-sell-signal

Smart Forex Buy Sell Signal by LukasHi again!
So, this is BUY and SELL signal base on Price action, RSI, and Correlation between Forex Major Pairs.
It's only work for Forex Major Pairs because I only took their data.
Included alert : Spec, Buy, Strong
Recommended to wait for double signal :
Spec Buy > Buy or Spec Sell > Sell
Buy > Strong Buy or Sell > Strong Sell
So execute after the second signal triggered.
It's indicate the trend.
Looking forward for your feedback to improve the script.
Thank you.
It's better combine it with Moving average indicator to indicate direction, I use Moving Average Adaptive Q from cheatcountry to help me make decision.

buy/sellits a EMA crossover pls only trade if the gape between the 3 line is proper (no claims, rights reserved i am not responsible for any loss)

Theft Indicator - BUY/SELL AlertsWhat is our indicator?
Theft Indicator - Buy & Sell Alert System is our first published script that shows price action on a certain period of time (We Use ATR indicator). We take pride in enabling trading to become easier for the experienced and the non-experienced traders around the globe. Buy & Sell alerts will be fired once a conditions in our algo is met.
Does it Repaint?
Our indicator does NOT re-paint. Although while setting an alert it may pop up the repaint alert, please take into consideration that once a signal is fired on a "CLOSED BAR", our signal will never disappear, they do not repaint.
What Markets is it usable with?
You can use it in any market, Forex, Stocks, Crypto, Indices. We recommend high time frames but you can also use it on the 1 minute chart if you are a scalper and a risk taker. All time frames are profitable, not all trades. But the Majority is profitable. We will soon add a backtest strategy for it, there is no ETA on it tho.
How to use:
Simple plug and play it to your chart, in addition to a few other indicators we will recommend to you (we still have not published them yet), and this will confirm your trades. You can also connect TV alerts with a bot and let it run. Please be aware that SLIPPAGE time is important, If you run a bot on this indicator you HAVE to know that the buy/sell price will be on the bar AFTER the Candle close (For example: the BUY/SELL alert is on a candle, the buy/sell your bot or you will execute WILL be in the following candle depending on your trading system. Theft Indicator - Buy/Sell Alerts work best with higher time frames, however it works on smaller time frames, we recommend 15 mins, 30 mins, 1hr, 4hr. It just depends on your trading style. Please contact us if you do not understand how to use it.
How are the Buy/Sell Alerts fired?
We use the simple ATR (Average True Range) indicator. However we have modified the indicator to fit our trading system. Check below for a definition of what ATR is:
What is Average True Range - ATR?
The average true range (ATR) is a technical analysis indicator that measures market volatility by decomposing the entire range of an asset price for that period. Specifically, ATR is a measure of volatility introduced by market technician J. Welles Wilder Jr. The true range indicator is taken as the greatest of the following: current high less the current low; the absolute value of the current high less the previous close; and the absolute value of the current low less the previous close. The average true range is then a moving average, generally using 14 days, of the true ranges.
Why is our indicator special and different from the normal ATR indicators?
We have modified the mathematical equation and changed it slightly to give more accurate signals, we do not promise all trades are profitable, the use of this indicator is up to your own judgement and liability. We believe that we have an indicator like no other ATR because of our algo that is different from the normal ATR calculation.
P.S: This is not financial advice, we are just sharing our indicator that we know has good results, and it will take time for people in -ve profiles to recover losses and for the profiting to be more profitable.
You can contact me for more information about the indicator, Goodluck :)

[BERA] POWER STRATEGYHey below my new strategy test, hope you like.
Work better with BTC
H1 and H4 timeframe.
How this work?
RSI based script.
-Modified length and different metrics for long and short.
Moving Averages.
-RSI panel below with color labels to identify the rsi levels.
-Simple trailing stop included.
Entry orders and exit orders for both -long and -short.
The default setup is the best perfomance i've find testing it.
If you are interest in the script contact me.

AlgoNinja RSI/MACDAlgoNinja buy/sell signal based on MADC/RSI/StochRSI data. BETA - Use at your own risk!

Buy&Sell Strategy depends on AO+Stoch+RSI+ATR by SerdarYILMAZThis strategy is just for training, its purpose is just learning code in pine script.
Don't make buy or sell decision with this strategy.
Turkish/Turkce
Bu strateji sadece pine script'te kodlamanın nasıl yapildigini ogrenmek icindir.
Bu stratejiye dayanarak, kesinlikle al-sat islemleri yapmayin.
How it works?
When RSI and Stoch are in oversold area and if awesome osc. turns positive, take long position. Stop loss and take profit levels were defined with ATR ind.
When RSI and Stoch are in overbought are and if awesome osc. turns negative, take short position. Stop loss and take profit levels were defined with ATR ind.
Turkish/Turkce
RSI ve Stoch asiri satım bölgesinde iken awesome pozitife döner ise long pozisyon açar, zarar kes ve kar al seviyeleri ATR indikatoru ile tanımlandı.
RSI ve Stoch asırı alım bölgesinde iken awesome negatife döner ise short pozisyon açar, zarar kes ve kar al seviyeleri ATR indikatoru ile tanımlandı.
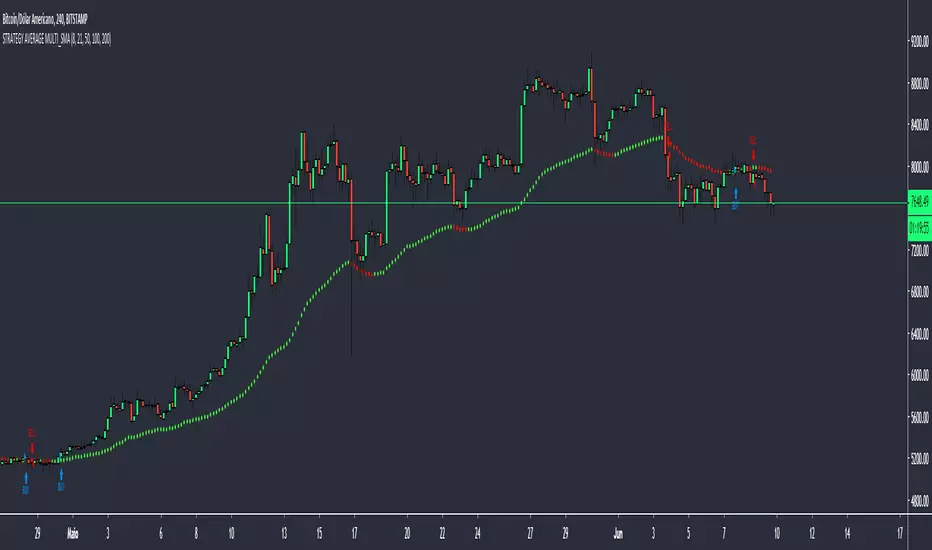
STRATEGY AVERAGE MULTI_SMAThis strategy is based on my script "AVERAGE MULTI_SMA"
The strategy is based on the created media, giving BUY signal when the price closes above the average and the average is rising. For the SELL signal the price closes below the average with the average falling.
For those who are interested in how the "AVERAGE MULTI_SMA" script works, I ask you to analyze it there, because I explain how it works.
Please do not use the indicator as the only factor to do your operations, try to use more as a study.
____PTBR_____
Essa estrategia é baseada no meu script "AVERAGE MULTI_SMA"
A estrategia é baseada na media criada, para o sinal de compra(BUY) o preço fecha acima da média e a média está subindo. Para o sinal de venda(SELL) o preço fecha abaixo da média e a média caindo.
Para quem se interessar em saber como funciona o script "AVERAGE MULTI_SMA", peço que analise ele lá, pois explico como funciona.
Peço que não use o indicador como único fator para fazer suas operações, tente usar mais como um estudo.
Multi-TF Avg BBandsMULTI-TF AVERAGE BBANDS - with signals (BETA)
Overall, it shows where the price has support and resistance, when it's breaking through, and when its relatively low/high based on the magic of standard deviation.
created by gamazama. send me a shout if u find this useful, or if you create something cool with it.
%BB: The price's position in the boilinger band is converted to a range from 0-1. The midpoint is at 0.5
Description of parameters
"BB:Window Length" is the standard BB size of 20 candles.
The indicator plots up to 7 different %BB's on different timescales
They are calculated independently of the timescale you are viewing eg 12h, 3d, 30m will be the same output
You can enter 7 timescales, eg. if you want to plot a range of bbands of the 12h up to 3d graphs, enter values between 0.5 and 3 (days) - you can also select 0 to disable and use less timescales, or select hours or minutes
Take note if you eg. double the main multiplier to 40, it is the same as doubling all your timescales
You can turn the transparency of the 7 x %BB's to 100 to hide them, their average is plotted as a thick cyan line
"Variance" is a measure of how much the 7 BB's agree, and changes colour based on the thresholds used for the strategy
---- TO START FROM SCRATCH ----
- set all except one to ZERO (0), set to 0, and everything after to 0.
Turn ON and right click -> move the indicator to a new pane - this will show you the internal workings of the indicator.
Then there is a few standard settings
"Source Smoothing Amount" applies a basic small sma on the price.
It should be turned down when viewing candles with less information, like 1D or more.
Standard BBands use an SMA, there one uses a blend between VWMA or SMA
Volume Weight settings, the same as SMA at 0, and the same as VWMA at 1
BB^2 is a bband drawn around the average %BB. Adjust the to change its window length
The BB^2 changes color when price moves up or down
Now its time to look at the parameters which affect the buy/sell signals
turn on "show signal range" - you see some red lines
buy and sell each have 4 settings
min/max variance will affect the brigtness of the signal range
range adjust will move the range up/down
mix BB^2 blends between a straight line (0) and BB^2's top or bottom (1)
a threshold of "variance" and "h/l points" is available to generate weaker signals.
these thresholds can be increased to show more weak signals
ONCE YOU ARE HAPPY WITH THE SIGNALS being generated, you can turn OFF , and move it back to the price pane
the indicator then draws a bband around the price to maps some info into the chart:
fills a colour between 0.5 & the mid BB^2 and converts relative to the price chart
draws a line in the middle of the midband.
controls how much these lines diverge from the price - adjust it to reduce noise
converts the signal range (red lines) to be relative to the price chart
if you like, you can adjust the sell & buy signals in the tab from and to and to match the picture. It messes with auto-scaling when moving back to though
enjoy, I hope that is easy enough to understand, still trying to make this more user-friendly.
If you want to send me some token of appreciation - btc: 33c2oiCW8Fnsy41Y8z2jAPzY8trnqr5cFu
I promise it will put a fat smile on my face

MM AlertThis is connected to the MM alert. This adds a buy and sell signal on the upper chart when the stock is a buy or a sell.


AutoTrader v2 by CryptoProToolsAutoTrader v2 comes with the ability to heavily customize / fine tune your Buying and Selling strategies separately.
Want to factor in RSI, LOWBB and EMAGAIN for Buys, but then only use MFI and EMA Channels for Sells?
THIS CAN DO THAT!
Choose from the following to create your ideal strategy :
- HIGH BB / LOW BB
- EMAGAIN
- RSI (Relative Strength Index)
- MFI (Money Flow)
- EMA Channels
------------------------------------
CryptoProTools Members Only
-----------------------------------
Hit me up to learn more about becoming a member.
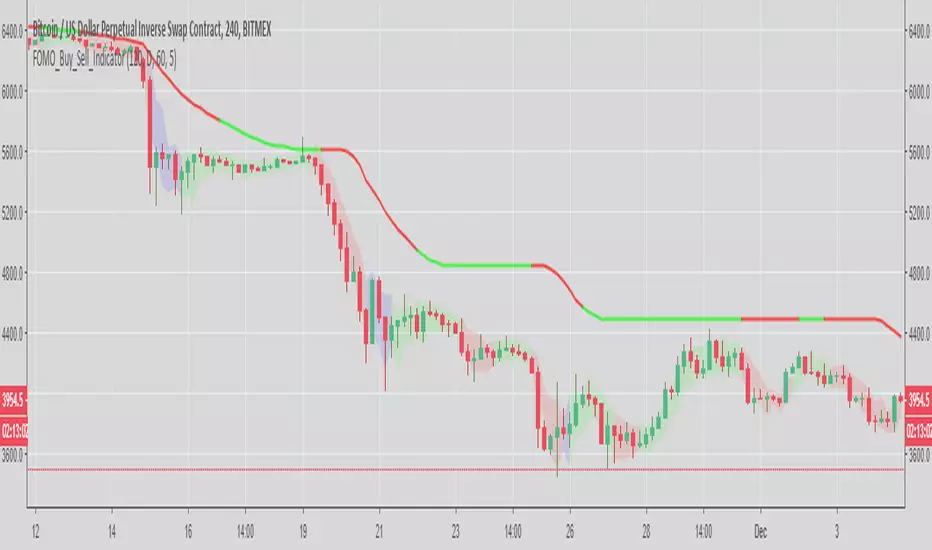
FOMO_Buy_Sell_IndicatorBuy and sell indicator that fits everyone's needs.
For noobs - You can use it even if you are not TA friendly. Green is buy and Red is sell.
For pros - It helps you second guess your ins and outs.
PM to gain access, please. Thanks
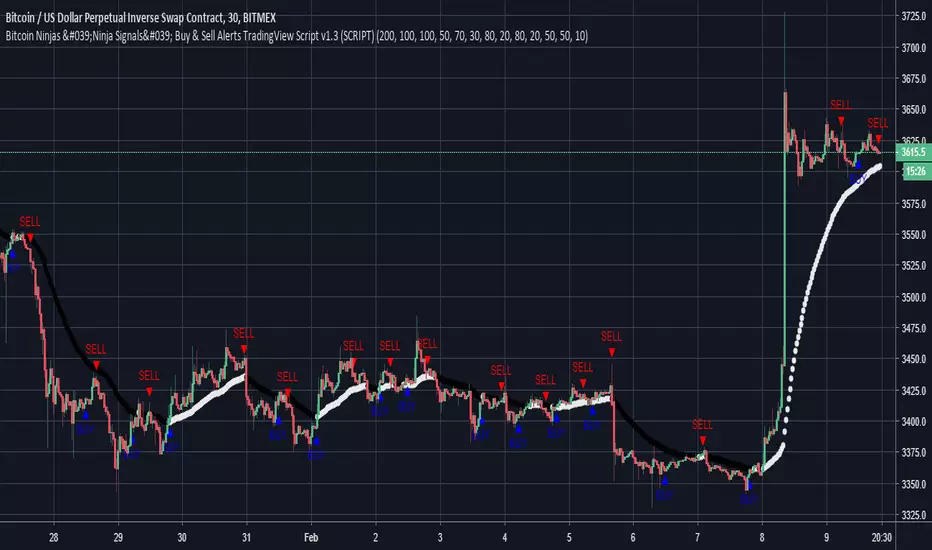
Bitcoin Ninjas 'Ninja Signals' Buy & Sell Alert Trading ScriptBitcoin Ninjas 'Ninja Signals' Buy/Sell Alerts & Backtesting TradingView Script
(for Cryptocurrencies, Forex, GunBot, ProfitTrailer, automatic trading software, and more)
-Allows users to easily set automated buy and sell alerts on TradingView for use with automatic and manual trading of cryptocurrencies, Forex securities, and more (alerts are compatible with automatic trading software such as GunBot, ProfitTrailer, and more).
-Synthesizes many powerful indicators [e.g. Relative Strength Index (RSI), stochastic RSI, Money Flow Index (MFI), Moving Average Convergence Divergence (MACD), etc.) into one super script to generate very precise buy and sell signals in almost any market condition.
-Buy arrows (blue) and sell arrows (red) can be changed or hidden for ease of viewing.
-No lag EMA trendline featuring trend-reversal color-coding (white uptrend, black downtrend).
-Adjustable ‘calibration’ setting allows users to customize the script to work for any currency or security available through TradingView, on any exchange, simply by adjusting a number.
-Complete with backtesting strategy version of script which allows users to test various buy and sell strategies based on the alerts the script generates (see info and screenshots below).
-Backtesting strategy incorporates a user-defined adjustable date range, so users can estimate the script’s performance over specific periods of time, such as the last day, week, or month.
-Backtesting strategy utilizes a minimum protective gain setting to help you never sell for a loss. Simply adjust your minimum profit (%) per trade, and the test results will update.
-Backtesting strategy allows for pyramid buying to test various average down / double up buying strategies. Simply adjust the number of pyramid buys and the quantity of each buy.
-Free 7-day trial available for TradingView users who join our free BitcoinNinjas community.
-Free 24/7 support via BitcoinNinjas Telegram GunBot support group with script purchase.
-Fully compatible with GunBot automatic trading software (TradingView plugin is required).
-Special discount available for traders who purchase GunBot automatic trading software and the GunBot TradingView plugin from BitcoinNinjas, allowing for fully automatic trading.
-Contact us for more information, to request additional / custom screenshots, or to start your free trial.
DISCLAIMER: By viewing and/or using this TradingView script, you agree to the BitcoinNinjas 'Terms of Use', as presented on our website and as stated here. No sharing, copying, reselling, modifying, or any other forms of use, are authorized for this document. This document is strictly for individual use and informational purposes only. This is not financial or investment advice. Investments are always made at your own risk, and are ba
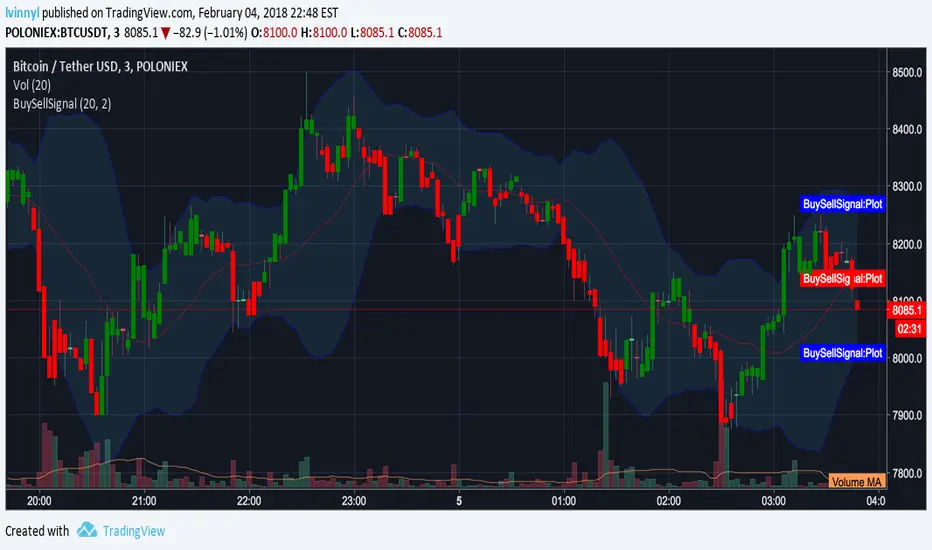
GreenRedSignal with Alerts by lvinnyl// Script created by JoinFree
// Modified by lvinnyl to trigger alerts
// Click on image below for original script...

RSI DivergenceRSI DIVERGENCE is a difference between a fast and a slow RSI. Default values are 5 for the fast one and 14 for the slow one.
You can use this indicator in 2 different ways:
normal RSI : check double or triple top/bottom on a chart meanwhile RSI is descending/ascending (check the example on chart)
signal line : when RSI Divergence cross zero line from bottom to top you get a buy signal (the line become green), vice versa when the RSI Divergence cross zero line in the opposite way you get a sell signal (the line become red)

MULTIPLE TIME-FRAME STRATEGY(TREND, MOMENTUM, ENTRY) Hey everyone, this is one strategy that I have found profitable over time. It is a multiple time frame strategy that utilizes 3 time-frames. Highest time-frame is the trend, medium time-frame is the momentum and short time-frame is the entry point.
Long Term:
- If closed candle is above entry then we are looking for longs, otherwise we are looking for shorts
Medium Term:
- If Stoch SmoothK is above or below SmoothK and the momentum matches long term trend then we look for entries.
Short Term:
- If a moving average crossover(long)/crossunder(short) occurs then place a trade in the direction of the trend.
Close Trade:
- Trade is closed when the Medium term SmoothK Crosses under/above SmoothD.
You can mess with the settings to get the best Profit Factor / Percent Profit that matches your plan.
Best of luck!

TonyUX EMA Scalper - Buy / SellThis is a simple scalping strategy that works for all time frames... I have only tested it on FOREX
It works by checking if the price is currently in an uptrend and if it crosses the 20 EMA.
If it crosses the 20 EMA and its in and uptrend it will post a BUY SIGNAL.
If it crosses the 20 EMA and its in and down it will post a SELL SIGNAL.
The red line is the highest close of the previous 8 bars --- This is resistance
The green line is the lowest close of the previous 8 bars -- This is support
