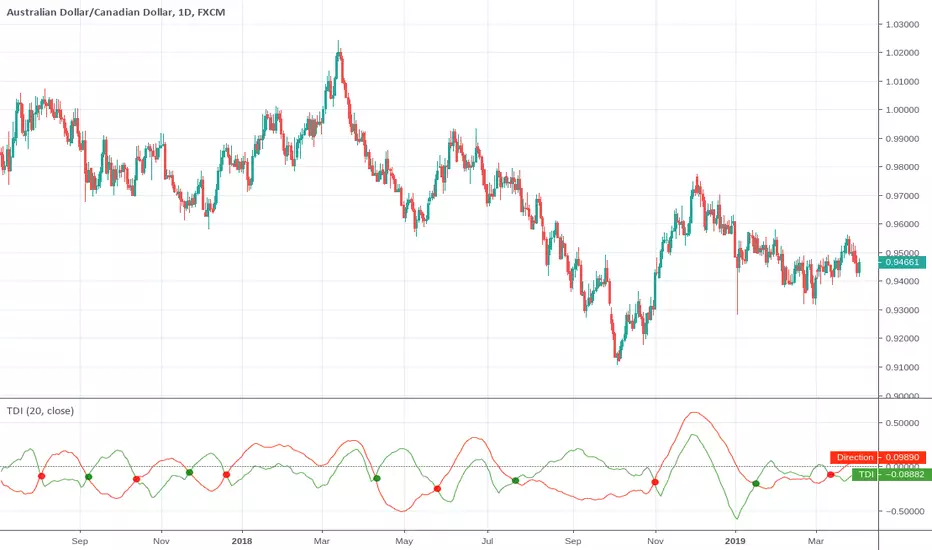
Trend Detection IndexTrend Detection Index indicator script.
This indicator was originally developed by M.H. Pee (Stocks & Commodities V. 19:10 (54-61): Trend Detection Index).
Buy

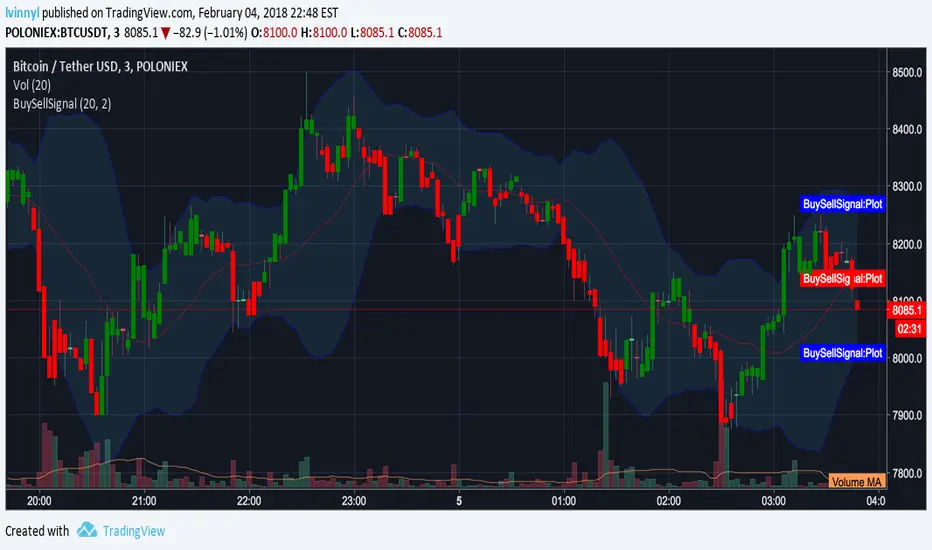
GreenRedSignal with Alerts by lvinnyl// Script created by JoinFree
// Modified by lvinnyl to trigger alerts
// Click on image below for original script...
BTC Buy Sell Guide (BSG) - MA & RSIhi BTChes,
green is when the price drops below the 100 day MA
red is the intensity of the 14 day RSI
BUY @ green
SELL @ the second or third RSI spike
most importantly, keep in mind fundamentals :)
-joie
Patrones de entrada/salida V.1.0 -BETA-Este algoritmo intenta identificar patrones o fractales dentro de los movimientos de precios para dar señales de compra o venta de activos.


Tops/BottomsUsing Modified code from Lazybear's CVI 0.17% indicator and some logic, this script can help identify value buy and sell opportunities at a very early phase. Best used as a confirmation tool. This is a beta, so use it as such. Enjoy.
Sometimes "top" indications in an uptrend mean to look for an opportunity to add to position while "bottom" indications during a downtrend can represent the same thing. The trend is your friend, use it to your advantage!
Red star above bar == potential top
Green star below bar == potential bottom

RSI DivergenceRSI DIVERGENCE is a difference between a fast and a slow RSI. Default values are 5 for the fast one and 14 for the slow one.
You can use this indicator in 2 different ways:
normal RSI : check double or triple top/bottom on a chart meanwhile RSI is descending/ascending (check the example on chart)
signal line : when RSI Divergence cross zero line from bottom to top you get a buy signal (the line become green), vice versa when the RSI Divergence cross zero line in the opposite way you get a sell signal (the line become red)


MULTIPLE TIME-FRAME STRATEGY(TREND, MOMENTUM, ENTRY) Hey everyone, this is one strategy that I have found profitable over time. It is a multiple time frame strategy that utilizes 3 time-frames. Highest time-frame is the trend, medium time-frame is the momentum and short time-frame is the entry point.
Long Term:
- If closed candle is above entry then we are looking for longs, otherwise we are looking for shorts
Medium Term:
- If Stoch SmoothK is above or below SmoothK and the momentum matches long term trend then we look for entries.
Short Term:
- If a moving average crossover(long)/crossunder(short) occurs then place a trade in the direction of the trend.
Close Trade:
- Trade is closed when the Medium term SmoothK Crosses under/above SmoothD.
You can mess with the settings to get the best Profit Factor / Percent Profit that matches your plan.
Best of luck!

[STRATEGY][RS]MicuRobert EMA cross V2Great thanks Ricardo , watch this man . Start at 2014 December with 1000 euro.

TUX 4 MAThis indicator uses the 21, 55, 100 and 200 SMA.
Strategy:
When the 21 SMA crosses the 55 and 100 SMA it creates either a buy or sell symbol dependent on which way it crossed.

RSI Stochastic Extreme Combo alertThis script will give you red or green columns as an indication for oversold/overbought based upon the rsi and stochastic both being at extreme levels (you set). The default oversold is at 35. If Stochastic and RSI fall below 35, you will get a green column (Both indicators at the extreme). Play with your levels to see how your stock reacts. RSI and Stochastic can both be changed along with each of the levels you would like the color change. I have set mine at RSI low: 37, RSI high: 63, Stoch low: 10, and Stoch high: 90. These levels have been working well for me on AAPL. Enjoy and don't forget to leave a comment if it helps your trading or you have other ideas about what is working for you.

TonyUX EMA Scalper - Buy / SellThis is a simple scalping strategy that works for all time frames... I have only tested it on FOREX
It works by checking if the price is currently in an uptrend and if it crosses the 20 EMA.
If it crosses the 20 EMA and its in and uptrend it will post a BUY SIGNAL.
If it crosses the 20 EMA and its in and down it will post a SELL SIGNAL.
The red line is the highest close of the previous 8 bars --- This is resistance
The green line is the lowest close of the previous 8 bars -- This is support

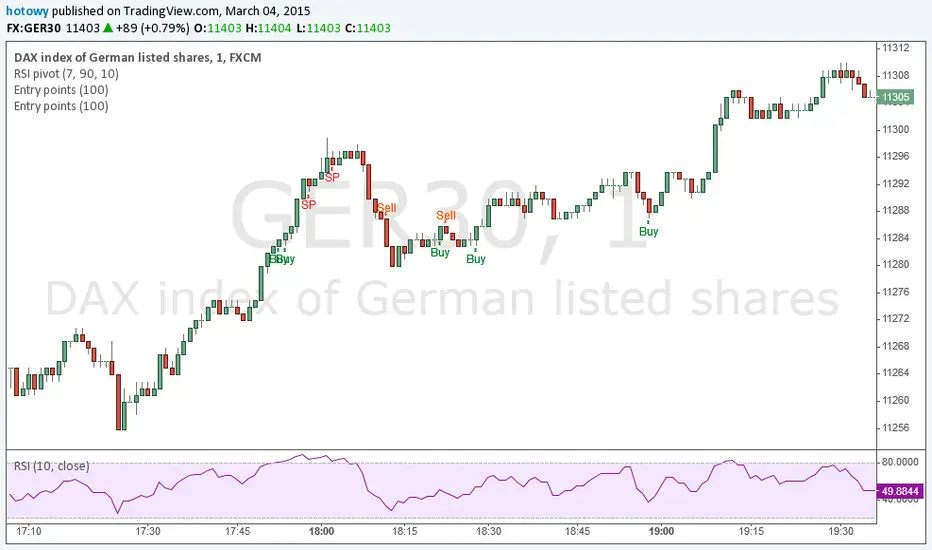
Entry pointsThis great and simple indicator based on EMA generates information about entry points at close of the candle. First signal is the best entry point but you can re-enter at the next. IMPORTANT: this script does not generate exit signals and those shoud be find using money management rules or else. Perfectly catches long runs in trends at all underlayings (forex, stocks, indexes, commodities) at all timeframes. Period=100 works best independently on timeframe but I encourage you to try other. Lower period gives more incorrect signals and shorter runs, higher period gives you late entry and less. Ofcourse it gives false signals from time to time but fortunately it makes a correction very fast. Try it! Good luck and good traiding!
Patrick's Buy HistogramSet up a trailing stop at about 0. Look for the red dots.and that's a good point to enter a long trade.

Patrick's Buy/Sell HistogramSimply look for a 12 point long bar and that's a perfect time to buy the security

MAGNUS™A CHANGE of background color indicates a trade opportunity :
Cyan background = BUY
Purple background = SELL
The bullish signals seem to be better than the bearish ones.
Based on the "Willy" indicator.
Don't change the parameters unless you fully understand the consequences.
Use with brains and caution :)
