Flux Charts - SFX Screener💎 GENERAL OVERVIEW
The SFX Screener by Flux Charts is a multi-timeframe market scanner that extracts and visually organizes key conditions detected by the SFX Algo indicator across multiple assets in real-time. It does not perform independent analysis or generate new signals—instead, it pulls data directly from the SFX Algo’s calculations to ensure full alignment across different timeframes and tickers.
The SFX Algo is a multi-factor trading indicator that integrates trend analysis, signal generation, market overlays, and take-profit/stop-loss levels into a single system. It evaluates multiple trend components, including EMA direction, momentum shifts, and volatility cycles, to determine market conditions. Signal generation is based on an Adjusted Weighted Majority Algorithm, filtering out weaker signals by prioritizing the most reliable market indicators. Market overlays, such as Volatility Bands and the Retracement Wave, provide dynamic support, resistance, exit points, and entry points. Its adaptable structure allows traders to customize settings based on strategy preferences, making it effective for scalping, swing trading, and long-term trend analysis.
The SFX Screener’s purpose is to give traders a dashboard view of these SFX Algo signals across multiple tickers and timeframes in real-time.
📌 HOW DOES IT WORK ?
The SFX Algo indicator employs an Adjusted Weighted Majority algorithm to generate "buy" and "sell" signals. It evaluates multiple market indicators ("experts"), including momentum, ATR trends, and EMA trends, and assigns weights based on their recent performance. The "Time Weighting" setting allows users to balance between using more historical data or prioritizing recent trends. Unlike traditional weighted majority methods, SFX also dynamically penalizes larger losses. Signals are confirmed based on the consensus of the most successful indicators within the selected time period, filtering out weaker signals during underperforming phases.
The SFX Screener extracts these calculated outputs and visually organizes them into a real-time dashboard. Each signal, status, and volatility condition displayed in the screener is a direct output from the SFX Algo indicator.
🚩 UNIQUENESS
Unlike traditional screeners that rely on preset filters or static conditions, the SFX Screener dynamically updates its dashboard based on live outputs from the SFX Algo’s adaptive algorithm.
Traditional Screeners → Use predefined filters like “price above EMA” or “RSI overbought.” They do not adjust to market dynamics.
SFX Screener → Displays outputs directly from an adaptive algorithm that continuously evaluates trends, volatility, and momentum changes.
The SFX Screener can show SFX Algo's status on 8 different tickers on different timeframes. Key factors that make it unique include:
✅ Real-time sync with SFX Algo → Displays live conditions, not static filters.
✅ Comprehensive Dashboard – This screener provides a complete and customizable dashboard designed to enhance traders' decision-making by consolidating crucial SFX Algo insights into one user-friendly interface.
✅ Multi-Ticker & Multi-Timeframe Analysis – With support for up to 8 tickers and timeframes, traders can effortlessly analyze the bigger market picture, identifying trends and opportunities across different assets and timeframes.
By combining multiple analytical elements in a single view, this screener empowers traders with the insights needed to navigate the market more effectively.
🎯 SFX SCREENER FEATURES:
SFX Algo Signals : This tool can detect SFX Algo signals across different tickers & timeframes.
Volatility Bands : Detection of Volatility Bands Status & Retests.
Retracement Wave : Detection of Retracement Wave Status & Retests.
Highly Configurable : Offers multiple parameters for fine-tuning detection settings.
Up to 8 Tickers : Allows traders to analyze multiple tickers & timeframes simultaneously for enhanced accuracy.
📊 SFX SCREENER DATA BREAKDOWN
Signal ->
Buy -> The latest signal is a buy signal.
Sell -> The latest signal is a sell signal.
The rating of the signal is shown after the signal type.
Δ⭐ ->
Shows the rating change (delta) after the signal is triggered. Positive values mean that the rating is increased after the signal is given, negative values mean that it's decreased.
Status ->
Displays the amount of time passed after the signal is given.
TP Targets ->
Shows the Take-Profit targets of the signal, if a target was achieved, there is a ✅ symbol near it and the next target it displayed.
V. Bands ->
The Volatility Bands dynamically adjust to market conditions, expanding during high volatility and contracting during low volatility. When the volatility bands are tight, or the upper and lower bands are close to each other, the market is not volatile. During periods of low volatility, it’s common for price to consolidate or move sideways. An early indication of a large price move can occur when the bands widen or open up after being tight. When the volatility bands are wide, it reflects a period of increased volatility, typically during strong price trends or after a breakout. The volatility bands can also act as support and resistance areas. The upper band acts as resistance while the lower band acts as support. These mark out good areas for potential reversals. Breakouts can also occur when price moves beyond the bands, signaling a potential trend in the breakout direction.
Outside -> The price is currently outside of the Volatility Bands.
Inside | Upper -> The price is currently inside the Upper Volatility Band.
Inside | Lower -> The price is currently inside the Lower Volatility Band.
R. Wave ->
The Retracement Wave is used to identify entry points during pullbacks in trending markets. It can also be used to find exit points for open trades. The wave is bullish when price is above it and bearish when the price is below it. The retracement wave can be used as an area to enter during a pullback in a trending market. The wave can also be helpful for managing risk and closing out positions.
Outside | Bullish -> The Retracement Wave is currently Bullish, and the price is outside of it.
Outside | Bearish -> The Retracement Wave is currently Bearish, and the price is outside of it.
Inside | Bullish -> The Retracement Wave is currently Bullish, and the price is inside of it.
Inside | Bearish -> The Retracement Wave is currently Bearish, and the price is inside of it.
Profit & Loss (P&L) ->
Shows the amount of profit or loss the position is currently in. All values are shown in terms of percentage, and positive values mean the position is in profit while negative values mean that the position is in loss.
⚠ Timeframe Restriction : The selected timeframes for analysis cannot be lower than the chart’s current timeframe to ensure proper data alignment.
⏰ ALERTS
This screener supports alerts, so you never miss a key market move. You can choose to receive alerts when a buy or sell signal is given, helping you spot potential trading opportunities. Additionally, you can enable alerts for take-profit or stop-loss levels, which notify you when the price achieves those levels. The alerts will work for each enabled ticker in the settings. You can also toggle webhook format for alerts, and choose to include ticker metadata in it.
⚙️ SETTINGS
1. Algorithm Settings
Sensitivity: The sensitivity setting is a key parameter that influences the frequency of signals the SFX Algo generates. By adjusting this parameter, you can control the frequency of signals produced by the algorithm. Using a lower sensitivity setting generates more frequent signals that are highly responsive to minor price fluctuations. Using a higher sensitivity setting reduces the frequency of signals, focusing on more significant price movements and filtering out minor fluctuations.
Signal Strength: The Signal Strength setting filters signals based on their quality, allowing traders to focus on the most reliable opportunities. This feature helps traders balance the quantity and reliability of the algorithm’s signals to suit their trading strategy. Using a lower signal strength will display more signals, including those with lower signal ratings, for broader market coverage. Using a higher signal strength will display fewer signals by prioritizing those with higher signal ratings, reducing market noise.
Time Weighting: The Time Weighting setting in the SFX Algo determines how historical market data is analyzed to generate signals.
a) Recent Trends
Focuses on the most recent movements for short-term analysis. This setting is good for scalpers and intraday traders who need to react quickly to market changes.
b) Mixed Trends
Balances recent and historical price movements for a comprehensive market view. This setting is well-suited for swing traders and those who want to capture medium-term opportunities by combining the benefits of short-term responsiveness with the reliability of long-term trends.
c) Long-term Trends
Relies on extended historical market data to identify broader market trends, making it an excellent choice for traders focused on long-term strategies.
Minimum Star Rating : The Minimum Star Rating setting allows you to filter signals based on their strength, showing only those that meet or exceed your chosen threshold. For instance, setting the minimum star rating to 3 ensures you only receive signals with a rating of 3 stars or higher.
2. Take Profit / Stop Loss Methods
Key Levels
The Key Levels method uses pivot points to set take profit and stop-loss levels. The TP and SL levels are shown when a new signal is generated.
Volatility Bands
This TP/SL method uses the Volatility Bands overlay to set dynamic TP and SL levels. These levels are not predetermined so they will not be shown in advance when a signal is generated.
Signal Rating
Sets take profit and stop-loss levels based on changes in a signal's rating strength. These levels are not predetermined so they will not be shown in advance when a signal is generated.
Auto Stop-Loss
The auto method can only be applied to the SL. The auto method allows the algorithm to detect SL automatically when a momentum shift is detected. You can adjust the risk tolerance of the Auto SL by adjusting the ‘Auto Risk Tolerance’ setting. You can choose between Low, Medium, and High. A high-risk tolerance will result in stop losses being triggered less often.
3. Tickers
You can set, then enable or disable up to 8 tickers in this section to get informed about their latest SFX Algo signal.
‼️ Important Notes
TradingView has limitations when running advanced screeners, resulting in the following restrictions:
Computation Errors:
The computation of using MTF features and viewing several tickers is very intensive on TradingView. This can sometimes cause calculation timeouts. When this occurs simply force the recalculation by modifying one indicator’s settings or by removing the indicator and adding it to your chart again.
Inconsistencies:
You may notice inconsistencies when viewing the screener on a chart with a specific symbol because screener tickers originate from different markets. Since the cryptocurrency market operates 24/7, while stock markets have defined opening and closing hours, the screener may return varying information depending on whether you're currently viewing a cryptocurrency, stock, or currency pair.
Buysellsignal

Smart Adaptive Signal SystemSmart Adaptive Signal System
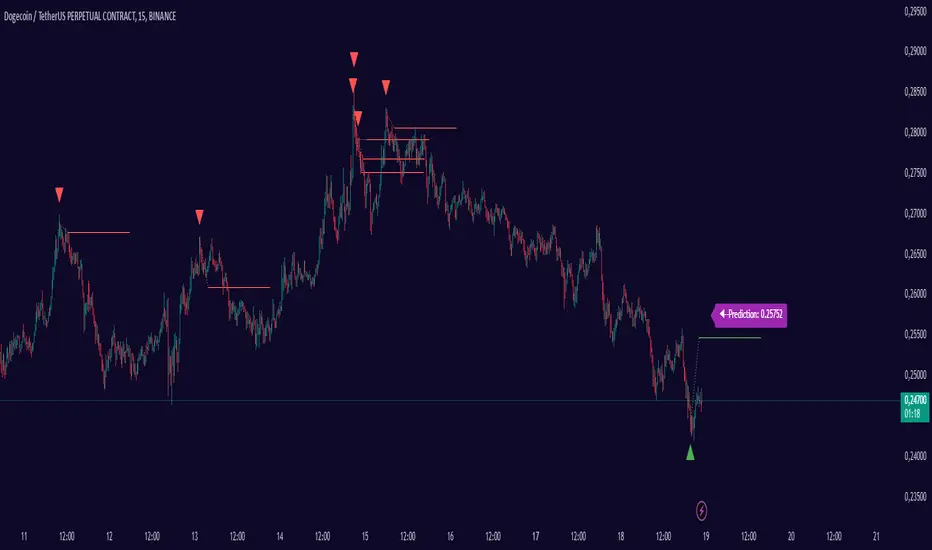
Description: The Smart Adaptive Signal System is a sophisticated indicator that generates intelligent buy/sell signals by dynamically adapting to market conditions. It predicts target prices based on momentum and volatility, providing more accurate and reliable trading opportunities.
How It Works:
Dynamic Signal Generation: The system predicts target prices by considering factors such as volatility and momentum. This allows it to react instantly to trend changes and market fluctuations.
Adaptive Thresholds: Buy and sell signals are triggered with adaptive thresholds, adjusting according to market volatility. This ensures flexibility in the face of sudden market changes.
Trend-Based Reset: Users can choose to reset threshold values based on a time interval or trend change. This feature helps the system re-adapt to current market conditions for greater accuracy.
Target Price Prediction: Target prices are calculated using momentum and volatility, helping the system predict future price movements.
How to Use:
Buy/Sell Signals: The indicator generates buy and sell signals based on market conditions. Look for a "down arrow" for a buy signal and an "up arrow" for a sell signal on the chart.
Target Price Lines: Along with buy and sell signals, the system draws target price lines. This helps you visualize potential future price levels.
Flexible Settings: Users can customize analysis periods, minimum change percentages, and other parameters to fit their needs.
Features:
Dynamic buy and sell signals
Target price predictions
Volatility and momentum-based analysis
User-friendly and flexible settings
Trend-based adaptive resetting
Alerts: The Smart Adaptive Signal System responds quickly to sudden market changes, but always use it in conjunction with other indicators like support and resistance levels. Signal accuracy may vary depending on market conditions.
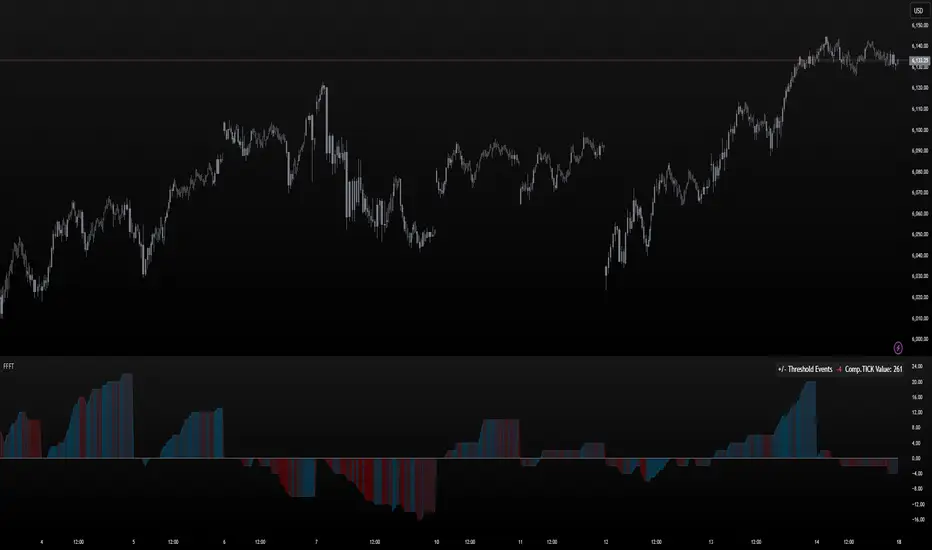
FoundryFutures Filtered Tick**Foundry Futures Filtered Tick (FFFT) – TradingView Indicator**
Overview
The Foundry Futures Filtered Tick (FFFT) is a market breadth indicator that filters out noise to track only significant tick events. Using a Custom Composite Cumulative Tick formula, it monitors buying and selling pressure during large events or waves of orders across exchanges. This gives traders a clearer view of market sentiment and momentum shifts throughout the trading day, without the distraction of minor tick movements.
Key Features
• Filters large tick events while ignoring minor fluctuations
• Tracks cumulative bullish/bearish threshold crossings ("Events") to highlight momentum shifts
• Uses dynamic color gradient visualization (red for selling, cyan for buying)
• Provides zero-line reference for directional bias
• Displays integrated real-time table for market context and large event tracking
How to Use
1. Add to favorites
2. Open chart, navigate to indicators tab > Favorites > Search "FoundryFutures Filtered Tick"
3. Apply to your chart
4. Select preferred market and begin using
Adjust Settings
• Set positive & negative thresholds to define meaningful tick events (Default +/-999)
• Customize line width and colors for better visibility if desired
• Interpret Signals above or below zero intraday as momentum shifts in sentiment across exchanges.
• Above zero & rising → Increasing bullish momentum
• Below zero & falling → Increasing selling pressure
• Frequent crossings → Potential market exhaustion or range bound activity
Risk Disclaimer & Release of Liability
Trading futures is highly speculative and involves substantial risk. The FFFT indicator does not predict market direction or guarantee profitability. It is for educational purposes only and should be used alongside proper risk management and independent analysis.
**By using this indicator, you acknowledge that:**
• You are solely responsible for your trading decisions
• Foundry Futures and its creator make no warranties or guarantees regarding accuracy or profitability
• You assume full responsibility for any financial losses incurred
• If you do not agree with these terms, do not use this indicator. Trade responsibly
Overextension Oscillator [by DanielM]The Overextension Oscillator is an indicator that detects when a market move has extended significantly beyond its typical range, signaling potential areas for a correction or reversal. Unlike traditional oscillators that rely on fixed overbought/oversold levels, this tool dynamically adjusts its thresholds based on historical swing high and swing low movements.
By analyzing all swing points on the chart, the indicator determines the expected range of price movements and identifies when the price extends beyond normal levels. Since every asset has different price behavior and volatility, swing lengths may vary from asset to asset, ensuring that overextension is measured relative to each market's historical price behavior.
How It Works
1️⃣ Swing Detection & Data Collection
The indicator scans all available swing highs and swing lows on the chart to gather a complete dataset of past price fluctuations.
It records the percentage differences between swings to determine how much price typically moves in a given market.
2️⃣ Overextension Calculation
Using the stored swing data, the indicator calculates:
Average Swing Difference – Measures the average percentage difference between swings.
Average Move Percentage – Determines the typical magnitude of price moves within a trend cycle.
These values are used to create dynamic overextension thresholds that adjust based on historical data.
3️⃣ Price Distance & Overextension Measurement
The indicator calculates the distance between the current price and the closest historical swing point. If this distance exceeds the predefined threshold based on past swings, the move is considered overextended. The greater the deviation, the higher the probability of a pullback or short-term reversal.
4️⃣ Buy/Sell Signal Generation
A Buy signal is generated when the price has dropped below an overextended threshold relative to a past swing low.
A Sell signal is generated when the price has risen beyond an overextended threshold relative to a past swing high.
These signals indicate that the price has reached a level where it historically tends to slow down or reverse.

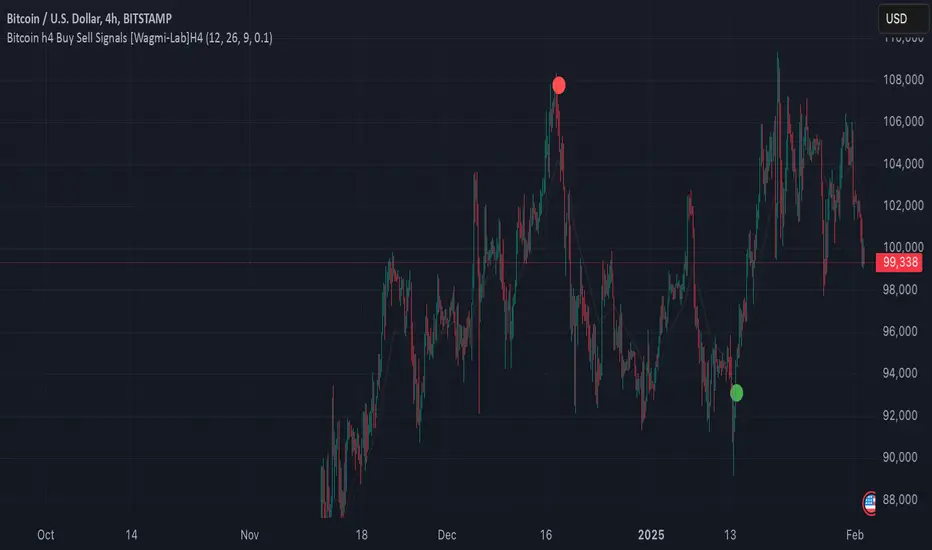
Wagmi Lab- Bitcoin H4 Buy Sell Signals This indicator, designed primarily for Bitcoin on the H4 timeframe, is a versatile tool that can also be applied to other assets and timeframes by adjusting its parameters. It combines Exponential Moving Averages (EMAs), MACD (Moving Average Convergence Divergence), and a crossover filtering mechanism to generate reliable buy and sell signals. The indicator is ideal for traders looking to identify trend direction and potential entry/exit points with added precision.
Key Features:
Customizable EMAs and MACD:
Fast EMA (default: 12): Tracks short-term price momentum.
Slow EMA (default: 26): Tracks long-term price momentum.
Signal SMA (default: 9): Smooths the MACD line to generate the signal line.
MACD Crossover Signals:
The indicator calculates the MACD line and signal line to identify potential buy and sell opportunities.
Buy signals are generated when the MACD line crosses above the signal line, indicating bullish momentum.
Sell signals are generated when the MACD line crosses below the signal line, indicating bearish momentum.
Crossover Strength Filter:
A minimum crossover distance percentage (default: 0.1%) ensures that only significant crossovers are considered, reducing false signals.
This filter helps traders avoid weak or insignificant crossovers that may not lead to strong price movements.
Trend Visualization:
The indicator highlights the trend direction by filling the area between the fast and slow EMAs with colors:
Green: Uptrend (MACD > Signal Line).
Red: Downtrend (MACD < Signal Line).
Buy/Sell Signal Markers:
Buy signals are marked with green circles below the price bars.
Sell signals are marked with red circles above the price bars.
These markers provide clear visual cues for potential entry and exit points.
Adaptable to Other Timeframes and Assets:
While optimized for the H4 timeframe, the indicator can be adjusted for other timeframes (e.g., M15, H1, D1) by modifying the EMA and SMA settings.
It can also be applied to other assets, such as stocks, forex, or commodities, by tweaking the parameters to suit the asset's volatility and characteristics.
How to Use:
Identify Trends:
Use the colored areas (green for uptrend, red for downtrend) to determine the overall market direction.
Wait for Confirmation:
Look for buy or sell signals (green or red circles) that align with the trend direction.
Ensure the crossover meets the minimum distance requirement to filter out weak signals.
Enter and Exit Trades:
Enter a long position when a buy signal appears during an uptrend.
Enter a short position or exit a long position when a sell signal appears during a downtrend.
Adjust Settings for Other Timeframes/Assets:
Experiment with the EMA and SMA periods to optimize the indicator for different timeframes or assets.
Why Use This Indicator?
Precision: The crossover strength filter reduces noise and false signals.
Versatility: Works across multiple timeframes and assets with customizable settings.
Visual Clarity: Clear trend visualization and signal markers make it easy to interpret.
This indicator is a powerful tool for traders seeking to capitalize on Bitcoin's volatility or other assets' price movements, providing a structured approach to identifying trends and potential trading opportunities.
Johnny's Volatility-Driven Trend Identifier w/ Reversal SignalsJohnny's Volatility-Driven Trend Identifier w/ Reversal Signals is designed to identify high-probability trend shifts and reversals by incorporating volatility, momentum, and impulse-based filtering. It is specifically built for traders who want to capture strong trend movements while minimizing false signals caused by low volatility noise.
By leveraging Rate of Change (ROC), Relative Strength Index (RSI), and Average True Range (ATR)-based volatility detection, the indicator dynamically adapts to market conditions. It highlights breakout trends, reversals, and early signs of momentum shifts using strategically placed labels and color-coded trend visualization.
Inspiration taken from Top G indicator .
What This Indicator Does
The Volatility-Driven Trend Identifier works by:
Measuring Market Extremes & Momentum:
Uses ROC normalization with standard deviation to identify impulse moves in price action.
Implements RSI filtering to determine overbought/oversold conditions that validate trend strength.
Utilizes ATR-based volatility tracking to ensure signals only appear when meaningful market movements are occurring.
Identifying Key Trend Events:
Power Peak (🔥): Marks a confirmed strong downtrend, ideal for shorting opportunities.
Surge (🚀): Indicates a confirmed strong uptrend, signaling a potential long entry.
Soft Surge (↗): Highlights a mild bullish reentry or early uptrend formation.
Soft Peak (↘): Shows a mild bearish reentry or early downtrend formation.
Providing Adaptive Filtering for Reliable Signals:
Filters out weak trends with a volatility check, ensuring signals appear only in strong market conditions.
Implements multi-level confirmation by combining trend strength metrics, preventing false breakouts.
Uses gradient-based visualization to color-code market sentiment for quick interpretation.
What This Indicator Signals
Breakouts & Impulse Moves: 🚀🔥
The Surge (🚀) and Power Peak (🔥) labels indicate confirmed momentum breakouts, where the trend has been validated by a combination of ROC impulse, RSI confirmation, and ATR volatility filtering.
These signals suggest that the market is entering a strong trend, and traders can align their entries accordingly.
Early Trend Formation & Reentries: ↗ ↘
The Soft Surge (↗) and Soft Peak (↘) labels indicate areas where a trend might be forming, but is not yet fully confirmed.
These signals help traders anticipate potential entries before the trend gains full strength.
Volatility-Adaptive Trend Filtering: 📊
Since the indicator only activates in volatile conditions, it avoids the pitfalls of low-range choppy markets where false signals frequently occur.
ATR-driven adaptive windowing allows the indicator to dynamically adjust its sensitivity based on real-time volatility conditions.
How to Use This Indicator
1. Identifying High-Probability Entries
Bullish Entries (Long Trades)
Look for 🚀 Surge signals in an uptrend.
Confirm with RSI (should be above 50 for momentum).
Ensure volatility is increasing to validate the breakout.
Use ↗ Soft Surge signals for early entries before the trend fully confirms.
Bearish Entries (Short Trades)
Look for 🔥 Power Peak signals in a downtrend.
RSI should be below 50, indicating downward momentum.
Volatility should be rising, ensuring market momentum is strong.
Use ↘ Soft Peak signals for early entries before a full bearish confirmation.
2. Avoiding False Signals
Ignore signals when the market is ranging (low ATR).
Check RSI and ROC alignment to ensure trend confirmation.
Use additional confluences (e.g., price action, support/resistance levels, moving averages) for enhanced accuracy.
3. Trend Confirmation & Filtering
The stronger the trend, the higher the likelihood that Surge (🚀) and Power Peak (🔥) signals will continue in their direction.
Soft Surge (↗) and Soft Peak (↘) act as early warning signals before major breakouts occur.
What Makes This a Machine Learning-Inspired Moving Average?
While this indicator is not a direct implementation of machine learning (as Pine Script lacks AI/ML capabilities), it mimics machine learning principles by adapting dynamically to market conditions using the following techniques:
Adaptive Trend Selection:
It does not rely on fixed moving averages but instead adapts dynamically based on volatility expansion and momentum detection.
ATR-based filtering adjusts the indicator’s sensitivity to real-time conditions.
Multi-Factor Confirmation (Feature Engineering Equivalent in ML):
Combines ROC, RSI, and ATR in a structured way, similar to how ML models use multiple inputs to filter and classify data.
Implements conditional trend recognition, ensuring that only valid signals pass through the filter.
Noise Reduction with Data Smoothing:
The algorithm avoids false signals by incorporating trend intensity thresholds, much like how ML models remove outliers to refine predictions.
Adaptive filtering ensures that low-volatility environments do not produce misleading signals.
Why Use This Indicator?
✔ Reduces False Signals: Multi-factor validation ensures only high-confidence signals are triggered.
✔ Works in All Market Conditions: Volatility-adaptive nature allows the indicator to perform well in both trending and ranging markets.
✔ Great for Swing & Intraday Trading: It helps spot momentum shifts early and allows traders to catch major market moves before they fully develop.
✔ Visually Intuitive: Color-coded trends and clear signal markers make it easy to interpret.

Rabbit Moves - Buy Sell Signals (No Repaint)The Rabbit Moves - Buy Sell Signals (No Repaint) is a powerful TradingView indicator designed to help traders identify potential buy and sell opportunities in the market. By combining the RSI (Relative Strength Index), EMA (Exponential Moving Average), and momentum analysis, this indicator provides clear entry signals for bullish and bearish market movements.
Unlike many repainting indicators, Rabbit Moves ensures reliability by locking in signals once they appear, preventing misleading backtesting results.
How It Works
1. RSI: The Relative Strength Index (RSI) measures the magnitude of recent price changes to evaluate overbought or oversold conditions. A crossover above 50 signals potential bullish momentum, while crossing below 50 suggests bearish momentum.
2. EMA: The Exponential Moving Average (EMA) is used to smooth price data and generate dynamic support or resistance levels. A crossover above the EMA indicates a bullish condition, while a cross below suggests a bearish condition.
3. Momentum: The momentum indicator measures the rate of change of the price and confirms whether the trend is strengthening (bullish) or weakening (bearish).
4. Buy/Sell Percentage:
o The indicator calculates the Buy (Bullish) and Sell (Bearish) probabilities based on the lookback period, which analyzes recent price action to determine how often the market has closed in either direction.
o The Buy Percentage is calculated by determining the number of times the price moved upwards in the past lookback bars, expressed as a percentage of the total observations.
o The Sell Percentage is the inverse, showing the percentage of times the price moved down in the same lookback period.
o These percentages help you assess the likelihood of the next candlestick closing in the predicted direction (up or down), offering additional confirmation for your trades.
Additionally, the indicator calculates the probability of bullish or bearish moves within a defined lookback period. These probabilities are displayed on the chart as percentages, helping traders assess market sentiment.
How to Use the Indicator
1. How to Access
o Kindly check out authors instructions, how you can access this indicator
2. Interpreting the Signals
o Green upward arrow → Indicates a potential buy signal.
o Red downward arrow → Indicates a potential sell signal.
o Probability Display → Shows the likelihood of bullish vs. bearish movements based on historical data.
3. Enhancing Your Strategy
o Use this indicator in combination with support & resistance levels, volume analysis, and price action for better accuracy.
o Apply risk management techniques, such as stop-loss orders and position sizing, to minimize losses.
Why Use This Indicator?
✅ No Repainting – Ensures accurate backtesting and real-time reliability.
✅ Probability-Based Insights – Helps gauge market sentiment before making a trade.
✅ Combines Multiple Technical Factors – Increases accuracy by using RSI, EMA, and momentum together.
✅ Easy-to-Use Signals – Clear buy/sell alerts with visual representation on the chart.
This indicator is designed to work on Forex, Crypto, Stocks, and other financial markets.
Disclaimer:
This indicator is intended solely for educational and informational purposes. It does not constitute financial or investment advice. Trading in financial markets involves significant risk, and past performance is not indicative of future results. Users are responsible for their own trading decisions and should carefully evaluate their risk tolerance and objectives. Always seek professional financial advice before engaging in trading activities.

Trendilo ARTrendilo AR is a custom trading indicator designed to identify market trends using advanced techniques such as the Arnaud Legoux Moving Average (ALMA), volume confirmations, and dynamic volatility bands. This indicator provides a clear visualization of trends, including significant changes and custom alerts.
Review of Indicators Used
1. ALMA
Description:
ALMA is a moving average that applies an advanced filter to smooth price data, reducing noise and focusing on actual trends.
Usage in the Indicator:
Used to calculate the smoothed percentage price change and determine trend direction. Customizable parameters include:
- Length: Defines the number of bars to consider.
- Offset: Adjusts sensitivity toward recent prices.
- Sigma: Controls the degree of smoothing.
Advantages:
- Reduced lag in trend detection.
- Resistance to market noise.
2. ATR
Description:
ATR measures the market’s average volatility by considering the range between high and low prices over a given period.
Usage in the Indicator:
ATR is used to calculate "dynamic smoothing", adjusting the indicator’s sensitivity based on current market volatility.
Advantages:
- Adapts to high or low volatility conditions.
- Helps define dynamic support and resistance levels.
3. SMA
Description:
SMA calculates the average of prices or volume over a specific time period.
Usage in the Indicator:
Used to calculate the volume moving average (Volume SMA) to confirm whether the current volume supports the detected trend.
Advantages:
- Easy to understand and calculate.
- Provides volume-based trend confirmation.
4. RMS Bands
Description:
RMS Bands calculate the standard deviation of percentage price changes, creating upper and lower levels that act as overbought and oversold indicators.
Usage in the Indicator:
- Define the range within which the market is considered neutral.
- Crosses above or below the bands indicate trend changes.
Advantages:
- Visual identification of strong trends.
- Helps filter false signals.
Colors and Visuals Used in the Indicator
1. ALMA Line
Colors:
- Green: Indicates a confirmed uptrend (with sufficient volume).
- Red: Indicates a confirmed downtrend (with sufficient volume).
- Gray: Indicates a neutral phase or insufficient volume to confirm a trend.
2. RMS Bands
- Upper and Lower Lines:
- Purple (with transparency): These lines represent the RMS bands (upper and lower) and
adjust opacity based on trend strength.
- Stronger trends result in less transparency (more solid colors).
3. Highlighted Background (Strong Trends)
- Color:
- Light Green (transparent): Highlights a strong trend when the smoothed percentage change (ALMA) exceeds 1.5 times the RMS.
4. Horizontal Lines
- Baseline (0):
- Dark Gray: Serves as a central reference to identify the directionality of percentage changes.
- Additional Line (0.1):
- Blue: A customizable line to mark user-defined key levels.
5. Bar Colors
- Bar Colors:
- Green: When the price is in a confirmed uptrend.
- Red: When the price is in a confirmed downtrend.
- No color: When there is insufficient volume or no clear trend.
How to Use the Indicator
1. Initial Setup
1. Add the Indicator to Your Chart: Copy the code into the Pine Editor on TradingView and apply it to your chart.
2. Customize Parameters: Adjust values based on your trading strategy:
- Smoothing: Controls the level of smoothing for percentage changes.
- Lookback Length: Defines the observation period for calculations.
- Band Multiplier: Adjusts the width of RMS bands.
2. Signal Interpretation
1. Indicator Colors:
- Green: Confirmed uptrend.
- Red: Confirmed downtrend.
- Gray: No clear trend or insufficient volume.
2. RMS Bands:
- If the ALMA line (smoothed percentage change) crosses above the upper RMS band, it signals a potential uptrend.
- If it crosses below the lower RMS band, it signals a potential downtrend.
3. Volume Confirmation:
- The indicator's color activates only if the current volume exceeds the Volume SMA.
3. Alerts and Decisions
1. Trend Change Alerts:
- The indicator automatically triggers alerts when an uptrend or downtrend is detected.
- Configure these alerts to receive real-time notifications.
2. Strong Trend Signals:
- When the magnitude of the percentage change exceeds 1.5 times the RMS, the chart background highlights the strong trend.
4. Trading Strategies
1. Buy:
- Enter long positions when:
- The indicator turns green.
- Volume confirms the trend.
- Consider placing a stop-loss just below the lower RMS band.
2. Sell:
- Enter short positions when:
- The indicator turns red.
- Volume confirms the trend.
- Consider placing a stop-loss just above the upper RMS band.
3. Neutral:
- Avoid trading when the indicator is gray, as no clear trend or insufficient volume is present.
Disclaimer: As this is my first published indicator, please use it with caution. Feedback is highly appreciated to improve its performance.
Happy Trading!

BS | Buy&Sell Signals With EMAKey Features:
EMA Intersections: Generates clear buy and sell signals based on predefined EMA crossings.
5 EMA Lines: Visualize market trends with five distinct EMA lines plotted on the chart.
Support and Resistance Levels: Easily identify crucial support and resistance levels with our integrated marker.
Comprehensive Indicator Panel: At the bottom of the chart, track Stochastic, RSI, Supertrend, and SMA across multiple timeframes (1m, 5m, 15m, 1H, 4H, Daily, Weekly).
Fully Customizable: Almost every indicator within the tool is adjustable to suit your preferences and trading style.
Alarm Feature: Set up alarms to stay informed of important market movements.
Unlock the full potential of your trading strategy with BS | Buy&Sell Signals With EMA. Customize, analyze, and trade with confidence.
created by @bahadirsezer

mr.crypto731Description:
📊 Enhanced MACD with Strong Buy/Sell Signals 🚀
This script is designed to enhance the standard MACD indicator by adding clear, strong buy and sell signals. It includes:
MACD Line: A fast-moving average that reacts quickly to price changes.
Signal Line: A slower-moving average that smooths out price fluctuations.
MACD Histogram: The difference between the MACD Line and Signal Line, helping to identify trend strength and direction.
Key Features:
Strong Buy/Sell Signals: Uses crossovers of the MACD Line and Signal Line to generate strong buy/sell signals.
Color-Coded Background: Provides visual cues with background colors to highlight strong signals.
User-Friendly Interface: Customizable settings for MACD Fast Length, Slow Length, and Signal Smoothing.

Scalping long-shortThe Scalping long-short indicator is a comprehensive system for analyzing candle patterns and trading volume, designed for use in a scalping strategy. The main purpose of the indicator is to identify the key points of changing market sentiment and provide the trader with accurate signals for entering a trade.
The main components of the indicator:
1. Candle Pattern Analysis:
The indicator analyzes four main candle patterns:
-A Bullish Hammer is a candle with a small body and a long lower tail, which indicates the possible completion of a downward movement and the beginning of an uptrend.
-Bearish Hanging Man is a candle similar to a bullish hammer, but it appears after an upward movement, signaling the possible beginning of a downtrend.
-Bullish Engulfing is a candle with a large body that completely covers the body of the previous candle, showing strong buyer interest.
-Bearish Engulfing is the reverse situation, when a large bearish candle absorbs the previous bullish candle, indicating the predominance of sellers.
-Doji is a candle with almost identical opening and closing prices, indicating market indecision.
For each of these patterns, the indicator sets certain threshold values that the user can adjust to their preferences and features of the trading instrument.
2. Volume analysis:
The volume is an important confirmation of the strength of the signal. The indicator compares the current volume with the average value for the user-selected period (length parameter) multiplied by the volumeMultiplier coefficient. If the current volume exceeds this indicator, the signal is considered confirmed.
3. Visual indication:
Graphical elements corresponding to each type of signal are displayed on the price chart.:
-The green triangle down is a buy signal (bullish hammer or bullish takeover).
-The red triangle up is a sell signal (bearish hanging or bearish engulfing).
-The yellow diamond is a neutral state (doji).
These visual cues help you quickly assess the current market situation without having to analyze each candle manually in depth.
4. Alerts:
The indicator supports setting alerts that can be sent via the TradingView platform or other supporting systems. This allows the trader to receive notifications about the occurrence of new signals even outside the workplace.
Settings:
The user can change the following settings:
-Length is the period for calculating the average volume.
-Multiplier is a multiplier for the thresholds of candle patterns.
-HammerThreshold, HangingManThreshold, EngulfingThreshold, DojiThreshold are Thresholds for recognizing specific candlestick patterns.
-VolumeMultiplier is a coefficient for comparing the current volume with the average value.
These parameters allow you to adapt the indicator to various trading instruments and time intervals, making it a universal tool for a wide range of traders.
Conclusion:
The Scalping long-short indicator combines powerful analytical tools to identify key points in the market, providing the trader with clear and timely signals for making trading decisions. Its flexibility and fine-tuning capability make it useful for both beginners and experienced market participants.

PowerStrike Pro V3Purpose of the Script
"PowerStrike Pro V3" is a custom indicator designed to generate high-accuracy buy/sell signals by combining multiple technical analysis tools. This script is optimized for trend-following, scalping, and support/resistance strategies. It integrates popular indicators such as RSI, Supertrend, Bollinger Bands, and dynamic support/resistance levels to provide traders with reliable signals.
Components of the Script and How It Works
The script combines the following key components, each contributing to the total signal strength based on user-defined weights. Below is a detailed explanation of how each component works and how it contributes to the overall score:
1. RSI (Relative Strength Index)
How It Works:
RSI identifies overbought (above 70) and oversold (below 30) conditions in the market.
The script uses RSI values to measure the strength of the trend and generate buy/sell signals.
When RSI is in the oversold zone, it strengthens buy signals. When in the overbought zone, it strengthens sell signals.
Contribution to Total Score:
RSI's contribution is calculated based on its strength in the oversold or overbought zones.
The final contribution is weighted by the user-defined "RSI Weight" and added to the total score.
2. Support and Resistance Levels
How It Works:
The script dynamically calculates recent peaks (resistance) and valleys (support) using a user-defined lookback period.
These levels are plotted on the chart as dynamic support and resistance lines.
The proximity of the price to these levels strengthens the signals.
Contribution to Total Score:
If the price is near a support level, it increases the strength of buy signals.
If the price is near a resistance level, it increases the strength of sell signals.
The contribution is weighted by the "Support/Resistance Weight" and added to the total score.
3. Supertrend Indicator
How It Works:
Supertrend uses ATR (Average True Range) and a multiplier to determine the trend direction.
The script uses Supertrend's direction changes as a filter for buy/sell signals.
When Supertrend is in an uptrend, it strengthens buy signals. When in a downtrend, it strengthens sell signals.
Contribution to Total Score:
Supertrend's contribution is weighted by the "Supertrend Weight" and added to the total score.
4. Bollinger Bands
How It Works:
Bollinger Bands measure price volatility and identify potential support/resistance levels.
The script generates buy signals when the price crosses above the lower band and sell signals when it crosses below the upper band.
Contribution to Total Score:
A crossover above the lower band increases the strength of buy signals.
A crossover below the upper band increases the strength of sell signals.
The contribution is weighted by the "Bollinger Bands Weight" and added to the total score.
5. Order Book Data
How It Works:
The script analyzes bid/ask volumes from the order book to assess market depth.
High bid volume near support levels strengthens buy signals.
High ask volume near resistance levels strengthens sell signals.
Contribution to Total Score:
Order book data is weighted by the "Order Book Weight" and added to the total score.
Signal Types and Their Meaning
The script generates two types of signals:
Weak Signals:
Weak signals indicate the early stages of a trend or minor corrections.
These are represented by small green (buy) or red (sell) triangles on the chart.
Weak signals are suitable for low-risk trades or scalping strategies.
Strong Signals:
Strong signals indicate the continuation of a trend or significant reversal points.
These are represented by larger green (buy) or red (sell) arrows on the chart.
Strong signals are suitable for higher-risk, higher-reward trades.
Total Score Calculation
The script calculates the total buy and sell scores by combining the weighted contributions of all components. The formula for the total score is as follows:
Copy
Total Buy Score = (RSI Buy Strength * RSI Weight) + (Support Strength * Support/Resistance Weight) + (Supertrend Buy Strength * Supertrend Weight) + (Bollinger Buy Strength * Bollinger Weight) + (Order Book Buy Strength * Order Book Weight)
Total Sell Score = (RSI Sell Strength * RSI Weight) + (Resistance Strength * Support/Resistance Weight) + (Supertrend Sell Strength * Supertrend Weight) + (Bollinger Sell Strength * Bollinger Weight) + (Order Book Sell Strength * Order Book Weight)
The total score is then compared to user-defined thresholds to generate weak or strong signals. For example:
A total buy score above 80% generates a weak buy signal.
A total buy score above 85% generates a strong buy signal.
Recommended Strategies
Trend Following: Use strong signals to trade in the direction of the main trend.
Scalping: Use weak signals to capture short-term price movements.
Support/Resistance Trading: Use the dynamically plotted support and resistance levels to identify reversal points.
How to Use the Script
Weight Settings:
Adjust the weights for each component (RSI, Supertrend, Bollinger Bands, etc.) in the script settings to customize the signal strength calculation.
Signal Thresholds:
Set the thresholds for weak and strong signals (e.g., 80% for weak signals, 85% for strong signals).
Chart Visualization:
The script automatically plots buy/sell signals on the chart. Use these signals in conjunction with your trading strategy.
Unique Features of the Script
Dynamic Weighting: Each component's contribution to the total score can be customized using user-defined weights.
Integrated Support/Resistance: The script dynamically calculates and plots support/resistance levels, enhancing signal accuracy.
Order Book Analysis: The inclusion of order book data provides additional confirmation for signals.
Final Notes
While "PowerStrike Pro V3" combines multiple indicators to generate reliable signals, no indicator guarantees 100% accuracy. Always use proper risk management and combine this script with other analysis tools for the best results

Stochastics Oscillator with Buy/Sell Indicator [iSTAGs]iSTAGs "Stochastics Oscillator" with Buy/Sell Indicator
Overview
The Stochastics Oscillator is a versatile trading indicator designed to provide comprehensive insights into market momentum and potential price reversals. With its multi-layered approach, it incorporates a blend of oscillators, smoothed averages, and relative strength measures to deliver actionable trading signals.
Disclaimer
This indicator is provided for study purposes only . While it may assist in identifying potential buy and sell opportunities, please note:
1. False Signals: The buy/sell indicators may generate false signals. Always validate signals using additional analysis or tools.
2. Trading Strategies: Use appropriate exit points and stop-loss levels as part of your overall trading strategy.
3. No Guarantees: Do not rely solely on this indicator for trading decisions. Market conditions may change, and no indicator guarantees accurate results.
4. Strategy Testing: The strategy associated with this indicator is not tested, and backtesting features are not available at this time.
Key Features
1. Stochastics Oscillator
• Combines the smoothed ranges of price movement to identify overbought and oversold conditions.
• Inbuilt signal lines helps pinpoint potential crossovers for trend reversals.
2. Zones Highlighting
• Clearly visualized zones for:
o Overbought (70–100): Caution for potential reversals.
o Bullish (0–40): Positive momentum.
o Bearish (0 to -40): Negative momentum.
o Oversold (-70 to -100): Potential buying opportunities.
3. Buy and Sell Signals
• Primary Buy/Sell Indicator: Highlighted directly on the chart for ease of use.
• Potential Buy/Sell Signals: Secondary indicators based on advanced crossover conditions that can generate early signals.
4. RSI Integration
• Realtime RSI value display for an additional layer of confirmation.
• Color-coded RSI values to easily interpret market strength:
o Red: Overbought (>80)
o Orange: Strong momentum (70–80)
o White: Neutral (30–70)
o Blue: Weak momentum (20–30)
o Green: Oversold (<20)
5. Limited Customizable Visuals
o Clean and color-coded plots and fills make it intuitive to identify trends and trading opportunities at a glance.
How to Use
1. Trading Signals:
• Use buy/sell shapes and flags for identifying potential entry and exit points.
• Combine primary buy/sell indicator and secondary buy/sell signals for higher confidence.
2. Trend Confirmation:
• Monitor the oscillator and signal crossovers alongside zone fills to gauge market direction.
3. RSI Analysis:
• Keep an eye on the RSI value and its color coding for confirmation of overbought or oversold conditions.
Settings
• Enable/Disable Features: Customize the visibility of Buy/Sell indicators, Potential Signals, and RSI display.
• Editable Zones: Adjust zone colors and ranges to suit your trading strategy.
Conclusion
The Stochastics Oscillator is a powerful tool for traders seeking to enhance their technical analysis. Its layered approach provides clarity, precision, and adaptability for a wide range of trading strategies, whether you're a scalper, swing trader, or long-term investor.
________________________________________
Developed by iSTAGs
________________________________________
Happy Trading! 🎯
HMA Buy Sell Signals - Profit ManagerNote : Settings should be adjusted according to the selected time frame. Try to find the best setting according to the profitability rate
Overall Functionality
This script combines several trading tools to create a comprehensive system for trend analysis, trade execution, and performance tracking. Users can identify market trends using specific moving averages and RSI indicators while managing profit and loss levels automatically.
Trend Detection and Trade Signals
Hull Moving Averages (HMA):
Two HMAs (a faster one and a slower one) are used to determine the market trend.
A buy signal is generated when the faster HMA crosses above the slower HMA.
Conversely, a sell signal is triggered when the faster HMA crosses below the slower one.
Visual Feedback:
Trend lines on the chart change color to reflect the trend direction (e.g., green for upward trends and red for downward trends).
Trade Levels and Management
Entry, Take-Profit, and Stop-Loss Levels:
When the trend shifts upwards, the script calculates entry, take-profit, and stop-loss levels based on the opening price.
Similarly, for downward trends, these levels are determined for short trades.
Commission Tracking:
Each trade includes a commission cost, which is factored into net profit and loss calculations.
Dynamic Labels:
Entry, take-profit, and stop-loss levels are visually marked on the chart for easier tracking.
Performance Tracking
Profit and Loss Tracking:
The script keeps a running total of profits, losses, and commissions for both long and short trades.
It also calculates the net profit after all costs are considered.
Performance Table:
A table is displayed on the chart summarizing:
The number of trades.
Total profit and loss for long and short positions.
Commission costs.
Net profit.
Fractal Support and Resistance
Dynamic Lines:
The script identifies the most recent significant highs and lows using fractals.
It draws support and resistance lines that automatically update as new fractals form.
Simplified Visuals:
The chart always shows the last two support and resistance lines, keeping the visualization clean and focused.
RSI-Based Signals
Overbought and Oversold Levels:
RSI is used to identify overbought (above 80) and oversold (below 20) conditions.
The script generates buy signals at oversold levels and sell signals at overbought levels.
Chart Indicators:
Arrows and labels appear on the chart to highlight these RSI-based opportunities.
Customization
The script allows users to customize key parameters such as:
Moving average lengths for trend detection.
Take-profit and stop-loss percentages.
Timeframes for backtesting.
Starting capital and commission rates.
Conclusion
This script is a versatile tool for traders, combining trend detection, automated trade management, and visual feedback. It simplifies decision-making by providing clear signals and tracking performance metrics, making it suitable for both beginners and experienced traders.
* The most recently drawn fractals represent potential support and resistance levels. If the price aligns with these levels at the time of entering a trade, it may indicate a likelihood of reversal. In such cases, it’s advisable to either avoid entering the trade altogether or proceed with increased caution.

Enigma Unlocked 2.0Description for "Enigma Unlocked 2.0" Pine Script Indicator
Overview
Enigma Unlocked 2.0 is an advanced and highly customizable indicator designed to deliver actionable buy and sell signals by leveraging precise candlestick logic during specific market transitions. This indicator is built for flexibility, helping traders identify high-probability trade setups during key trading periods, specifically the transitions between the Asian Kill Zone and London Kill Zone as well as the London Kill Zone and New York Kill Zone on the 30-minute timeframe.
By combining Enigma Unlocked 2.0 with the ICT Killzones & Pivots indicator, traders can gain a deeper understanding of the timing and location of these transitions. Waiting for signals during these defined kill zones increases the likelihood of finding high-probability trade setups.
How to Use
Follow the Kill Zone Transitions:
Use the ICT Killzones & Pivots indicator to clearly visualize the boundaries of the Asian, London, and New York kill zones.
Focus on the signals generated by Enigma Unlocked 2.0 that align with these kill zone transitions.
Plotting Entries and Targets with Gann Box:
For Buy Signals:
Use the Gann Box tool to mark the high and low of the signal candle.
Ensure your Gann Box settings include only the 50%, 0%, and 100% levels.
Your entry zone lies between the 50% and 100% levels (discount zone). This is where buy trades are expected to offer an optimal risk-reward ratio.
For Sell Signals:
Similarly, plot the Gann Box on the high and low of the signal candle.
The 50% to 100% zone acts as the premium area for sell trades.
Setting Stop Loss and Targets:
To identify a safe stop loss, split the 50% zone of the Gann Box using another Gann Box.
Draw the secondary Gann Box from 50% to 100% of the initial box, then extend it to double the height.
For sell trades, place the stop loss above the extended 100% level.
For buy trades, place the stop loss below the extended 100% level.
Aim for a minimum of 1:1 risk-to-reward to ensure optimal trade management.
How It Works
Buy Logic:
Buy Logic 1: Detects a bullish candle (close > open) that:
Closes above its midpoint (50% of the candle body).
Has a low lower than the previous candle's low.
Buy Logic 2: Identifies a bearish candle (close < open) that:
Closes above its midpoint (50% of the candle body).
Has a low lower than the previous candle's low.
Sell Logic:
Sell Logic 1: Detects a bearish candle (close < open) that:
Closes below its midpoint (50% of the candle body).
Has a high higher than the previous candle's high.
Sell Logic 2: Identifies a bullish candle (close > open) that:
Closes below its midpoint (50% of the candle body).
Has a high higher than the previous candle's high.
Real-Time Alerts and Visual Cues:
Green triangles below candles indicate buy opportunities.
Red triangles above candles indicate sell opportunities.
Built-in alert conditions notify you of signals in real-time, so you never miss a trading opportunity.
Why Use Enigma Unlocked 2.0?
Precision: Advanced candlestick logic ensures that signals are generated only under optimal conditions.
Session-Based Filtering: Signals occur exclusively during the most active market sessions (kill zones), improving trade quality.
Visualization: Simple yet effective tools like Gann Box integration and clear visual signals make this indicator easy to use and highly effective.
Real-Time Alerts: Stay informed of potential trades even when you're away from your screen.
Enigma Unlocked 2.0 empowers traders to harness the power of candlestick analysis and session-based strategies for disciplined and effective trading. Pair this with a solid understanding of risk management and kill zones to achieve consistent results in your trading journey.

Turtle Soup ICT Strategy [TradingFinder] FVG + CHoCH/CSD🔵 Introduction
The ICT Turtle Soup trading setup, designed in the ICT style, operates by hunting or sweeping liquidity zones to exploit false breakouts and failed breakouts in key liquidity Zones, such as recent highs, lows, or major support and resistance levels.
This setup identifies moments when the price breaches these liquidity zones, triggering stop orders placed (Stop Hunt) by other traders, and then quickly reverses direction. These movements are often associated with liquidity sweeps that create temporary market imbalances.
The reversal is typically confirmed by one of three structural shifts : a Market Structure Shift (MSS), a Change of Character (CHoCH), or a break of the Change in State of Delivery (CISD). Each of these structural shifts provides a reliable signal to interpret market intent and align trading decisions with the expected price movement. After the structural shift, the price frequently pullback to a Fair Value Gap (FVG), offering a precise entry point for trades.
By integrating key concepts such as liquidity, liquidity sweeps, stop order activation, structural shifts (MSS, CHoCH, CISD), and price imbalances, the ICT Turtle Soup setup enables traders to identify reversal points and key entry zones with high accuracy.
This strategy is highly versatile, making it applicable across markets such as forex, stocks, cryptocurrencies, and futures. It offers traders a robust and systematic approach to understanding price movements and optimizing their trading strategies
🟣 Bullish and Bearish Setups
Bullish Setup : The price first sweeps below a Sell-Side Liquidity (SSL) zone, then reverses upward after forming an MSS or CHoCH, and finally pulls back to an FVG, creating a buying opportunity.
Bearish Setup : The price first sweeps above a Buy-Side Liquidity (BSL) zone, then reverses downward after forming an MSS or CHoCH, and finally pulls back to an FVG, creating a selling opportunity.
🔵 How to Use
To effectively utilize the ICT Turtle Soup trading setup, begin by identifying key liquidity zones, such as recent highs, lows, or support and resistance levels, in higher timeframes.
Then, monitor lower timeframes for a Liquidity Sweep and confirmation of a Market Structure Shift (MSS) or Change of Character (CHoCH).
After the structural shift, the price typically pulls back to an FVG, offering an optimal trade entry point. Below, the bullish and bearish setups are explained in detail.
🟣 Bullish Turtle Soup Setup
Identify Sell-Side Liquidity (SSL) : In a higher timeframe (e.g., 1-hour or 4-hour), identify recent price lows or support levels that serve as SSL zones, typically the location of stop-loss orders for traders.
Observe a Liquidity Sweep : On a lower timeframe (e.g., 15-minute or 30-minute), the price must move below one of these liquidity zones and then reverse. This movement indicates a liquidity sweep.
Confirm Market Structure Shift : After the price reversal, look for a structural shift (MSS or CHoCH) indicated by the formation of a Higher Low (HL) and Higher High (HH).
Enter the Trade : Once the structural shift is confirmed, the price typically pulls back to an FVG. Enter a buy trade in this zone, set a stop-loss slightly below the recent low, and target Buy-Side Liquidity (BSL) in the higher timeframe for profit.
🟣 Bearish Turtle Soup Setup
Identify Buy-Side Liquidity (BSL) : In a higher timeframe, identify recent price highs or resistance levels that serve as BSL zones, typically the location of stop-loss orders for traders.
Observe a Liquidity Sweep : On a lower timeframe, the price must move above one of these liquidity zones and then reverse. This movement indicates a liquidity sweep.
Confirm Market Structure Shift : After the price reversal, look for a structural shift (MSS or CHoCH) indicated by the formation of a Lower High (LH) and Lower Low (LL).
Enter the Trade : Once the structural shift is confirmed, the price typically pulls back to an FVG. Enter a sell trade in this zone, set a stop-loss slightly above the recent high, and target Sell-Side Liquidity (SSL) in the higher timeframe for profit.
🔵 Settings
Higher TimeFrame Levels : This setting allows you to specify the higher timeframe (e.g., 1-hour, 4-hour, or daily) for identifying key liquidity zones.
Swing period : You can set the swing detection period.
Max Swing Back Method : It is in two modes "All" and "Custom". If it is in "All" mode, it will check all swings, and if it is in "Custom" mode, it will check the swings to the extent you determine.
Max Swing Back : You can set the number of swings that will go back for checking.
FVG Length : Default is 120 Bar.
MSS Length : Default is 80 Bar.
FVG Filter : This refines the number of identified FVG areas based on a specified algorithm to focus on higher quality signals and reduce noise.
Types of FVG filter s:
Very Aggressive Filter: Adds a condition where, for an upward FVG, the last candle's highest price must exceed the middle candle's highest price, and for a downward FVG, the last candle's lowest price must be lower than the middle candle's lowest price. This minimally filters out FVGs.
Aggressive Filter: Builds on the Very Aggressive mode by ensuring the middle candle is not too small, filtering out more FVGs.
Defensive Filter: Adds criteria regarding the size and structure of the middle candle, requiring it to have a substantial body and specific polarity conditions, filtering out a significant number of FVGs.
Very Defensive Filter: Further refines filtering by ensuring the first and third candles are not small-bodied doji candles, retaining only the highest quality signals.
In the indicator settings, you can customize the visibility of various elements, including MSS, FVG, and HTF Levels. Additionally, the color of each element can be adjusted to match your preferences. This feature allows traders to tailor the chart display to their specific needs, enhancing focus on the key data relevant to their strategy.
🔵 Conclusion
The ICT Turtle Soup trading setup is a powerful tool in the ICT style, enabling traders to exploit false breakouts in key liquidity zones. By combining concepts of liquidity, liquidity sweeps, market structure shifts (MSS and CHoCH), and pullbacks to FVG, this setup helps traders identify precise reversal points and execute trades with reduced risk and increased accuracy.
With applications across various markets, including forex, stocks, crypto, and futures, and its customizable indicator settings, the ICT Turtle Soup setup is ideal for both beginner and advanced traders. By accurately identifying liquidity zones in higher timeframes and confirming structure shifts in lower timeframes, this setup provides a reliable strategy for navigating volatile market conditions.
Ultimately, success with this setup requires consistent practice, precise market analysis, and proper risk management, empowering traders to make smarter decisions and achieve their trading goals.

MACD Buy/Sell Labels + Barcolor👉 MACD Buy/Sell Labels + Barcolor
This advanced indicator combines the functionality of the MACD (Moving Average Convergence Divergence) with intuitive and customizable visual features, making it ideal for traders looking for an efficient tool to confirm buy and sell signals across any market.
It is based on the logical interpretation of a modified oscillator to improve its performance and simplify its usage. The indicator integrates seamlessly into the chart, offering an intuitive and easy-to-understand experience.
📍 Labels (Buy/Sell):
The signals are generated automatically by crossovers between the Fast EMA and Slow EMA of the Gaussian MACD. It comes with a default configuration designed to favor clean crossovers while avoiding false signals.
🧪 Barcolor:
The color of the candles dynamically changes according to the range of the Gaussian MACD histogram. This allows for a clear visualization of the MACD's status without needing to display the full oscillator. This feature integrates with the labels, as explained in the "Interpretation" section, to significantly increase their probability of success. Both the ranges and colors are fully customizable through the settings panel.
⚙️ Settings:
All aspects of the indicator can be customized:
1-MACD: Like a standard MACD, you can adjust the EMA lengths and the signal smoothing to adapt it to your trading style and the markets you trade.
2-Barcolor: The predefined values highlight extreme levels for proper interpretation, as explained in the "Interpretation" section. However, intermediate levels are also included in case you want to implement them in your strategy. You can adjust these values based on what you consider "overbought" or "oversold." This flexibility allows adaptation to various assets, as oscillator behavior varies across different instruments.
3-Buy/Sell Filter:
The filter settings allow you to further refine the signals. The default values of -70 (Buy Filter) and 80 (Sell Filter) work best for me, but you can adjust them as you see fit. Keep in mind:
-Higher distance from zero: More filtered signals (fewer, but higher quality).
-Closer to zero: Less filtered signals (more frequent, but with increased risk of false signals).
🤔 Interpretation:
As mentioned earlier, this follows the classic interpretation of a MACD oscillator: overbought/oversold levels combined with crossovers. However, the barcolor variable is what makes this indicator truly unique.
With barcolor, you can detect potential divergences and confirm them using the labels. When the oscillator reaches an extreme zone, barcolor provides a visual alert. Once the oscillator exits this zone, the candles revert to their normal color. This signals that the oscillator is dropping. If the price continues rising, this divergence can indicate an anomaly in the market. Waiting for confirmation from the label increases the probability of successful trades while detecting unusual market deviations without even looking at the oscillator.
Purpose:
This indicator is designed to help traders simplify the interpretation of the MACD. It can be used on any timeframe, but it was primarily tested using technical analysis concepts and basic liquidity principles. Its effectiveness improves significantly if you understand broader market dynamics.
Disclaimer:
This is purely an analytical tool and should NOT be considered as trading signals. Perform your own research and make decisions based solely on your responsibility. Thank you!

Up and Downwhat is "Up and Down"?
It is an indicator designed to show you in detail on the chart and warn you when there is an increase or decrease in the market at a level that you consider important.
what it does?
When the price difference between a top and bottom is greater than the level you selected (the default input is 10 percent), it indicates this along with the percentage value on the chart. Then, it indicates the start and end points with lines so that you can see the change from where to where. It shows the price's current percentage distance from the last bottom or top in the upper right corner.
it also colors the candles so you can better understand how fast the price is moving. The greener the candles, the stronger the rise, and conversely, the greater the decline, the redder the candles. Of course, if you set an alarm, it will tell you in which trading pair, in which time period, at what percentage and in which direction there is a movement.
how it does it?
It uses a moving average with a short length to find bottoms and tops. It then measures the distance from the last peak to the bottom and expresses it as a percentage. It uses momentum using the moving average as a source to paint the candles. To compress this momentum between the values 255 and 0, I used a formula that I also used in my limited fisher transform work (because the inputs in the color.rgb function take values between 0 and 255). It was a bit challenging to use the lines correctly, but with the "ta.valuewhen" function and a little experimenting, they were I made sure they were drawn correctly.
how to use it?
It is quite simple to use. First, select the minimum interval you want to receive alarms. If you make this value too high, you will not receive any alarms; if you make it too low, you will receive too many alarms. Choose the range that will benefit you most for the trading pair you are using. Then all you have to do is set an alarm. When you set an alarm, leave the note section blank and the indicator will send you the necessary information.

Dynamic RSI with Overbought/Oversold LinesDynamic RSI with Overbought/Oversold Lines
This indicator enhances the traditional RSI (Relative Strength Index) by dynamically adjusting the overbought and oversold levels based on the highest and lowest RSI values over a user-defined period. The indicator plots these levels as horizontal lines, allowing traders to visually identify when the market is "overbought" or "oversold."
Features:
Dynamic Overbought/Oversold Levels: Automatically adjusts the overbought and oversold levels based on the highest and lowest RSI values within the defined period, ensuring more accurate signals tailored to the current market conditions.
Customizable RSI Period: Choose your preferred RSI period to suit your trading strategy.
Signal Alerts: Visual signals are displayed when the RSI crosses into the overbought or oversold zone, indicating potential reversal points.
Background Color Alerts: The background changes color when the RSI exceeds overbought or oversold levels, making it easier to spot these important zones at a glance.
Clean and Simple: A minimalist design focusing on the key elements, making it suitable for all traders.
How to Use:
Overbought Zone: When the RSI moves above the overbought line (red), it may indicate that the asset is overbought, signaling a potential price reversal or pullback.
Oversold Zone: When the RSI moves below the oversold line (green), it may indicate that the asset is oversold, signaling a potential price bounce or reversal.
This dynamic RSI indicator is perfect for those looking to capture market extremes and improve their trading decisions. It's especially useful for timeframes like 30-minute and 1-hour charts, where market conditions tend to shift more rapidly.

Samih Signal AV V2The Samih Signal VA indicator is built for traders who prioritize technical analysis to determine market entry and exit points. It combines signals based on volume, moving averages, the Volume Weighted Average Price (VWAP), and identifies specific candlestick patterns, such as the Pin Bar and Inside Bar. This indicator assists in spotting optimal moments to buy or sell by analyzing trends, volume activity, and nearby liquidity zones.
Parameters and Features:
Simple Moving Average (MA) and VWAP:
Samih Signal VA uses a 50-period simple moving average for trend identification, paired with VWAP to refine price analysis with volume-weighted data.
Together, these components reveal whether the market is trending upward or downward, strengthening the reliability of entry and exit signals.
Volume Threshold:
A volume filter is applied by calculating a 20-period moving average, then setting a threshold at 1.2 times this average volume. This filter helps prevent false signals, focusing only on periods of increased market interest.
Candlestick Pattern Recognition:
Pin Bar: Detects this popular reversal/continuation pattern in both bullish and bearish scenarios, indicating potential entry or exit points.
Inside Bar: Identifies this pattern, which represents a moment of price compression and indecision, often preceding a breakout.
Trend Identification:
The indicator defines an uptrend when the price remains above both the MA and VWAP. A downtrend is confirmed when the price stays below these indicators.
Liquidity Zone Detection:
Samih Signal VA includes a feature to approximate liquidity zones, identifying recent support and resistance levels. Recognizing when prices approach these areas enhances the accuracy of buy or sell signals.
Buy and Sell Signal Logic:
Buy Signal: Triggered when a bullish Pin Bar or Inside Bar appears in an uptrend with high volume and proximity to a liquidity zone.
Sell Signal: Generated when a bearish Pin Bar or Inside Bar is detected in a downtrend with high volume, near a liquidity zone.
Signal Display on the Chart:
The indicator marks buy signals with a green “BUY” label below the bar, and sell signals with a red “SELL” label above the bar, directly on the chart for immediate clarity.
Summary:
The Samih Signal VA is suited for traders focused on precise entries and exits, integrating trend analysis, volume metrics, and candlestick patterns. By identifying liquidity zones, this indicator reduces the likelihood of false signals and provides clear buy and sell alerts.
This description can be easily added to TradingView to help users understand the features and decision-making logic of the Samih Signal VA indicator. Let me know if you’d like any additional adjustments!
Enhanced Pressure MTF ScreenerEnhanced Pressure Multi-Timeframe (MTF) Screener Indicator
Overview
The Enhanced Pressure MTF Screener is an add-on that extends the capabilities of the Enhanced Buy/Sell Pressure, Volume, and Trend Bar Analysis . It provides a clear and consolidated view of buy/sell pressure across multiple timeframes. This indicator allows traders to determine when different timeframes are synchronized in the same trend direction, which is particularly useful for making high-confidence trading decisions.
Image below: is the Enhanced Buy/Sell Pressure, Volume, and Trend Bar Analysis with the Enhanced Pressure MTF Screener indicator both active together.
Key Features
1.Multi-Timeframe Analysis
The indicator screens various predefined timeframes (from 1 week down to 10 minutes).
It offers a table view that shows buy or sell ratings for each timeframe, making it easy to see which timeframes are aligned.
Traders can choose which timeframes to include based on their trading strategies (e.g., higher timeframes for position trading, lower timeframes for scalping).
2.Pressure and Trend Calculation
Uses Buy and Sell Pressure calculations from the Enhanced Buy/Sell Pressure indicator to determine whether buying or selling is dominant in each timeframe.
By analyzing pressures on multiple timeframes, the indicator gives a comprehensive perspective of the current market sentiment.
The indicator calculates whether a move is strong based on user-defined thresholds, which are displayed in the form of additional signals.
3.Heikin Ashi Option
The Heikin Ashi candle type can be toggled on or off. Using Heikin Ashi helps smooth out market noise and provides a clearer indication of trend direction.
This is particularly helpful for traders who want to filter out market noise and focus on the primary trend.
4.Table Customization
Table Positioning: The table showing timeframe data can be positioned at different locations on the chart—top, middle, or bottom.
Text and Alignment: The alignment and text size of the table can be customized for better visual clarity.
Color Settings: Users can choose specific colors to indicate buying and selling pressure across timeframes, making it easy to interpret.
5.Strong Movement Indicators
The screener provides an additional visual cue (🔥) for timeframes where the movement is deemed strong, based on a user-defined threshold.
This helps highlight timeframes where significant buying or selling pressure is present, which could signal potential trading opportunities.
How the Screener Works
1.Pressure Calculation
For each selected timeframe, the indicator retrieves the Open, High, Low, and Close (OHLC) values.
It calculates buy pressure (the range between high and low when the closing price is higher than the opening) and sell pressure (the range between high and low when the closing price is equal to or lower than the opening).
The screener computes the pressure ratio, which represents the difference between buying and selling pressure, to determine which side is dominant.
2.Trend Rating and Signal Generation
Based on the calculated pressure, the screener determines a trend rating for each timeframe: "Buy," "Sell," or "Neutral." (▲ ,▼ or •)
Additionally, it generates a signal (▲ or ▼) to indicate the current trend direction and whether the move is strong (based on the user-defined threshold).
If the movement is strong, a fire icon (🔥) is added to indicate that there is significant pressure on that timeframe, signaling a higher confidence in the trend.
3.Customizable Strong Move Thresholds
Strong Move Threshold: The screener uses this value to decide whether a trend is significantly strong. A higher value makes it more selective in determining strong moves.
Strong Movement Threshold: Helps determine when an additional strong signal should be displayed, offering further insight into the strength of market movement.
Inputs and Customization
The Enhanced Pressure MTF Screener is highly customizable to fit the needs of individual traders:
General Settings:
Use Heikin Ashi: Toggle this setting to use Heikin Ashi for a smoother trend representation.
Strong Move Threshold: Defines how strong a move should be to be considered significant.
Strong Movement Threshold: Specifies the level of pressure required to highlight a move with the fire icon.
Table Settings:
Position: Choose the vertical position of the screener table (top, middle, or bottom of the chart).
Alignment: Align the table (left, center, or right) to best suit your chart layout.
Text Size: Adjust the text size in the table for better readability.
Table Color Settings:
Users can set different colors to represent buying and selling signals for better visual clarity, particularly when scanning multiple timeframes.
Timeframe Settings:
The screener provides options to include up to ten different timeframes. Traders can select and customize each timeframe to match their strategy.
Examples of available timeframes include 1 Week, 1 Day, 12 Hours, down to 10 Minutes, allowing for both broad and detailed analysis.
Practical Use Case
Identifying Trend Alignment Across Timeframes:
Imagine you are about to take a long trade but want to make sure that the trend direction is aligned across multiple timeframes.
The screener displays "Buy" ratings across the 4H, 1H, 30M, and 10M timeframes, while higher timeframes (like 1W and 1D) also show "Buy" with strong signals (🔥). This indicates that buying pressure is strong across the board, adding confidence to your trade.
Spotting Reversal Opportunities:
If a downtrend is evident across most timeframes but suddenly a higher timeframe, such as 12H, changes to "Buy" while showing a strong move (🔥), this could indicate a potential reversal.
The screener allows you to spot these discrepancies and consider taking early action.
Benefits for Traders
1.Synchronization Across Timeframes:
One of the main strengths of this screener is its ability to show synchronized buy/sell signals across different timeframes. This makes it easy to confirm the strength and consistency of a trend.
For example, if you see that all the selected timeframes display "Buy," this implies that both short-term and long-term traders are favoring the upside, giving additional confidence to go long.
2.Quick and Visual Trend Overview:
The table offers an at-a-glance summary, reducing the time required to manually inspect each timeframe.
This makes it particularly useful for traders who want to make quick decisions, such as day traders or scalpers.
3.Strong Move Indicator:
The use of fire icons (🔥) provides an easy way to identify significant movements. This is particularly helpful for traders looking for breakouts or strong market conditions that could lead to high probability trades.
To put it short or to summarize
The Enhanced Pressure MTF Screener is a powerful add-on for traders looking to understand how buy and sell pressure aligns across multiple timeframes. It offers:
A clear summary of buying or selling pressure across different timeframes.
Heikin Ashi smoothing, providing an option to reduce market noise.
Strong movement signals to highlight significant trading opportunities.
Customizable settings to fit any trading strategy or style.
The screener and the main indicator are best used together, as the screener provides the multi-timeframe overview, while the main indicator provides an in-depth look at each individual bar and trend.
I hope my indicator helps with your trading, if you guys have any ideas or questions there is the comment section :D

Stoch RSI and RSI Buy/Sell Signals with MACD Trend FilterDescription of the Indicator
This Pine Script is designed to provide traders with buy and sell signals based on the combination of Stochastic RSI, RSI, and MACD indicators, enhanced by the confirmation of candle colors. The primary goal is to facilitate informed trading decisions in various market conditions by utilizing different indicators and their interactions. The script allows customization of various parameters, providing flexibility for traders to adapt it to their specific trading styles.
Usefulness
This indicator is not just a mashup of existing indicators; it integrates the functionality of multiple momentum and trend-detection methods into a cohesive trading tool. The combination of Stochastic RSI, RSI, and MACD offers a well-rounded approach to analyzing market conditions, allowing traders to identify entry and exit points effectively. The inclusion of color-coded signals (strong vs. weak) further enhances its utility by providing visual cues about the strength of the signals.
How to Use This Indicator
Input Settings: Adjust the parameters for the Stochastic RSI, RSI, and MACD to fit your trading style. Set the overbought/oversold levels according to your risk tolerance.
Signal Colors:
Strong Buy Signal: Indicated by a green label and confirmed by a green candle (close > open).
Weak Buy Signal: Indicated by a blue label and confirmed by a green candle (close > open).
Strong Sell Signal: Indicated by a red label and confirmed by a red candle (close < open).
Weak Sell Signal: Indicated by an orange label and confirmed by a red candle (close < open).
Example Trading Strategy Using This Indicator
To effectively use this indicator as part of your trading strategy, follow these detailed steps:
Setup:
Timeframe : Select a timeframe that aligns with your trading style (e.g., 15-minute for intraday, 1-hour for swing trading, or daily for longer-term positions).
Indicator Settings : Customize the Stochastic RSI, RSI, and MACD parameters to suit your trading approach. Adjust overbought/oversold levels to match your risk tolerance.
Strategy:
1. Strong Buy Entry Criteria :
Wait for a strong buy signal (green label) when the RSI is at or below the oversold level (e.g., ≤ 35), indicating a deeply oversold market. Confirm that the MACD shows a decreasing trend (bearish momentum weakening) to validate a potential reversal. Ensure the current candle is green (close > open) if candle color confirmation is enabled.
Example Use : On a 1-hour chart, if the RSI drops below 35, MACD shows three consecutive bars of decreasing negative momentum, and a green candle forms, enter a buy position. This setup signals a robust entry with strong momentum backing it.
2. Weak Buy Entry Criteria :
Monitor for weak buy signals (blue label) when RSI is above the oversold level but still below the neutral (e.g., between 36 and 50). This indicates a market recovering from an oversold state but not fully reversing yet. These signals can be used for early entries with additional confirmations, such as support levels or higher timeframe trends.
Example Use : On the same 1-hour chart, if RSI is at 45, the MACD shows momentum stabilizing (not necessarily negative), and a green candle appears, consider a partial or cautious entry. Use this as an early warning for a potential bullish move, especially when higher timeframe indicators align.
3. Strong Sell Entry Criteria :
Look for a strong sell signal (red label) when RSI is at or above the overbought level (e.g., ≥ 65), signaling a strong overbought condition. The MACD should show three consecutive bars of increasing positive momentum to indicate that the bullish trend is weakening. Ensure the current candle is red (close < open) if candle color confirmation is enabled.
Example Use : If RSI reaches 70, MACD shows increasing momentum that starts to level off, and a red candle forms on a 1-hour chart, initiate a short position with a stop loss set above recent resistance. This is a high-confidence signal for potential price reversal or pullback.
4. Weak Sell Entry Criteria :
Use weak sell signals (orange label) when RSI is between the neutral and overbought levels (e.g., between 50 and 64). These can indicate potential short opportunities that might not yet be fully mature but are worth monitoring. Look for other confirmations like resistance levels or trendline touches to strengthen the signal.
Example Use : If RSI reads 60 on a 1-hour chart, and the MACD shows slight positive momentum with signs of slowing down, place a cautious sell position or scale out of existing long positions. This setup allows you to prepare for a possible downtrend.
Trade Management:
Stop Loss : For buy trades, place stop losses below recent swing lows. For sell trades, set stops above recent swing highs to manage risk effectively.
Take Profit : Target nearby resistance or support levels, apply risk-to-reward ratios (e.g., 1:2), or use trailing stops to lock in profits as price moves in your favor.
Confirmation : Align these signals with broader trends on higher timeframes. For example, if you receive a weak buy signal on a 15-minute chart, check the 1-hour or daily chart to ensure the overall trend is not bearish.
Real-World Example: Imagine trading on a 15-minute chart :
For a buy:
A strong buy signal (green) appears when the RSI dips to 32, MACD shows declining bearish momentum, and a green candle forms. Enter a buy position with a stop loss below the most recent support level.
Alternatively, a weak buy signal (blue) appears when RSI is at 47. Use this as a signal to start monitoring the market closely or enter a smaller position if other indicators (like support and volume analysis) align.
For a sell:
A strong sell signal (red) with RSI at 72 and a red candle signals to short with conviction. Place your stop loss just above the last peak.
A weak sell signal (orange) with RSI at 62 might prompt caution but can still be acted on if confirmed by declining volume or touching a resistance level.
These strategies show how to blend both strong and weak signals into your trading for more nuanced decision-making.
Technical Analysis of the Code
1. Stochastic RSI Calculation:
The script calculates the Stochastic RSI (stochRsiK) using the RSI as input and smooths it with a moving average (stochRsiD).
Code Explanation : ta.stoch(rsi, rsi, rsi, stochLength) computes the Stochastic RSI, and ta.sma(stochRsiK, stochSmoothing) applies smoothing.
2. RSI Calculation :
The RSI is computed over a user-defined period and checks for overbought or oversold conditions.
Code Explanation : rsi = ta.rsi(close, rsiLength) calculates RSI values.
3. MACD Trend Filter :
MACD is calculated with fast, slow, and signal lengths, identifying trends via three consecutive bars moving in the same direction.
Code Explanation : = ta.macd(close, macdLengthFast, macdLengthSlow, macdSignalLength) sets MACD values. Conditions like macdLine < macdLine confirm trends.
4. Buy and Sell Conditions :
The script checks Stochastic RSI, RSI, and MACD values to set buy/sell flags. Candle color filters further confirm valid entries.
Code Explanation : buyConditionMet and sellConditionMet logically check all conditions and toggles (enableStochCondition, enableRSICondition, etc.).
5. Signal Flags and Confirmation :
Flags track when conditions are met and ensure signals only appear on appropriate candle colors.
Code Explanation : Conditional blocks (if statements) update buyFlag and sellFlag.
6. Labels and Alerts :
The indicator plots "BUY" or "SELL" labels with the RSI value when signals trigger and sets alerts through alertcondition().
Code Explanation : label.new() displays the signal, color-coded for strength based on RSI.
NOTE : All strategies can be enabled or disabled in the settings, allowing traders to customize the indicator to their preferences and trading styles.

Weekly RSI Buy/Sell SignalsWeekly RSI Buy/Sell Signal Indicator
This indicator is designed to help traders identify high-probability buy and sell opportunities on the weekly chart by using the Relative Strength Index (RSI). By utilizing weekly RSI values, this indicator ensures signals align with broader market trends, providing a clearer view of potential price reversals and continuation.
How It Works:
Weekly RSI Calculation: This script calculates the RSI using a 14-period setting, focusing on the weekly timeframe regardless of the user’s current chart view. The weekly RSI is derived using request.security, allowing for consistent signals even on intraday charts.
Signal Conditions:
Buy Signal: A buy signal appears when the RSI crosses above the oversold threshold of 30, suggesting that price may be gaining momentum after a potential bottom.
Sell Signal: A sell signal triggers when the RSI crosses below the overbought threshold of 70, indicating a possible momentum shift downwards.
Visual Cues:
Buy/Sell Markers: Clear green "BUY" and red "SELL" markers are displayed on the chart when buy or sell conditions are met, making it easy to identify entry and exit points.
RSI Line and Thresholds: The weekly RSI value is plotted in real time with color-coded horizontal lines at 30 (oversold) and 70 (overbought), providing a visual reference for key levels.
This indicator is ideal for traders looking for reliable, trend-based signals on higher timeframes and can be a helpful tool for filtering out shorter-term market noise.
