High Performance Candlestick Patterns Colors//Candle Patterns Ranked by Performance THOMAS N. BULKOWSKI
//1. Bearish Three Line Strike +Up 67.38%
//2. Bullish Three Line Strike -Down 65.23%
//3. Bearish Three Black Crows -Down 59.83%
//4. Bearish Evening Star -Down 55.85%
//5. Bullish Upside Tasuki Gap +Up 54.44%
//6. Bullish Inverted Hammer -Down 51.73%
//7. Bullish Matching Low -Down 50.00%
//8. Bullish Abandone Baby +Up 49.73%
//9. Bearish Two Black Gapping -Down 49.64%
//10. Brearish Breakaway -Down 49.24%
//11. Bullish Morning Star +Up 49.05%
//12. Bullish Piercing Line +Up 48.37%
//13. Bullish Stick Sandwich +Up 48.20%
//14. Bearish Thrusting Line During Dowtrend +Up 48.10%
//15. Bearish Meeting Line +Up 48.07%
//Down=Yellow Bar Color and Black Text
//Up=Blue Bar Color and Blue Text
//High Performance Candlestick Patterns Colors Top 15
Candle

High Performance Candlestick Patterns//Candle Patterns Ranked by Performance THOMAS N. BULKOWSKI
//1. Bearish Three Line Strike +Up 67.38%
//2. Bullish Three Line Strike -Down 65.23%
//3. Bearish Three Black Crows -Down 59.83%
//4. Bearish Evening Star -Down 55.85%
//5. Bullish Upside Tasuki Gap +Up 54.44%
//6. Bullish Inverted Hammer -Down 51.73%
//7. Bullish Matching Low -Down 50.00%
//8. Bullish Abandone Baby +Up 49.73%
//9. Bearish Two Black Gapping -Down 49.64%
//10. Brearish Breakaway -Down 49.24%
//11. Bullish Morning Star +Up 49.05%
//12. Bullish Piercing Line +Up 48.37%
//13. Bullish Stick Sandwich +Up 48.20%
//14. Bearish Thrusting Line During Dowtrend +Up 48.10%
//15. Bearish Meeting Line +Up 48.07%
//Down=Yellow Bar Color and Black Text
//Up=Blue Bar Color and Blue Text
//High Performance Candlestick Patterns Top 15

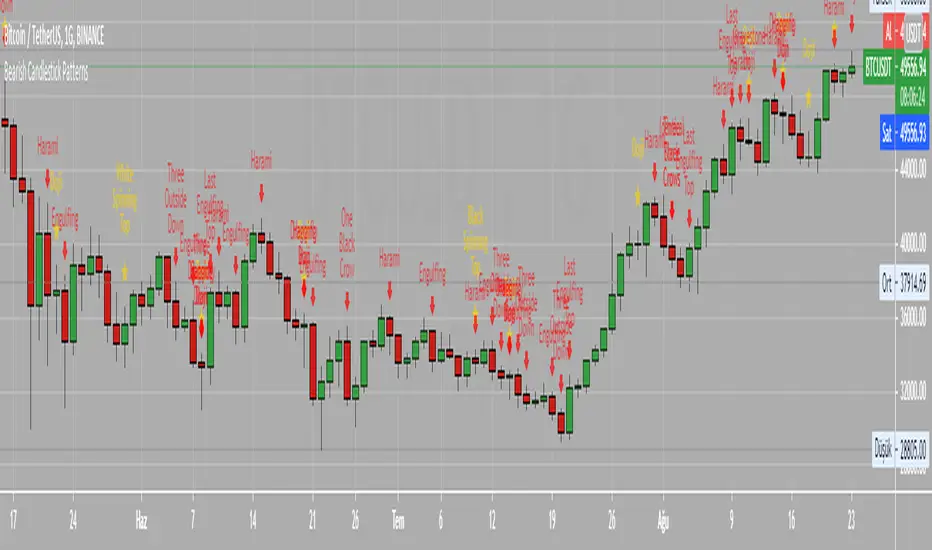
Bearish Candlestick PatternsDoji
Black Spinning Top
White Spinning Top
Bearish Abandoned Baby
Bearish Advance Block
Bearish Below The Stomach
Bearish Belt Hold
Bearish Breakaway
Bearish Counter Attack Lines
Bearish Dark Cloud Cover
Bearish Deliberation Blok
Bearish Descending Hawk
Bearish Doji Star
Bearish Downside Gap Three Methods
Bearish Downside Tasuki Gap
Bearish Dragonfly Doji
Bearish Engulfing
Bearish Evening Doji Star
Bearish Evening Star
Bearish Falling Three Methods
Bearish Falling Window
Bearish Gravestone Doji
Bearish Hanging Man
Bearish Harami
Bearish Harami Cross
Bearish Hook Reversal
Bearish Identical Three Crows
Bearish In Neck
Bearish Island Reversal
Bearish Kicking
Bearish Ladder Top
Bearish Last Engulfing Top
Bearish Low Price Gapping Play
Bearish Mat Hold
Bearish Matching High
Bearish Meeting Line
Bearish On Neck
Bearish One Black Crow
Bearish Separating Lines
Bearish Shooting Star
Bearish Side by side White Lines
Bearish Three Black Crows
Bearish Three Gap Up
Bearish Three Inside Down
Bearish Three Line Strike
Bearish Three Outside Down
Bearish Three Stars in the North
Bearish Thrusting Line During Dowtrend
Bearish Tower Top
Bearish Tristar
Bearish Tweezers Top
Bearish Two Black Gapping
Bearish Two Crows
Bearish Upside Gap Two Crows
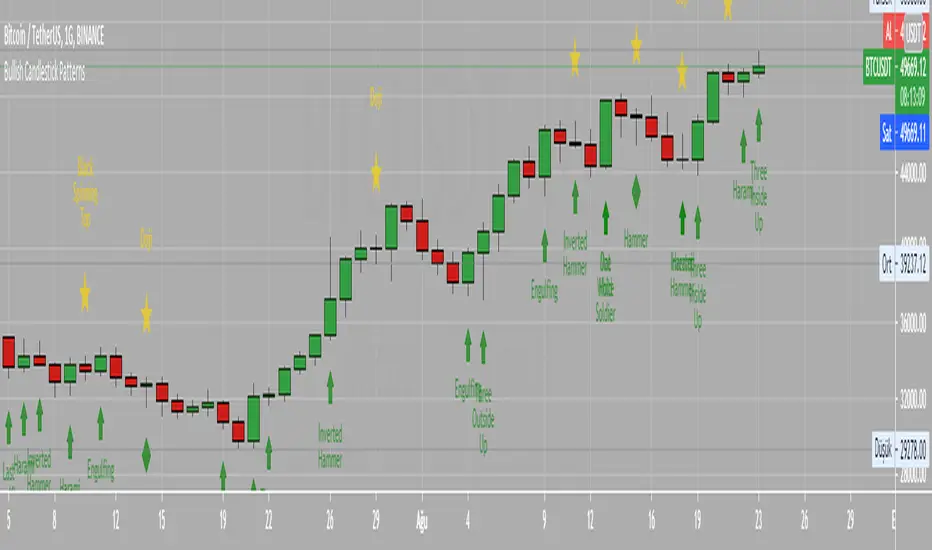
Bullish Candlestick PatternsBullish Abandone Baby
Bullish Above The Stomach
Bullish Belt Hold
Bullish Breakaway
Bullish Concealing Baby Swallow
Bullish Counterattack Lines
Bullish Deliberation Block
Bullish Descent Block
Bullish Doji Star
Bullish Downside Gap Two Rabbits
Bullish Dragonfly Doji
Bullish Engulfing
Bullish Hammer
Bullish Harami
Bullish Harami Cross
Bullish High Price Gapping Play
Bullish Homing Pigeon
Bullish Hook Reversal
Bullish Inverted Hammer
Bullish Island Reversal
Bullish Kicking
Bullish Ladder Bottom
Bullish Last Engulfing Bottom
Bullish Mat Hold
Bullish Matching Low
Bullish Meeting Line
Bullish Morning Doji Star
Bullish Morning Star
Bullish On Neck
Bullish One White Soldier
Bullish Piercing Line
Bullish Rising Three Methods
Bullish Rising Window
Bullish Separating Lines
Bullish Side by Side White Lines
Bullish Stick Sandwich
Bullish Takuri Line
Bullish Three Gap Downs
Bullish Three Inside Up
Bullish Three Line Strike
Bullish Three Outside Up
Bullish Three Stars in the South
Bullish Three White Soldiers
Bullish Thrusting Line During Uptrend
Bullish Tower Bottom
Bullish Tristar
Bullish Tweezers Bottom
Bullish Two Rabbits
Bullish Unique Three River Bottom
Bullish Upside Gap Three Methods
Bullish Upside Tasuki Gap
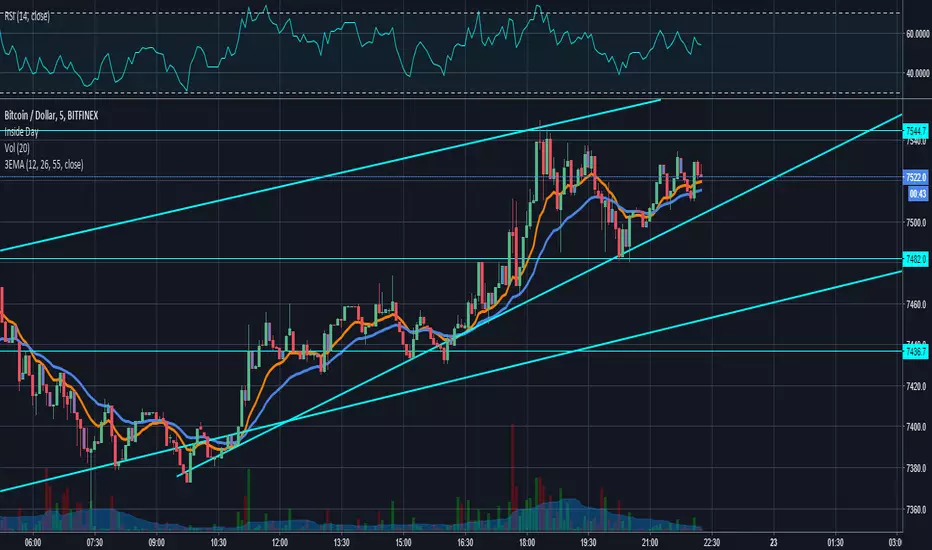
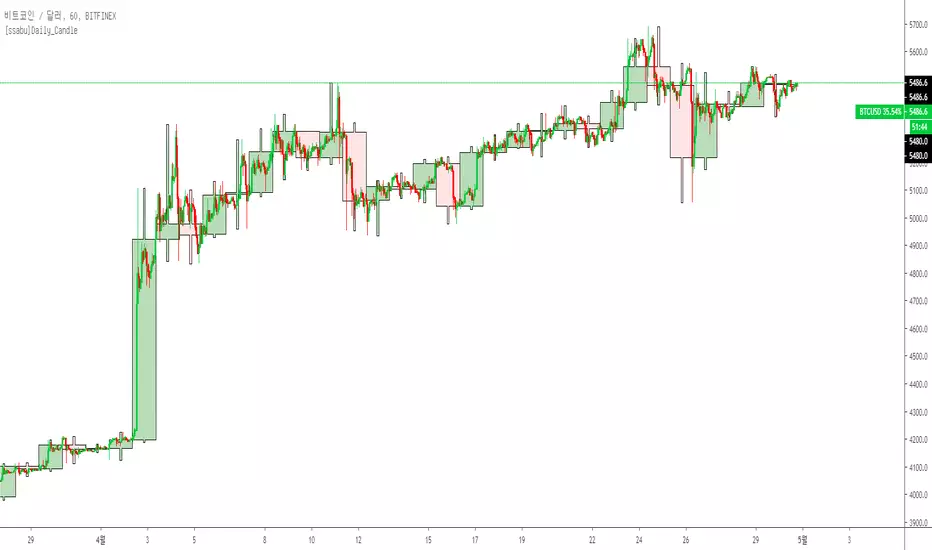
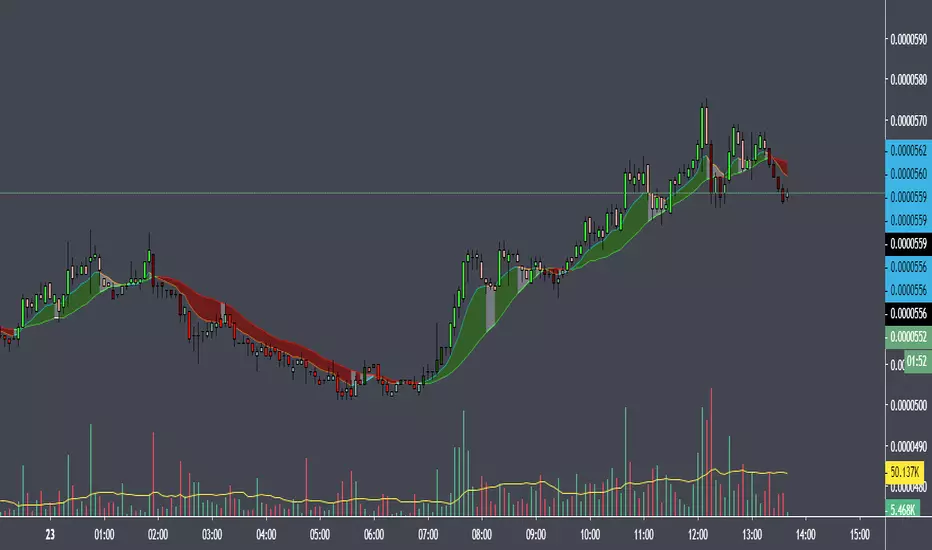
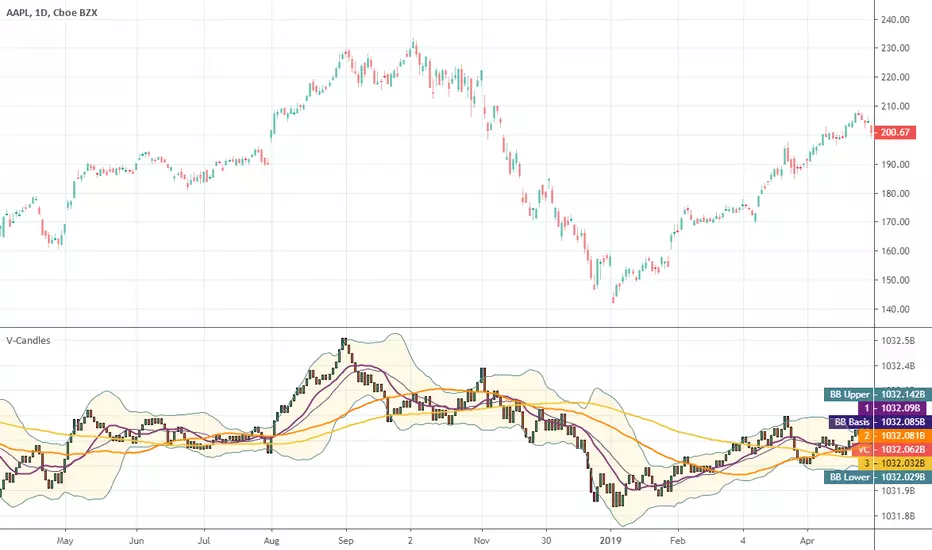
[ssabu]Daily_Candle_Indicator✅ Daily_Candle_Indicator
일봉보다 낮은 프레임에서 일봉의 캔들모습을 배경으로 함께 보여주는 보조지표 입니다.
상승 후에 일봉 상의 음봉에 해당하는 단기조정 및 하락추세 중 일봉상의 지지영역에 해당하는 구간 등등의 여러 구간에서 쓰임을 극대화 할 수 있습니다.
위의 차트 예시는 1시간봉 기준의 차트예시이고 일봉 이하의 모든 프레임에서 사용이 가능합니다.
It is a supplementary indicator that shows together the background of a candle in the frame from the frame lower than the one.
After the rise, you can maximize its use in various sections of the short-term adjustment and downward trend corresponding to the apron on the apron,
the section corresponding to the support area on the apron.
The chart example above is an example of a one-hour bar chart and can be used in all frames below one bar.

PA Extremely Early version
Experimenting with traditional "market structure" and candlestick patterns for trend analysis

Candlestick identificationThis is a first draft of a candlestick pattern recognition study. As of now individual candles and some two-candle patterns can be identified. More to come ...
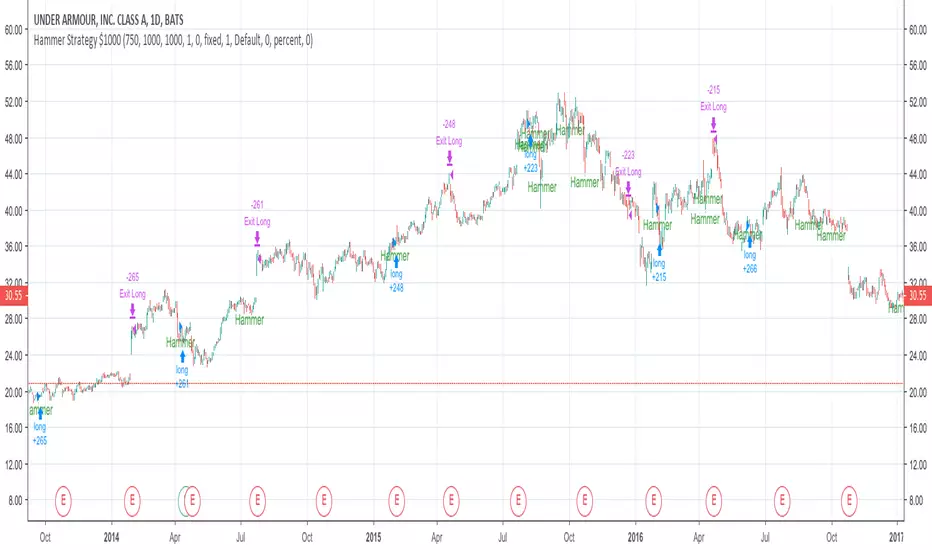
Basic Hammer StrategyThis is a basic strategy that will buy after a hammer is printed, and sell when a predetermined risk or reward price is hit. You can change the risk and reward values in the settings. Risk and reward values are in increments of $0.01. Default values are 75 ($0.75) and 200 ($2.00). If the strategy is producing losses, try adding a zero to the end of the risk value and the reward value. Example: Higher valued stocks may do better with a Risk of 750 ($7.50) and a Reward of 2000 ($20.00). Maybe even a Risk of 750 ($7.50) and reward of 1000 ($10.00). Play around with these values to get the best result for different charts. Initial investment is set to $1000
MA CandlesOHLC calculated with a moving average.
You can replace sma with anything. EMA, Hull, sma(sma(sma(sma(close, etc.
You could also make it look clean like Heikin Ashi candlesticks if you include min/max for low/high wicks on candles.

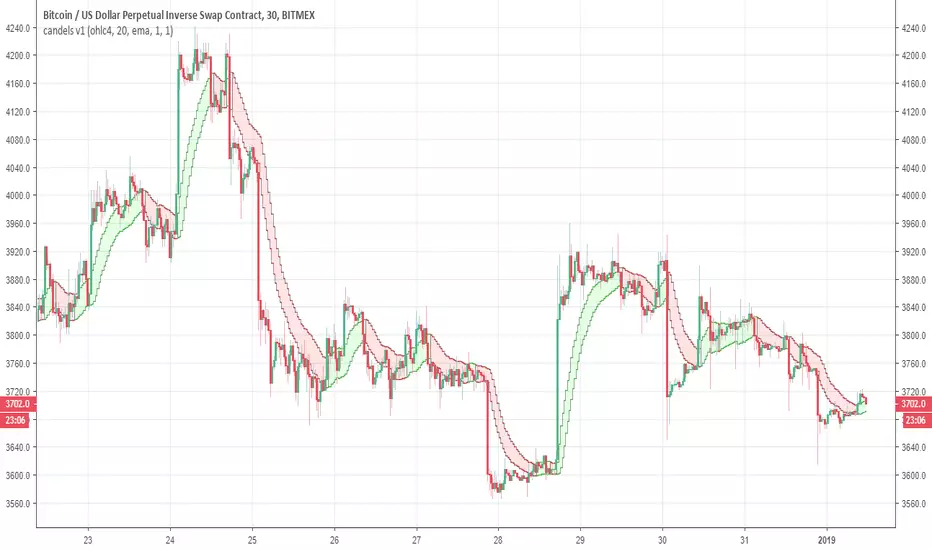
candels v1So this is a candel version with different smoothing methods (EMA ,KAMA 'WMA , ALMA etc)
you have option for MTF in the setting
the length is set to 1 -change it to the size you want (20 for example)
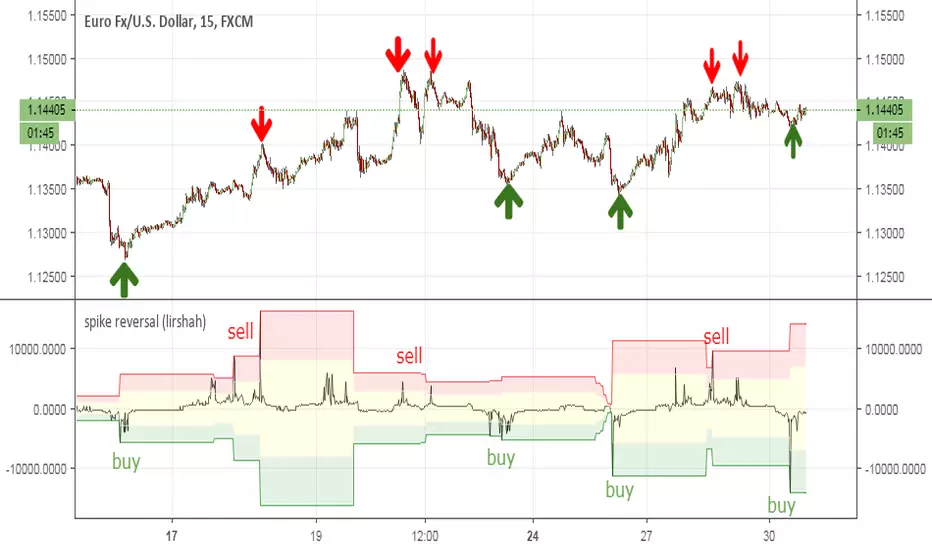
spike reversal (lirshah)spike reversal indicator is an innovation of lirshah programming team,
this indicator is combination of several indicators with candle sticks patterns.
good accuracy on reverse points and ease of interpretation are strong points of this indicator.
calculation of this indicator is based on opening price of each bar which means the value of indicator is constant on each candle and no repaints occur.
Directional filterThe idea is to show simply through colors "stronger or weaker" the relevance of candles in the current direction of the asset.
the indicator was made to be used in the graphics of 5m and 15m. based on the SMA20 already indicated previously and with a SMA20 of the graph of 60m.
candles will have their colors modified according to their relevance in the current trend, "A" through "D", where "A" is the strongest and "D" is the weakest.
Conditions:
Buy candle A: price closes above SMA20 (5m or 15m) and above SM20 of 60m.
Buy candle B: price closes above the SMA20 (5m or 15m) and below the SMA20 of 60m.
Buy candle C: Price closes below the SMA20 (5m or 15m) and above the SMA20 60m.
Buy candle D: price closes below the SMA20 (5m or 15m) and below the SMA20 of 60m.
Sell candle A: price closes below the SMA20 (5m or 15m) and below the SMA20 of 60m.
Sell candle B: price closes below the SMA20 (5m or 15m) and above the SMA20 of 60m.
Sell candle C: price closes above the SMA20 (5m or 15m) and below the SMA20 of 60m.
Sell candle D: price closes above the SMA20 (5m or 15m) and above the SMA20 of 60m.
Note 1: SMA8 and SMA200 are also inserted (but they do not interfere with the indicator)
Note 2:
I will leave an image with the colors that represent the relevance of each candle.
imageshack.com
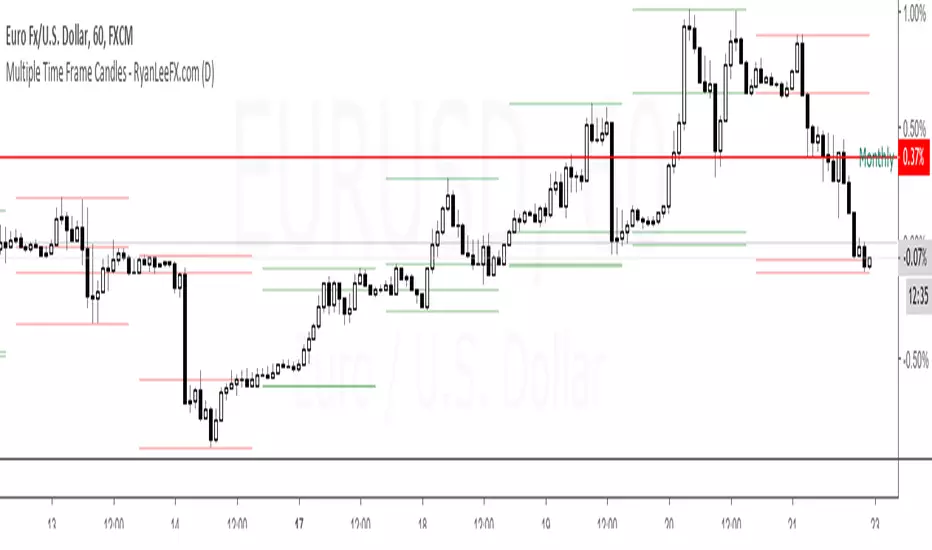
Multiple Time Frame Candles - RyanLeeFX.comMultiple Time Frame Candles is a unique script that allows traders to quickly and easily analyze price action candles across multiple time frames all from one chart. Multiple Time Frame Candles eliminates the need for price action traders to change chart time frames when trying to analyze multiple time frames. With this script, traders can easily see the candles from a lower time frame inside candles from a higher time frame.
For example, traders can see 1 Hour candles inside Daily candles. Or 5 Min candles inside Hourly candles. Or Daily candles inside Weekly candles. Or Hourly candles inside Daily candles inside Weekly candles. The options for comparing multiple time frame candles on one screen are almost limitless.
This script differs from other Multiple Time Frame Candle scripts by displaying the open, high, low and close of the larger time frame candle as well as highlighting the close price due to its proven importance.
The ability to quickly analyze multiple time frames from a single chart will make you more confident in your trades as well as save you valuable time during your analysis.
Multiple Time Frame Candles is also an amazing script to help beginning to experienced traders better visualize price movement across multiple time frames all from a single chart. Happy Trading!!
Candles HistoryA utility tool to get some metrics from the whole candles history.
Consider it as my Christmas gift to the community.
Available metrics
Starting Year
Starting Month
Starting Day
Starting Weekday
Starting Hour
Starting Minute
Highest Volume (works correctly only on the tickers with available volume data)
Lowest Volume (works correctly only on the tickers with available volume data)
Longest Candle Range
Average Candle Range
Longest Candle Body
Average Candle Body
Available Candles
Bullish Candles
Bullish Trend Candles (body >= range / 2)
Bearish Candles
Bearish Trend Candles (body >= range / 2)
Doji Candles
Bullish Marubozu Candles
Bearish Marubozu Candles
Longest Bullish Serie
Longest Bearish Serie
Good luck!

RSI Candles (with wicks)The script adds wicks to the RSI candle indicator.
It is based on the RSI candle indicator by cI8DH.
Note that the definition of these wicks is not unique.
The implementation uses an RSI calculated from the highs and lows for the wicks.

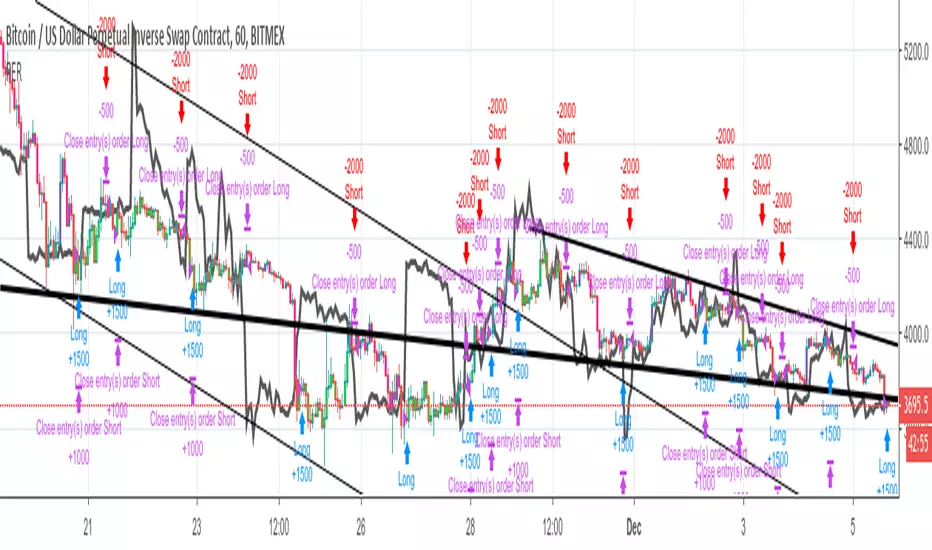
Relative Estimated Price KivanÇ version (Strategy) By Wicksell Thanks to the great work of KIVANÇ in the Relative Estimated Price REP by KIVANÇ fr3762, it has adapted modifications in the Lookback bar length, transformed into strategy, where a line determines a relative average price of XBTUSD, BTCUSD, ETHUSD and BCH.
the line is a calculation, where it involves reading previous candles where it determines what the current price should be.
When the REP line is above the candle, open buy and close sell, when it is below, open sell and close buy.
When setting which currency, do not forget to change the settings where they are:
1 - XBTUSD
2 - BTCUSD
3 - ETHUSD
4 - BCHBTC
may also be modified:
the Lookback bar length, stop loss settings, test date.
The best results are in the 1H time, with the default settings, but try to modify the data and if you find better results, I would be grateful if you post here.
Color CandlesUses 6 most common indicators to color candles when they give buy/sell signals.
Use line view to see candle colors.
Purple = 6 buy signals
Teal = 5 buy signals
Navy = 4 buy signals
Lime = 3 buy signals
Green = 2 buy signals
Pale Green = 1 Buy signal
White = neutral
Gray = 1 sell signal
Yellow = 2 sell signals
Orange = 3 sell signals
Red = 4 sell signals
Firebrick = 5 sell signals
Black = 6 sell signals
Parabolic SAR calculated as .02, .02, .2. Traditional Buy/Sell. Green/Red Dots.
Bollinger Band calculated as 20, 1. Buy/Sell when above or below band. Aqua filled band.
MACD calculated with emas 12, 26, 9. Traditional MACD/Signal cross Buy/Sell. Filled Blue/Orange band.
RSI length 14. Traditional Buy/Sell below 30 and above 70. Green/Yellow/Red line below price.
ADX/DI len 14. Traditional crossover Buy/Sell. Filled Lime/Green above price.
Stochastic 14/3/3. Traditional 20/80 Buy/Sell. Filled teal/orange above price.

Volume CandlesHello traders!
Well, I was trying to implement EquiVolume Charts that were developed by Richard W. Arms, but unfortunately I got a poor result.
Instead, I used my groundwork on EquiVolumes to create Volume Candles indicator to help you make better, smarter trades.
What are the cool features?
Excellently filters the instrument's movements
Gives a better view of the accumulation/distribution phases
Completely removes price gaps
Works on ANY instrument that has available volume data.
Personally, I am a big fan of the volume-based indicators and to clarify my position I cite the following words of Buff Pelz Dormeier from his book "Investing with Volume Analysis: Identify, Follow, and Profit from Trends" :
A trade produces only two pieces of information: the price and price's neglected sibling, volume. Perhaps the least appreciated piece of the puzzle, volume represents fertile ground for technical analysis. Proficiency in volume analysis is a rare skill. Properly understood, though, volume analysis can provide its practitioner with the power to peer deeply into market mechanics.
Benjamin Graham, the father of value investing and a mentor of Warren Buffett, often called the market a 'voting machine'. If so, then volume is the ballot box. Volume is a literal illustration of the power behind the forces of supply and demand.
Volume is understood as the validation of price, the source of liquidity, the substantiation of information, the fulfillment of convictions, the revelation of divergent opinions, the fuel of the market, the proponent of truth, and the energy behind the velocity of money. If you believe any of this information might be important in making an investment decision, volume analysis is important to you.
I attached some screenshots to show you how it works with other instruments.
Happy Trading!
Morning Star PatternMorning star is signal for ending of downtrend and starting of uptrend.
For detail:
www.onlinetradingconcepts.com

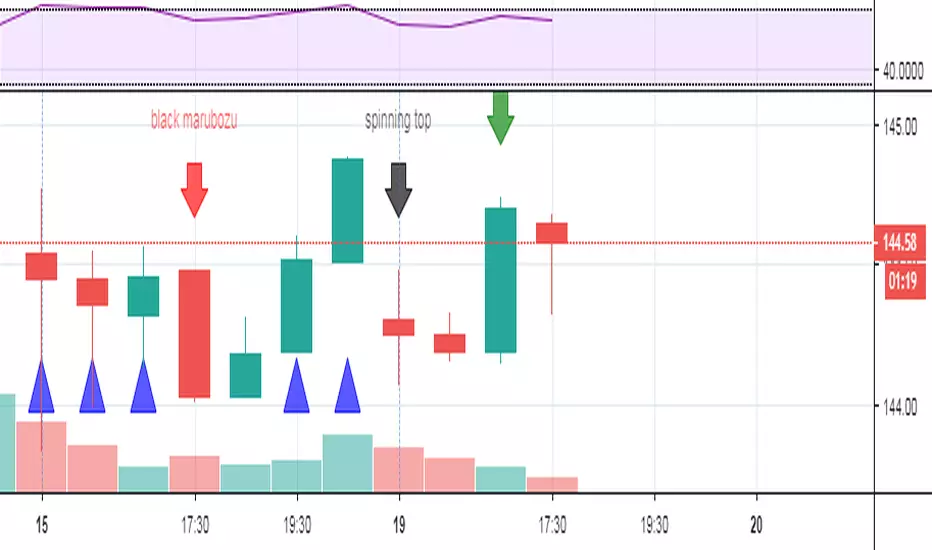
Bull/Bear CandleThis script will display a small triangle under the latest two candles to indicate whether that candle is bullish or bearish based on the following definition.
A bullish candle closes in the top portion of the trading range of the candle while a bearish candle closes in the bottom portion of the trading range of the candle.
The cutoff is currently set at 65% (you can adjust it) so the close must be outside or equal to 65% of the trading range to be considered bullish or bearish. If less than 65% the triangle will indicate a neutral candle.
Colours are;
green triangle = bullish candle
red triangle = bearish candle
yellow triangle = neutral candle
I hope this helps those using TraderCobb's cradle strategy.