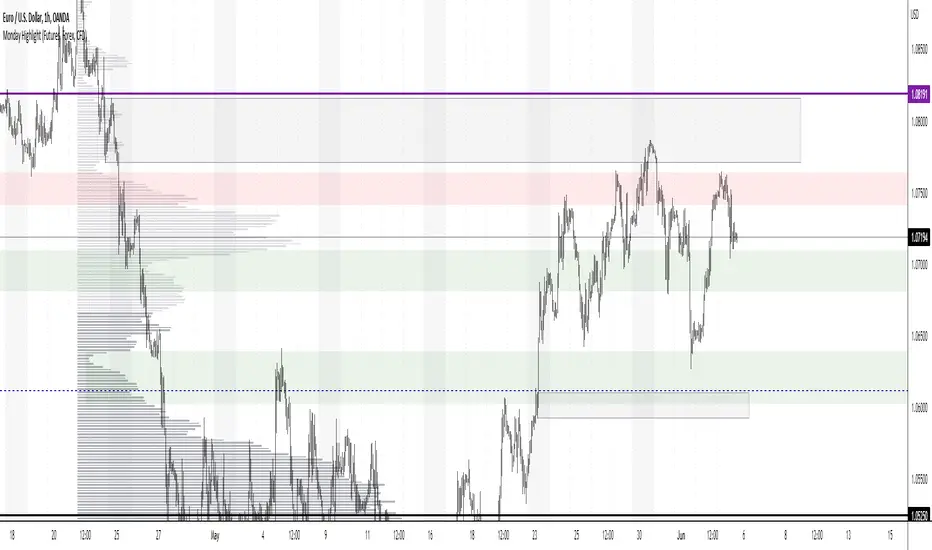
Monday Highlight (Futures, Forex, CFD)Hello Traders
This is a very simple indicator that will highlight the background vertically over every Monday for Futures, Forex and CFD markets. I use this indicator in all my technical analysis as it lets me very quickly see where each week begins without being too distracting. It can be easily customizable to whatever color, transparency level and visibility you want. Because of the way closing times are processed in different markets I could not make a single indicator to include all markets, but check out my second Monday Highlight indicator for Crypto and Stock markets.
Hope you find them useful and don't forget to add them to your "favorites" list for easy access.
CFD
CFD Ticks LevelsSimple but very effective script that finds areas of support and resistance through ticks exchange. Only works with CFDs
(You must enter in the settings the value corresponding to the CFD, example: US500 = 500, DAX30 = 30, FRANCE40 = 40 etc ...)
As usual, if you have any suggestions or bug reports don't hesitate.
Cheers

MACD Crossover with signalsMACD Crossover with signals - a simple trading indicator based on classic MACD.
It shows crossovers and plots them on chart as "Long" or "Short".
The MACD itself is not plotted in order to keep your charts cleaner.
By default, all the crossovers are displayed on the chart.
However, you can use only trend-based ones. They are filtered according to the trend (which is plotted and colored using 200 period EMA) and the "zero-line rule" of the MACD.
So if you consider using only trend-based signals, the indicator will only show Long signals on an uptrend and Short signals on a downtrend.
All signals/lines can be turned on/off and styled in the settings menu.
It can be used with all major timeframes and assets (crypto, fx, cfd, stocks, commodities etc).
Consider using it with respect to your trading style, money- and risk-management as well as other strategies and indicators.
If it was useful for you – hit the Like button and share it with your friends - it's free 😉

Buy/Sell ZonesEN:
This indicator is made to display main buy/sell zones of an asset. The core parameters are: Price, Volume and Donchian Channels.
It is more trend-based and may be suitable for swing traders or those who trade higher timeframes (1D and above).
The plotted colors display the dominance of buyers, sellers or indecision on the market at the current timeframe.
If the zone is green - consider opening Long/Buy positions.
If the zone is red - consider opening Short/Sell or scale out your position.
The white zone displays indecision between Bulls and Bears - consider not to take any trades within white zone.
RU:
Этот индикатор показывает зоны покупателя/продавца выбранного актива. Основные параметры расчета: Цена, Объем и Каналы Дончиана.
Он является индикатором трендового анализа и больше подходит для свинг-трейдеров или тех, кто торгует на старших таймфреймах (от 1Д).
Отображаемые цвета показывают доминацию продавца, покупателя или неопределенность на рынке в конкретный временной период.
Зеленая зона указывает на преобладание покупателя - возможно открытие длинных позиций/покупок .
Красная зона указывает на преобладание продавца - потенциальный момент для открытия коротких позиций/продаж или сокращения своих длинных позиций/покупок .
Белая зона указывает на неопределенность на рынке - в этой зоне лучше не предпринимать никаких торговых решений .
EN: This indicator may be used for Crypto markets
RU: Этот индикатор можно использовать для криптовалютных рынков
BITSTAMP:BTCUSD
BITSTAMP:ETHUSD
COINBASE:COMPUSD
EN: Stocks, CFD and commodities
RU: Акций, CFD и рынков сырьевых товаров
FOREXCOM:SPXUSD
NASDAQ:TSLA
NYSE:BA
NASDAQ:EBAY
FOREXCOM:XAUUSD
EN: Consider using it with respect to Your trading style, money- and risk-management as well as other indicators
RU: Используйте этот индикатор в соответствии со своим стилем торговли, риск-, мани-менеджментом и другими индикаторами.

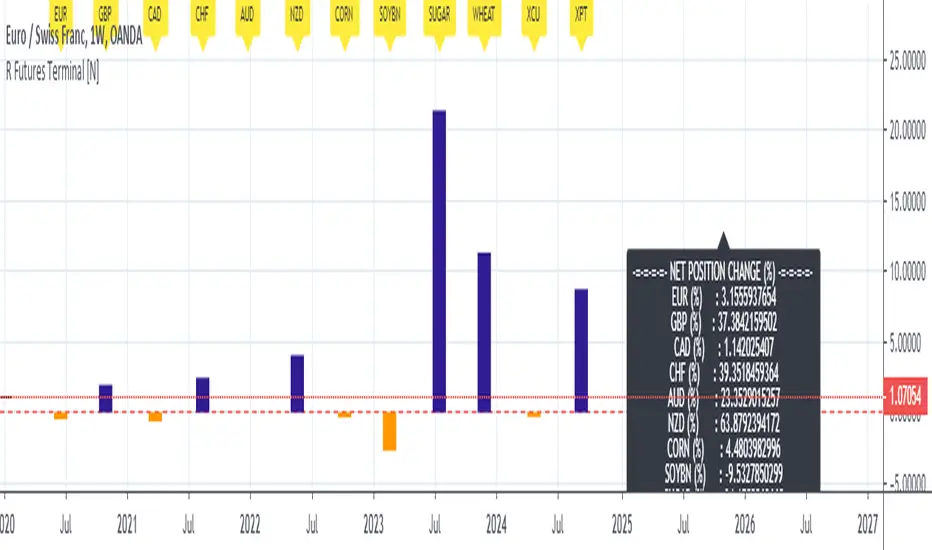
Live Mini Terminal 3 : Relative Forex & Futures Change DataThis script displays relative data changes occurring in the adjustable period and/or adaptive automatic period in the rest liquid futures.
It was inspired by the data terminals used by commercial traders.
Period selection can be set in the menu.
This script uses the adaptive period algorithm used by Autonomous LSTM and Relativity scripts.
Or you can set the period manually from the menu.
For more information about adaptive period:
This script works only for 1 day (1D) and 1 week (1W) time frames.
Since COT data is used, the most efficient time frame is 1 week (1W) .
Features
Value changes on a percentage basis (%)
Commitment of Traders position changes on a percentage basis :
Net position percentage is calculated as Short - Long and there is no inverse relationship.
Direct relationship is provided.
Due to the advantage of movement, future data were drawn instead of spot values on the required instruments.
The script provides the opportunity to comment on all major and minor Forex parities with liquid futures.
INSTRUMENTS
Euro Futures (EURUSD)
British Pound Futures (GBPUSD)
Canadian Dollar Futures (CADUSD)
Swiss Franc Futures (CHFUSD)
Australian Dollar Futures (AUDUSD)
New Zealand Dollar Futures (NZDUSD)
Corn Futures
Soybeans Futures
Sugar Futures
Wheat Futures
Copper Futures (XCU)
Platinum Futures (XPT)
Position Change InfoPanel
Position definition for the related instruments and data were taken and the calculations were made.
USAGE
The script can be used as an indicator by putting it under the chart as shown above.
It is necessary to enlarge to see clearly.
Since it is not often looked at, such use under chart is the best method for healthy interpretation.
Regards.
Syminfo.TypeHello traders
Earlier this week I discovered a new built-in variable called syminfo.type
What is it for?
This variable returns the type of the current symbol. Possible values are cfd, stock, futures, indices, forex, crypto, fund.
Cool bro but... should we care?
Well... we all should. Imagine you have a generic script and you want a different configuration whether you're trading FOREX or Crypto .
I designed a dummy example in that script that will preset the inputs according to the asset type from the chart.
Here I want 12/26/9 for forex and 20/50/50 for crypto - 30/60/90 otherwise
Quick caveat
It seems that for any crypto asset, syminfo.type returns "bitcoin". TradingView will fix it at some point but wanted to give you the heads-up regardless
Enjoy and all the BEST ^^
--
Dave

Main Trend Alert v1.1*** New Version of Main Trend Alert ***
This is an indicator that shows the main trend of and chart (crypto, forex, stock and etc). Good for day trading.
- HOW TO USE: When you are on lower timeframe, set the "Main Timeframe" to a higher timeframe from settings.
For example: Set "Main Timeframe = 1 Hour" when you are trading on 5 minute chart.
* Never trade just based on alerts of this script. Always use it with a system you like. Keep in mind that his script doesn't determine the stop loss and exit point.
* NO REPAINTS *
Good Luck,


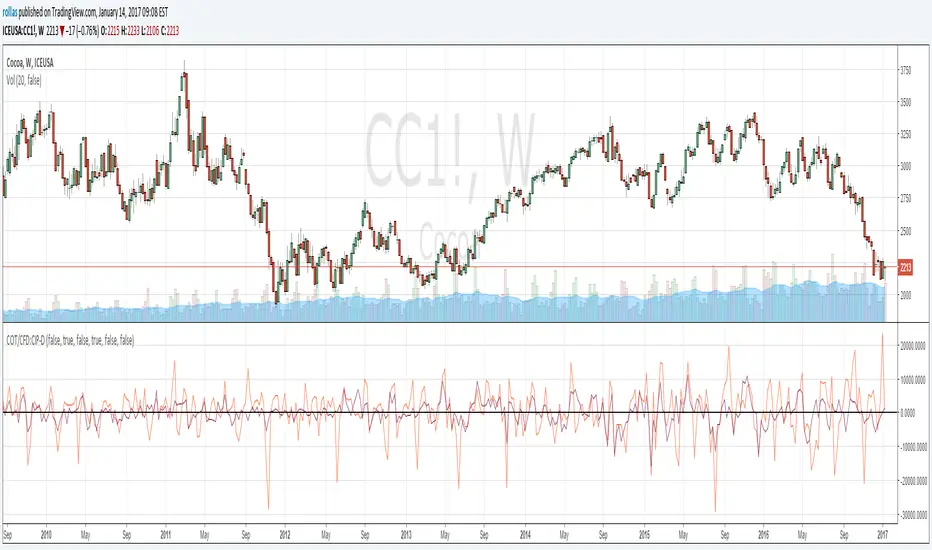
COT/CFD:CIP-DThe Commitments of Traders (COT) reports provide traders positions at the close of Tuesday's trading session. Reports show how many long and how many short contracts do traders of each category hold. This version covers the change in positions (CIP) in disaggregated format for CFD's. Default is Futures only. You can include Options from the input menu. From the style menu you can turn on or off different trader groups data. As the original data is weekly, charts will only work at weekly and upper time frames.