Auto Position CalculatorA position sizing tool that automatically detects the instrument you're trading and calculates the correct position size based on your risk parameters.
What It Does
This indicator calculates how many contracts, lots, or shares to trade based on your account size, risk percentage, and stop loss distance. It auto-detects the instrument type and adjusts the point/pip value accordingly.
Supported Instruments
Futures: NQ, MNQ, ES, MES, YM, MYM, RTY, M2K, CL, MCL, GC, MGC
Forex: All major pairs (USD, EUR, GBP, JPY, etc.)
Index CFDs: NAS100, US500, US30, GER40, UK100
Metals: XAU, XAG
Crypto and Stocks: Automatic detection
How to Use
Set your account size and risk % in settings
Click the settings icon and place Entry, Stop Loss, and Take Profit on the chart
The position size and risk calculations appear automatically
Levels auto-reset at your chosen session (Asia, London, or New York open)
Limitations
CFD and forex pip values assume standard lot sizing - your broker may differ
Auto-detection relies on ticker naming conventions, which vary by broker/data feed
Session reset times are based on ET (Eastern Time)
Cfds

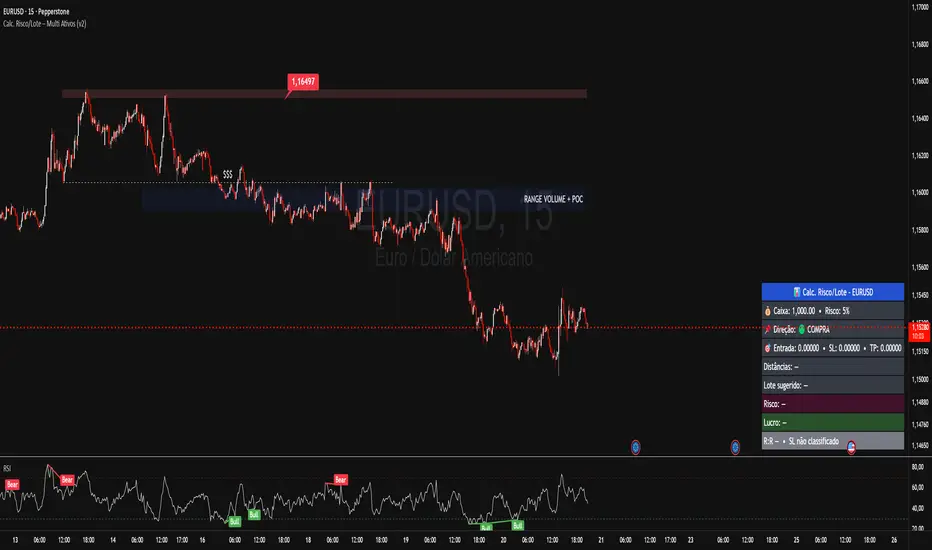
Calc. Risco/Lote – Multi Ativos (v2)Works for:
Forex (EURUSD, GBPUSD, USDCHF, USDCAD, USDJPY etc.)
Indices (US30, NAS100, GER40…)
Gold (XAUUSD), etc.
You manually enter:
Cash / Balance (USD)
Risk per trade (%)
Direction (Buy/Sell)
Entry Price
Stop Price (SL)
Target Price (TP)
The indicator calculates:
Distance between SL and TP in points
Value per point (automatic per asset)
Ideal lot / position size
Loss if SL hits (USD)
Profit if TP hits (USD)
Risk/Reward (R:R)
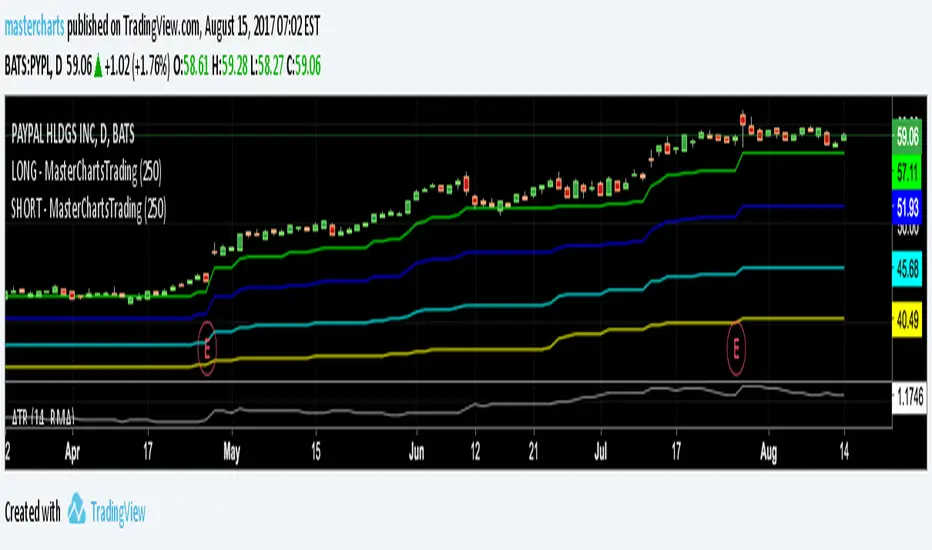
MasterChartsTrading Price Action Indicators-6.0These are upgraded MasterChartsTrading Price Action Indicators with future projections
---
How to understand price action.
It is very easy to read price action if you have a reference point. These support/resistance lines are there to help you read where the buyers and sellers are likely to make a stand.
You can also think of these indicators as moving pivot points .
MasterChartsTrading Price Action Indicators show good price levels to enter or exit a trade.
The Blue indicator line serves as a Bullish Trend setter.
If your instrument closes above the Blue line, we think about going Long (buying).
For commodities and Forex, when your trading instrument closes below the Red line, we think about Shorting (selling).
For Stocks, I prefer to use the Yellow line as my Bearish Trend setter (on Daily charts ). A stock has to close below the Yellow line first, then rally towards the Red line and top out there. This is where I would short it.

Relativity BULLS FUTURES 10X 1D AlgorithmHi,
This system is prepared only for leveraged markets and for Futures and CFD markets.
Leveraged processing apply to cryptocurrency contracts that are also subject to.
System parameters:
Timeframe = 1D (1 Day)
Leverage = 10x
Position Size = %1 (0.01) Each Trade
System features :
- It targets the Risk /Reward Ratio of 1/3 and above. (Risk/Reward Ratio >= 3 )
- If a Take Profit Point has come in a successful trade but the parameter conformity has not deteriorated, system continues the trade.
- In this way, you can catch strong long trends several times a year.
But it is strict as stop-loss and avoids large declines,whipsaws whenever possible.
- The system tries to avoid unnecessary processes as much as possible.
This means less commission and less sideways market.
- Since it takes advantage of the reverse market, it is suitable not only for long and short but only for long position, ie "bulls".
But this neutralizes unnecessary processes. (Short market direction, the system for bears will be published separately.)
- Stop-Loss points and Snow-take points are shown in red and green.
-However, if there is a small amount of follow-up available at the computer, it is recommended to put stop-loss only.
Because the system revises both stop-loss and take profit points according to the conditions formed.
Doing this in the right major long trend here allows you to be in trades.
-The system takes into account the risk and only opens transactions where the value corresponding to 10 leverage ratios is greater than the risk.
This provides as much protection from risk as possible.
-Alerts added.
About Backtest :
Since this system uses leveraged market, backtest results are not healthy.
But since it targets the 1/3 Risk Reward Rate (3.00),
we must look Ratio Avg Win/Loss and it must be over 0.5 because :
This ratio means: When we reach 33% of our correct trades in all our trades, we are at breakeven.
This is 100 - 33 = 66
33/66 = 0.5
So whenever this rate is over 0.5, we make a profit.
*** The fact that this ratio is over 0.70-1.00 in terms of securing ourselves because there is a maturity in the future indicates that we are doing
successful snowball trades.(Because future contracts have loss of maturity and end dates)
And we achieve success cumulatively.
Important Note : This system is prepared only for these parameters.
These parameters are designed for Futures and CFDs.
It doesn't work in spot markets.
NOTE :
The system has been prepared as a strategy to present success in a transparent manner.
Please check "Ratio Avg. Win / Loss" rates in backtests.
Important Note 2 -
Although the system revises the stop and take profit points in the required parameters, the most accurate place is when the signal comes.
It should be entered when the signal comes as much as possible and if this did not happen,
trade must be opened in the nearest bars after the signal comes.
Best regards.

Weiss Wave Open Interest BarsFirstly :
LazyBear ' s "Weiss Wave " codes are used for open interests.
Original Weiss Wave Volume :
Let's start :
Open Interest vs. Volume: An Overview
Volume and open interest are two key measurements that describe the liquidity and activity of contracts In the options and futures markets. However, their meanings and applications are different. Volume refers to the number of contracts traded in a given period, while open interest denotes the number of active contracts.
Volume
Trading volume measures the number of options or futures contracts being exchanged between buyers and sellers, identifying the level of activity for that particular contract. For every buyer, there is a seller, and the transaction itself counts toward the daily volume.
Open Interest
Open interest indicates the number of options or futures contracts that are held by traders and investors in active positions. These positions have not been closed out, expired, or exercised. Open interest decreases when holders and writers of options (or buyers and sellers of futures) close out their positions. To close out positions, they must take offsetting positions or exercise their options. Open interest increases once again when investors and traders open new long positions or writers/sellers take on new short positions. Open interest also increases when new options or futures contracts are created.
Options or futures contract trading volume can only increase while open interest can either increase or decrease. While trading volume indicates the number of contracts that have been bought or sold, open interest identifies the number of contracts that are currently held.
Reference : www.investopedia.com
*** Worked to define all futures . You can look them in codes (between line : 13 to line 94 )
** CAUTION 1 : Since each instrument in the list has its own unique contract data, you must first enter its name to display it. I recommend you to select OANDA from the markets. Finally, when the COT reports are issued, it may repaints. However, this repaint is usually close to closing or after close .(When COT reports are so sharp ) So use this script only 1W ( 1 week ) or 1 M ( 1 month ) timeframe.
** CAUTION 2 : This data is taken to Tradingview with the help of Quandl. This is a tremendous possibility, but the system will not work if there is a malfunction.
Best regards.