Chart Patterns (PRO) [ActiveQuants]Unlock the full potential of chart pattern trading with Chart Patterns (PRO) ! This advanced indicator goes beyond basic detection, offering a comprehensive suite of tools for serious traders. Automatically identify an extensive range of reversal and continuation patterns, complete with projected price targets , visually appealing pattern fills , and a sophisticated multi-status alert system .
How It Works
The indicator employs a sophisticated multi-stage process:
Precision Pivot Detection: At its heart, the indicator identifies significant swing highs and lows (pivot points) using an optimized internal period. These pivots are the fundamental building blocks for all pattern recognition. ( Users can toggle visibility of these pivots ).
Advanced Pattern Recognition Engine: Sequences of these pivot points are meticulously analyzed against a vast library of predefined geometric conditions to identify chart patterns. This includes checks for relative pivot heights/lows, slope analysis of trendlines, and ATR-based proportionality for patterns like Head & Shoulders.
Dynamic Status Tracking & Invalidation:
- Active: A pattern's initial structure is identified (e.g., two tops of a Double Top, or the converging trendlines of a Pennant). The pattern is developing.
- Confirmed: The pattern completes, and price breaks out/down from a key level (e.g., neckline, trendline) in the expected direction. Price targets are plotted upon confirmation.
- Invalidated: If price breaks out/down in the opposite direction of what's expected for an "Active" pattern, or if a new pivot forms that structurally compromises an "Active" Double Top/Bottom or Head & Shoulders before its confirmation, the pattern is marked "Invalid".
Price Target Projection: For confirmed patterns (excluding simple HH/LL structures), the indicator automatically calculates and plots potential price targets based on common technical analysis principles (e.g., pattern height projected from the breakout point).
█ DETECTED CHART PATTERNS
Chart Patterns (PRO) identifies a comprehensive list of 20 patterns, categorized for clarity:
I. Simple Market Structures:
Lower Low (LL): Indicates bearish pressure, potentially forming part of a larger downtrend.
Lower Low & Lower High (LL & LH): Stronger confirmation of a bearish trend.
Higher High (HH): Signals bullish strength, potentially part of an uptrend.
Higher High & Higher Low (HH & HL): Stronger confirmation of a bullish trend.
II. Reversal Patterns:
These patterns typically signal a potential end of the current trend and the beginning of a new one in the opposite direction.
Double Top (DT): Bearish reversal. Two distinct peaks at similar levels.
Double Bottom (DB): Bullish reversal. Two distinct troughs at similar levels.
Head and Shoulders (H&S): Bearish reversal. A central peak (head) flanked by two smaller peaks (shoulders).
Inverse Head and Shoulders (Inv H&S): Bullish reversal. A central trough (head) flanked by two smaller troughs (shoulders).
Rising Wedge From Uptrend (RW From UT): Bearish reversal. Converging trendlines with an upward slant during an uptrend.
Falling Wedge From Downtrend (FW From DT): Bullish reversal. Converging trendlines with a downward slant during a downtrend.
Bearish Ascending Triangle (Reversal): Bearish reversal. A horizontal resistance line with rising support, typically occurring after a downtrend.
Bullish Descending Triangle (Reversal): Bullish reversal. A horizontal support line with falling resistance, typically occurring after an uptrend.
III. Continuation Patterns:
These patterns typically suggest a temporary pause in the prevailing trend, after which the trend is likely to resume.
Rising Wedge From Downtrend (RW From DT): Bearish continuation. An upward-slanted consolidation during a downtrend.
Falling Wedge From Uptrend (FW From UT): Bullish continuation. A downward-slanted consolidation during an uptrend.
Bearish Pennant: Bearish continuation. A small symmetrical triangle (converging trendlines) after a sharp downward move.
Bullish Pennant: Bullish continuation. A small symmetrical triangle (converging trendlines) after a sharp upward move.
Bearish Flag: Bearish continuation. A short, rectangular consolidation (parallel trendlines, often upward sloping) after a sharp downward move.
Bullish Flag: Bullish continuation. A short, rectangular consolidation (parallel trendlines, often downward sloping) after a sharp upward move.
Bearish Descending Triangle: Bearish continuation. Horizontal support and a descending resistance line during a downtrend.
Bullish Ascending Triangle: Bullish continuation. Horizontal resistance and an ascending support line during an uptrend.
█ KEY FEATURES
- Automatic Price Target Projection:
Once a pattern is "Confirmed," a price target is automatically plotted on the chart.
Targets are calculated based on established technical methods, typically measuring the height of the pattern and projecting it from the breakout point.
Includes a label displaying the target price level. Toggle with Show Price Targets .
- Advanced Multi-Status Alerts:
Never miss an opportunity with highly configurable alerts.
Receive notifications when a pattern is:
- Developing (Active): Get an early heads-up.
- Confirmed: Act on breakout signals.
- Invalidated: Re-assess your strategy quickly.
Alerts automatically include the pattern type and its status (e.g., "Double Top - Confirmed ✅").
Additional contextual information included by default: Ticker Symbol, Chart Timeframe, Current Price, and Projected Target Price (for confirmed patterns).
Enable/disable all alerts via the Enable Alerts setting.
- Comprehensive Pattern Validation & Invalidation:
Patterns like Wedges, Triangles, Pennants, and Flags are monitored for breakouts. A breakout in the expected direction confirms the pattern; a breakout in the opposite direction invalidates it.
Double Tops/Bottoms and Head & Shoulders have pre-confirmation invalidation logic: if a new pivot forms that compromises the pattern's structure before the neckline breaks, the pattern is marked "Invalid". This helps filter out weaker setups.
ATR is used internally for proportional checks in patterns like Head & Shoulders, ensuring more reliable formations.
- Superior Visualizations:
Pattern Fills: Wedges, Triangles, Pennants, and Flags are visually enhanced with a semi-transparent fill between their trendlines, making them easy to spot.
Clear Necklines & Trendlines: Critical lines for patterns are drawn clearly.
Distinct Labels: Each pattern receives a main label (e.g., "H&S", "BullP"). Double Tops/Bottoms and H&S also get individual component labels (Top 1/2, Shoulder 1/Head/Shoulder 2).
Customizable Colors: Set distinct colors for bullish and bearish patterns.
- Pattern Display Control:
Toggle visibility for each of the 20 individual pattern types.
Filter displayed patterns by their status: All , Active , Confirmed , or Invalid .
Control historical depth with Show Last History (Bars) .
- Pivot Point Engine:
The indicator uses an optimized internal lookback period for robust pivot detection.
Optionally display these pivot high and low markers on your chart, with customizable colors.
█ USER INPUTS
Visibility and Common Styling
- Show Last History (Bars):
Number of recent bars the indicator will analyze and plot patterns on.
Default: 3000. Min: 10.
- Patterns (Visibility Filter):
Filters displayed patterns based on their status.
Options: All, Active, Confirmed, Invalid.
Default: All.
- Show Price Targets:
Toggles the display of calculated price targets for confirmed patterns.
Default: Enabled.
- Bearish Color:
Sets the color for bearish patterns and their components.
Default: Red.
- Bullish Color:
Sets the color for bullish patterns and their components.
Default: Green.
Pivot Points
- Show Pivot Highs:
Toggles the visibility of detected pivot high markers.
Default: Enabled.
- Show Pivot Lows:
Toggles the visibility of detected pivot low markers.
Default: Enabled.
- Pivot Highs Color:
Color for pivot high markers.
Default: #ff5252 (Reddish).
- Pivot Lows Color:
Color for pivot low markers.
Default: #089981 (Greenish).
Pattern Toggles (Grouped by Type)
- Simple Structures:
Lower Low (Default: Enabled)
Lower Low & Lower High (Default: Enabled)
Higher High (Default: Enabled)
Higher High & Higher Low (Default: Enabled)
- Reversal Patterns:
Double Tops (Default: Enabled)
Double Bottoms (Default: Enabled)
Head and Shoulders (Default: Enabled)
Inverse Head and Shoulders (Default: Enabled)
Rising Wedges From Uptrend (Default: Enabled)
Falling Wedges From Downtrend (Default: Enabled)
Bearish Ascending Triangles (Reversal context) (Default: Enabled)
Bullish Descending Triangles (Reversal context) (Default: Enabled)
- Continuation Patterns:
Rising Wedges From Downtrend (Default: Enabled)
Falling Wedges From Uptrend (Default: Enabled)
Bearish Pennants (Default: Enabled)
Bullish Pennants (Default: Enabled)
Bearish Flags (Default: Enabled)
Bullish Flags (Default: Enabled)
Bearish Descending Triangles (Continuation context) (Default: Enabled)
Bullish Ascending Triangles (Continuation context) (Default: Enabled)
Alerts
- Enable Alerts:
Master switch to enable or disable all alert notifications from this indicator.
Default: Enabled. ( Alert messages are pre-configured to include Pattern Type, Status, Symbol, Timeframe, Price, and Target Price when applicable and confirmed ).
█ UNDERSTANDING PATTERN INVALIDATION
Trendline Patterns (Wedges, Triangles, Pennants, Flags): An "Active" pattern is invalidated if price breaks its trendlines in the direction opposite to the expected breakout before a confirmation occurs. E.g., an Active Bullish Pennant is invalidated if price breaks below its lower trendline.
Neckline Patterns (Double Tops/Bottoms, H&S): An "Active" pattern can be invalidated before a neckline break if a new pivot point forms that violates the pattern's structural integrity.
Example (Double Top): If Top 1, Neckline (P5), and Top 2 form (Active status), but before price breaks below P5, a new swing low forms at or above P5, the Double Top is invalidated. This indicates a failure to break support and potential renewed strength.
█ ALERTS GUIDE
Add the " Chart Patterns (PRO) " indicator to your chart.
Ensure Enable Alerts is checked in the indicator settings.
In TradingView, click the "Alert" icon (clock) in the right toolbar or press ALT + A .
In the "Create Alert" dialog:
- Condition: Select " Chart Patterns (PRO) ".
- For the condition dropdown below it, choose " Any alert() function call ". This will trigger for any alert generated by the script.
- Interval: Choose whatever interval you want the alert to be triggered.
- Expiration: Choose the expiration date.
Customize your alert notification preferences (popup, email, webhook, etc.) and click " Create ".
You will now receive alerts for pattern status changes (Developing, Confirmed, Invalidated) with detailed information.
█ CONCLUSION
The Chart Patterns (PRO) indicator is an indispensable tool for traders aiming to optimize their workflow. By automatically identifying and drawing classical chart patterns, it eliminates the need for manual chart analysis, thereby enabling users to dedicate substantially less time to chart monitoring. Its comprehensive detection, coupled with actionable insights like price targets and a meticulous status tracking system with alerts, provides a significant analytical edge. Automate your pattern recognition and drawing, and concentrate on making informed trading decisions with enhanced efficiency.
█ IMPORTANT NOTES
⚠ Confirmation is Crucial: While "Active" patterns provide early warnings, always await "Confirmed" status (e.g., neckline/trendline breaks) and consider volume and broader market context.
⚠ Non-Repainting Logic: Pattern detection and status updates are based on confirmed price bars and pivot points. Once a pattern is fully formed and its status set (Active, Confirmed, Invalid), it will not repaint its historical state. Initial drawing of "Active" patterns extends to the current bar and updates dynamically.
⚠ Combine with Other Tools: No indicator is a standalone solution. Use Chart Patterns (PRO) in conjunction with other forms of analysis (e.g., fundamental analysis, other indicators, volume analysis) and robust risk management .
⚠ Historical Data: Ensure sufficient historical data on your chart for patterns to form and be detected accurately. The Show Last History (Bars) setting can manage this.
⚠ Lagging Nature: By their very definition, chart patterns are lagging indicators as they require a sequence of price action and several pivot points to complete their formation.
█ RISK DISCLAIMER
Trading involves substantial risk of loss and is not suitable for all investors. The Chart Patterns (PRO) indicator and its generated information are for educational and informational purposes only. It does not constitute financial advice or a recommendation to buy or sell any security. Chart patterns and projected targets indicate potential price movements based on historical tendencies but do not guarantee future results. Always conduct your own due diligence, consider multiple factors, and consult with a qualified financial advisor before making investment decisions. Past performance is not indicative of future results.
📈 Happy trading! 🚀
Corak Carta
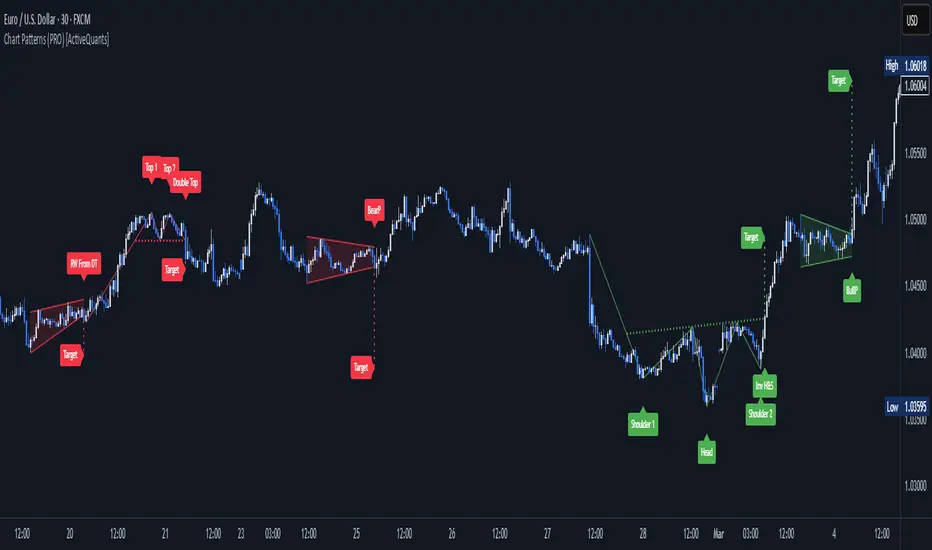
Chart Patterns [ActiveQuants]The Chart Patterns indicator is a comprehensive tool designed to automatically identify a variety of common chart patterns directly on your price chart. By detecting sequences of pivot highs and lows , this indicator helps traders spot potential trend continuations , reversals , and key market structures such as Double Tops and Double Bottoms . Enhance your technical analysis by quickly recognizing these formations as they emerge.
How It Works
The indicator operates in a two-stage process:
Pivot Point Detection: It first identifies significant swing highs and swing lows (pivot points) based on a user-defined Period . These pivots form the fundamental building blocks for pattern recognition.
Pattern Recognition: Using the sequence of these detected pivot points, the script then applies logical rules to identify the following patterns:
Lower Low (LL)
Lower Low & Lower High (LL & LH)
Higher High (HH)
Higher High & Higher Low (HH & HL)
Double Tops
Double Bottoms
Patterns are drawn on the chart with connecting lines and labeled for easy identification. Double Tops and Double Bottoms also feature a status system: " Active " while forming, " Confirmed " upon neckline breakout, or " Invalid " if specific conditions negate the pattern before confirmation.
█ KEY FEATURES
Comprehensive Pattern Detection: Identifies six distinct types of chart patterns, offering insights into both trend continuation and potential reversals.
Pivot-Based Analysis: Uses a robust method of identifying pivot highs and lows as the foundation for pattern formation.
Pattern Status for Double Tops/Bottoms:
- Active: A Double Top or Double Bottom pattern has formed its two peaks/troughs and the intervening neckline point, but the price has not yet broken beyond the neckline. The pattern is developing .
- Confirmed: The price has decisively closed beyond the neckline (below for Double Top, above for Double Bottom), signaling a potential entry or validation of the pattern.
- Invalid: An " Active " Double Top or Double Bottom pattern can be invalidated if, before a neckline breakout occurs, a new pivot point forms that negates the pattern’s structural integrity. For example, if a new pivot low forms above or at the neckline of an Active Double Top, the pattern is considered invalid because the market failed to break down and instead showed relative strength.
Customizable Visuals: Allows users to define colors for bullish and bearish patterns, line widths, and the visibility of pivot points.
Selective Pattern Display: Users can choose to display all patterns or filter by status (Active, Confirmed, Invalid) for Double Tops/Bottoms. Individual pattern types can also be toggled on or off.
Historical Analysis Control: The Show Last History (Bars) input allows users to specify how far back the indicator should plot patterns, optimizing performance and chart readability.
Clear Labeling: Patterns are clearly labeled on the chart, with Double Tops/Bottoms also showing " Top 1 ," " Top 2 ," or " Bottom 1 ," " Bottom 2 " labels.
█ PATTERNS DETECTED
Lower Low (LL): Indicates a potential bearish continuation or the start of a downtrend. Forms when price makes a lower low during an uptrend.
Lower Low & Lower High (LL & LH): A stronger confirmation of a bearish trend, where the market forms a lower low followed by a lower high .
Higher High (HH): Signals a potential bullish continuation or the start of an uptrend. Forms when price makes a higher high during a downtrend.
Higher High & Higher Low (HH & HL): A stronger confirmation of a bullish trend, where the market forms a higher high followed by a higher low .
Double Top: A bearish reversal pattern characterized by two distinct peaks at roughly the same price level, separated by a trough (neckline). Confirmation occurs when price breaks below the neckline.
Double Bottom: A bullish reversal pattern featuring two distinct troughs at roughly the same price level, separated by a peak (neckline). Confirmation occurs when price breaks above the neckline.
█ EXAMPLE: DOUBLE TOP INVALIDATION
Understanding how a Double Top or Double Bottom can be invalidated is crucial. Here's an example for a Double Top:
Formation: The indicator identifies two peaks (Top 1, Top 2) at a similar price level, with a corrective trough (Neckline Pivot P5) in between. The pattern is labeled " Double Top " and is in an " Active " state. ( Imagine points P4 and P6 are the two tops, and P5 is the low point of the neckline between them ).
Pre-Breakout Condition: The price action continues, but before it breaks decisively below the P5 neckline level, a new significant swing low (a new pivot low) forms.
Invalidation Check: The indicator checks the price level of this new pivot low. If this new pivot low occurs at a price equal to or higher than the P5 neckline level, the " Active " Double Top pattern is re-labeled as " Invalid Double Top ". ( See image below for a visual representation of this scenario )
In this example, the Double Top formed with Top 1 (P4) and Top 2 (P6). The neckline is at P5. Before price broke below P5, a new pivot low formed at the red circle. Since this new pivot low is above the P5 neckline, the Double Top is marked " Invalid ".
The logic is that the market failed to break the neckline support and instead established a higher low (or a low at the support level), suggesting that the immediate bearish pressure has waned, thus invalidating the bearish reversal implication of the Double Top before it could confirm. A similar logic applies to Double Bottoms (a new pivot high forming below or at the neckline before an upside breakout).
█ USER INPUTS
Visibility and Common Styling
- Show Last History (Bars):
Specifies the number of recent bars the indicator will analyze and plot patterns on.
Default: 3000 bars. Min: 10.
- Patterns:
Filters which patterns are displayed based on their status.
Options: All, Active, Confirmed, Invalid.
Default: All.
- Pattern Line Width:
Sets the thickness of the lines used to draw the patterns.
Default: 1. Min: 1, Max: 10.
- Bearish Color:
Color for bearish patterns (LL, LL & LH, Double Tops).
Default: Red.
- Bullish Color:
Color for bullish patterns (HH, HH & HL, Double Bottoms).
Default: Green.
Pivot Points
- Period:
The lookback period on either side of a bar to qualify it as a pivot high or low. Higher values detect more significant pivots.
Default: 10 bars. Min: 2.
- Show Pivot Highs:
Toggles the visibility of detected pivot high markers.
Default: Enabled.
- Show Pivot Lows:
Toggles the visibility of detected pivot low markers.
Default: Enabled.
- Pivot Highs Color:
Color for the pivot high markers.
Default: #ff5252 (Reddish).
- Pivot Lows Color:
Color for the pivot low markers.
Default: #089981 (Greenish).
Patterns (Toggles)
- Lower Low:
Enable/disable detection and display of Lower Low patterns.
Default: Enabled.
- Lower Low & Lower High:
Enable/disable detection and display of Lower Low & Lower High patterns.
Default: Enabled.
- Higher High:
Enable/disable detection and display of Higher High patterns.
Default: Enabled.
- Higher High & Higher Low:
Enable/disable detection and display of Higher High & Higher Low patterns.
Default: Enabled.
- Double Tops:
Enable/disable detection and display of Double Top patterns.
Default: Enabled.
- Double Bottoms:
Enable/disable detection and display of Double Bottom patterns.
Default: Enabled.
█ CONCLUSION
The Chart Patterns indicator is a versatile and powerful assistant for traders who utilize classical chart pattern analysis. By automating the detection of key formations and providing clear visual cues along with status updates for patterns like Double Tops and Bottoms, it allows traders to focus on strategy development and execution. With its customizable settings, it can be adapted to various instruments and timeframes, making it a valuable addition to any technical trader's toolkit.
█ IMPORTANT NOTES
⚠ Pivot Period Sensitivity: The Period setting for pivot detection is crucial. A shorter period will identify more frequent, smaller swings, while a longer period will focus on more significant turning points. Adjust this setting based on the asset's volatility, the timeframe you are trading and your trading style.
⚠ Confirmation is Key: While the indicator identifies patterns, always wait for pattern confirmation (e.g., neckline breaks for Double Tops/Bottoms) and consider other factors like volume and market context before making trading decisions.
⚠ Confirmed Bars for Detection: Patterns are identified based on confirmed pivot points, which means a pivot is recognized period bars after it has formed. Status updates for Double Tops/Bottoms (Active, Confirmed, Invalid) also occur on confirmed bars. This approach enhances reliability and reduces the likelihood of repainting based on intra-bar price fluctuations.
⚠ Not a Standalone System: Chart patterns provide valuable insights, but they should be used in conjunction with other technical analysis tools (e.g., trendlines, moving averages, oscillators) and a sound risk management plan.
⚠ Lagging Nature: By their very definition, chart patterns are lagging indicators as they require a sequence of price action and several pivot points to complete their formation.
█ RISK DISCLAIMER
Trading involves a substantial risk of loss and is not suitable for every investor. The information provided by the Chart Patterns indicator is for educational and informational purposes only. It should not be considered as financial advice or a recommendation to buy or sell any security. Chart patterns indicate potential price movements but do not guarantee future results. Always perform your own due diligence and consult with a qualified financial advisor before making any investment decisions. Past performance is not indicative of future results.
📈 Happy trading! 🚀

NR4 & NR7 with Breakouts [LuxAlgo]NR4 & NR7 with Breakouts is a simple indicator that utilizes the NR4 and NR7 candle patterns to display candle ranges and signals from range breakouts.
🔶 USAGE
The Narrow Range Patterns are candle formations determined by the last candle having a narrower (high-low) range than the previous number. This indicator showcases the 2 most recognized Narrow Range Patterns, which are the 4 and 7 bar variants (NR4 and NR7).
These patterns, introduced by Toby Crabel, are thought to provide insight for potential market breakouts by identifying periods of low volatility indicated by a candle with a small range. This is due to the idea that markets often move from periods of low volatility (contraction) to high volatility (expansion), and the NR4 and NR7 patterns help spot these transitions.
By utilizing these patterns, traders are better able to anticipate and respond to market shifts for better decision-making and risk management.
NOTE: These patterns have traditionally been studied on the Daily Timeframe Chart. This indicator allows the user to select a timeframe to generate these patterns from. It is suggested to be mindful of this when considering these patterns.
In this indicator, on the bar after the pattern is detected, the Narrow Range Bar will be highlighted with a zone, and lines displaying the range will extend from it. These ranges are helpful for providing levels to set limit orders and for managing risk.
Users are able to adjust which pattern they want visualized on their chart, please note;
All NR7s are NR4s but not all NR4s are NR7s.
Because of this, you will notice that when selecting "NR4" to display, the colors will change, but the detected ranges will not change.
🔹 Signals
When a Narrow Range Bar is detected, the script will wait for the price to close outside of the Range, then a signal will fire indicating the direction of exit. The signals are produced from the last NR4 or NR7 and will have the potential to fire from that range until a new NR4 or NR7 is detected.
After a signal fires, the logic goes into a "reset" period where it will wait for the price to reach the Range Mean before firing another signal.
These signals can be anticipated by considering the underlying logic and watching price approach the range extremities, and can be improved by utilizing other market information for confluence.
🔶 SETTINGS
Timeframe: Choose which timeframe to identify the NR4 and NR7 Pattern on. This must be Higher than the chart timeframe.
Pattern Type: Choose which (or all) patterns to display.

Breakout Patterns Detector: Triangle & Wedge [Splirus]This indicator identifies Breakout Patterns such as Ascending Triangles , Descending Triangles , Symmetric Triangles , Ascending Wedges , and Descending Wedges , using candlestick charts and Trendlines. It provides visual cues, stop-loss (SL), and take-profit (TP) levels, alongside a detailed dashboard to evaluate performance. The indicator supports two alert modes: Manual Mode for trader notifications and Bot Mode for automated trading signals.
To achieve optimal results, users are encouraged to experiment with indicator parameters and analyze the dashboard summary to find the perfect configuration for each timeframe, pair, and market condition.
Pattern Identification
The indicator detects the following breakout patterns based on pivot highs and lows:
Ascending Triangle : Flat upper trendline, rising lower trendline.
Descending Triangle : Flat lower trendline, declining upper trendline.
Symmetric Triangle : Converging trendlines with similar slopes (within a user-defined threshold).
Ascending Wedge : Both trendlines slope upward, converging.
Descending Wedge : Both trendlines slope downward, converging.
Patterns are identified using configurable left and right bars for small and big patterns, with slope thresholds normalized by ATR. A trend confirmation filter ensures breakouts align with market direction, and users can adjust breakout confirmation bars to validate signals.
The goal is to fine-tune these settings to suit specific timeframes and pairs, as each combination may require a unique setup for optimal performance.
Stop-Loss Calculation
Stop-loss levels are calculated dynamically based on pattern type and breakout direction:
Symmetric Triangle : SL is set at the first pivot of the opposite trendline, adjusted by a buffer percentage.
Ascending/Descending Triangle : SL is placed at the breakout trendline’s price, plus the buffer.
Ascending/Descending Wedge : SL is set at the second pivot of the opposite trendline, adjusted by the buffer.
The indicator calculates leverage based on a user-defined risk tolerance percentage. Users should adjust the SL buffer and risk tolerance to balance risk and reward, monitoring the dashboard to assess how these settings impact performance across different timeframes and pairs.
Take-Profit Calculation
Three take-profit levels ( TP1 , TP2 , TP3 ) are calculated using pattern height and user-defined multipliers:
For Ascending/Descending Triangles, height is the difference between the max and min prices within the pattern.
For Symmetric Triangles and Wedges, height is the vertical distance between trendlines at the pattern’s start.
TP levels are set as:
TP1 = Breakout price ± (Height × TP1 Multiplier).
TP2 = Breakout price ± (Height × TP2 Multiplier).
TP3 = Breakout price ± (Height × TP3 Multiplier, with a 1.5x adjustment for Wedges).
Experiment with TP multipliers to optimize the risk-reward ratio, using the dashboard to evaluate TP hit rates and overall profitability for each configuration.
Symmetric Triangle:
Ascending/Descending Wedge:
Ascending/Descending Triangles:
Finding the Perfect Configuration
The indicator’s dashboard provides a comprehensive summary of performance metrics, including total trades, TP1/TP2/TP3 hits, SL hits, profit/loss percentages, and win rates for bullish, bearish, and combined trades. These metrics are crucial for identifying the ideal parameter settings:
Timeframe and Pair Variability : Each timeframe (e.g., 15m, 30min, 1H, 4H, Daily) and pair (e.g., BTC/USD, EUR/USD) behaves differently. Adjust parameters like left/right bars, minimum pattern length, and breakout confirmation bars to match the volatility and trend characteristics of the chosen pair and timeframe.
Parameter Tuning : Modify slope thresholds, trend confirmation filters, and bars inside the pattern to filter out false breakouts. For example, a higher breakout confirmation bar setting may reduce signals but increase reliability on longer timeframes.
Dashboard Analysis : Focus on the dashboard’s win rate, profit/loss ratio, and TP/SL hit frequencies. A “Perfect” win rate (>66%) or high TP hit rate indicates a strong configuration. If the SL hit rate is high, consider tightening the trend confirmation filter or increasing the SL buffer.
Iterative Testing : Test different combinations of settings (e.g., small vs. big patterns, aggressive vs. conservative breakout confirmation) and compare dashboard results over time. The goal is to find a balance where the indicator consistently delivers high win rates and profitability for your specific trading setup.
Alert Modes
The indicator supports two alert modes to suit different trading styles:
Manual Mode : Generates alerts for breakouts with entry price, SL, TP1/TP2/TP3, and leverage, tailored for Crypto or Forex markets. Use this mode to manually evaluate signals while refining configurations.
Bot Mode : Sends automated trading signals. To avoid conflicts, Bot Mode ensures no short position alert is triggered while a long position is active, and vice versa. This mode is ideal once you’ve identified an optimal configuration via the dashboard.
Additional Features
Historical Patterns : Displays past trendlines with customizable transparency and extension, helping users analyze how patterns performed under different settings.
Customizable Settings : Adjust pattern size, breakout confirmation, trend filters, and visual preferences (colors, dashboard location) to match your trading style.
Market Compatibility : Supports Crypto and Forex markets across all timeframes, but requires careful tuning for each market type.
Usage Notes
Start with default settings and monitor the dashboard to establish a baseline performance for your chosen timeframe and pair.
Gradually adjust one parameter at a time (e.g., left/right bars, TP multipliers) and compare dashboard results to identify improvements.
Use historical pattern analysis to understand how past breakouts performed under different configurations, guiding your optimization process.
Once a high win rate and profitability are achieved, consider automating trades with Bot Mode for consistent execution.
Disclaimer
This indicator is intended for educational purposes only and should not be considered financial advice. Trading involves significant risk, and past performance is not indicative of future results. Users are strongly advised to thoroughly test and validate the indicator’s signals in a demo environment before using it in live trading. The author is not responsible for any financial losses incurred while using this indicator. Always conduct your own research and consult with a qualified financial advisor before making trading decisions.

LinearRegressionLibrary "LinearRegression"
Calculates a variety of linear regression and deviation types, with optional emphasis weighting. Additionally, multiple of slope and Pearson’s R calculations.
calcSlope(_src, _len, _condition)
Calculates the slope of a linear regression over the specified length.
Parameters:
_src (float) : (float) The source data.
_len (int) : (int) The length of the lookback period for the linear regression.
_condition (bool) : (bool) Flag to enable calculation. Set to true to calculate on every bar; otherwise, set to barstate.islast for efficiency.
Returns: (float) The slope of the linear regression.
calcReg(_src, _len, _condition)
Calculates a basic linear regression, returning y1, y2, slope, and average.
Parameters:
_src (float) : (float) The source data series.
_len (int) : (int) The length of the lookback period.
_condition (bool) : (bool) Flag to enable calculation (true = calculate).
Returns: (float ) An array of 4 values: .
calcRegStandard(_src, _len, _emphasis, _condition)
Calculates an Standard linear regression with optional emphasis.
Parameters:
_src (float) : (series float) The source data series.
_len (int) : (int) The length of the lookback period.
_emphasis (float) : (float) The emphasis factor: 0 for equal weight; >0 emphasizes recent bars; <0 emphasizes older bars.
_condition (bool) : (bool) Flag to enable calculation (true = calculate).
Returns: (float ) .
calcRegRidge(_src, _len, lambda, _emphasis, _condition)
Calculates a ridge regression with optional emphasis.
Parameters:
_src (float) : (float) The source data series.
_len (int) : (int) The length of the lookback period.
lambda (float) : (float) The ridge regularization parameter.
_emphasis (float) : (float) The emphasis factor: 0 for equal weight; >0 emphasizes recent bars; <0 emphasizes older bars.
_condition (bool) : (bool) Flag to enable calculation (true = calculate).
Returns: (float ) .
calcRegLasso(_src, _len, lambda, _emphasis, _condition)
Calculates a Lasso regression with optional emphasis.
Parameters:
_src (float) : (float) The source data series.
_len (int) : (int) The length of the lookback period.
lambda (float) : (float) The Lasso regularization parameter.
_emphasis (float) : (float) The emphasis factor: 0 for equal weight; >0 emphasizes recent bars; <0 emphasizes older bars.
_condition (bool) : (bool) Flag to enable calculation (true = calculate).
Returns: (float ) .
calcElasticNetLinReg(_src, _len, lambda1, lambda2, _emphasis, _condition)
Calculates an Elastic Net regression with optional emphasis.
Parameters:
_src (float) : (float) The source data series.
_len (int) : (int) The length of the lookback period.
lambda1 (float) : (float) L1 regularization parameter (Lasso).
lambda2 (float) : (float) L2 regularization parameter (Ridge).
_emphasis (float) : (float) Emphasis factor: 0 for equal weight; >0 emphasizes recent bars; <0 emphasizes older bars.
_condition (bool) : (bool) Flag to enable calculation (true = calculate).
Returns: (float ) .
calcRegHuber(_src, _len, delta, iterations, _emphasis, _condition)
Calculates a Huber regression using Iteratively Reweighted Least Squares (IRLS).
Parameters:
_src (float) : (float) The source data series.
_len (int) : (int) The length of the lookback period.
delta (float) : (float) Huber threshold parameter.
iterations (int) : (int) Number of IRLS iterations.
_emphasis (float) : (float) Emphasis factor: 0 for equal weight; >0 emphasizes recent bars; <0 emphasizes older bars.
_condition (bool) : (bool) Flag to enable calculation (true = calculate).
Returns: (float ) .
calcRegLAD(_src, _len, iterations, _emphasis, _condition)
Calculates a Least Absolute Deviations (LAD) regression via IRLS.
Parameters:
_src (float) : (float) The source data series.
_len (int) : (int) The length of the lookback period.
iterations (int) : (int) Number of IRLS iterations for LAD.
_emphasis (float) : (float) Emphasis factor: 0 for equal weight; >0 emphasizes recent bars; <0 emphasizes older bars.
_condition (bool) : (bool) Flag to enable calculation (true = calculate).
Returns: (float ) .
calcRegBayesian(_src, _len, priorMean, priorSpan, sigma, _emphasis, _condition)
Calculates a Bayesian linear regression with optional emphasis.
Parameters:
_src (float) : (float) The source data series.
_len (int) : (int) The length of the lookback period.
priorMean (float) : (float) The prior mean for the slope.
priorSpan (float) : (float) The prior variance (or span) for the slope.
sigma (float) : (float) The assumed standard deviation of residuals.
_emphasis (float) : (float) Emphasis factor: 0 for equal weight; >0 emphasizes recent bars; <0 emphasizes older bars.
_condition (bool) : (bool) Flag to enable calculation (true = calculate).
Returns: (float ) .
calcRFromLinReg(_src, _len, _slope, _average, _y1, _condition)
Calculates the Pearson correlation coefficient (R) based on linear regression parameters.
Parameters:
_src (float) : (float) The source data.
_len (int) : (int) The length of the lookback period.
_slope (float) : (float) The slope of the linear regression.
_average (float) : (float) The average value of the source data series.
_y1 (float) : (float) The starting point (y-intercept of the oldest bar) for the linear regression.
_condition (bool) : (bool) Flag to enable calculation. Set to true to calculate on every bar; otherwise, set to barstate.islast for efficiency.
Returns: (float) The Pearson correlation coefficient (R) adjusted for the direction of the slope.
calcRFromSource(_src, _len, _condition)
Calculates the correlation coefficient (R) using a specified length and source data.
Parameters:
_src (float) : (float) The source data.
_len (int) : (int) The length of the lookback period.
_condition (bool) : (bool) Flag to enable calculation. Set to true to calculate on every bar; otherwise, set to barstate.islast for efficiency.
Returns: (float) The correlation coefficient (R).
calcSlopeLengthZero(_src, _len, _minLen, _step, _condition)
Identifies the length at which the slope is flattest (closest to zero).
Parameters:
_src (float) : (float) The source data.
_len (int) : (int) The maximum lookback length to consider (minimum of 2).
_minLen (int) : (int) The minimum length to start from (cannot exceed the max length).
_step (int) : (int) The increment step for lengths.
_condition (bool) : (bool) Flag to enable calculation. Set to true to calculate on every bar; otherwise, set to barstate.islast.
Returns: (int) The length at which the slope is flattest.
calcSlopeLengthHighest(_src, _len, _minLen, _step, _condition)
Identifies the length at which the slope is highest.
Parameters:
_src (float) : (float) The source data.
_len (int) : (int) The maximum lookback length (minimum of 2).
_minLen (int) : (int) The minimum length to start from.
_step (int) : (int) The step for incrementing lengths.
_condition (bool) : (bool) Flag to enable calculation. Set to true to calculate on every bar; otherwise, set to barstate.islast.
Returns: (int) The length at which the slope is highest.
calcSlopeLengthLowest(_src, _len, _minLen, _step, _condition)
Identifies the length at which the slope is lowest.
Parameters:
_src (float) : (float) The source data.
_len (int) : (int) The maximum lookback length (minimum of 2).
_minLen (int) : (int) The minimum length to start from.
_step (int) : (int) The step for incrementing lengths.
_condition (bool) : (bool) Flag to enable calculation. Set to true to calculate on every bar; otherwise, set to barstate.islast.
Returns: (int) The length at which the slope is lowest.
calcSlopeLengthAbsolute(_src, _len, _minLen, _step, _condition)
Identifies the length at which the absolute slope value is highest.
Parameters:
_src (float) : (float) The source data.
_len (int) : (int) The maximum lookback length (minimum of 2).
_minLen (int) : (int) The minimum length to start from.
_step (int) : (int) The step for incrementing lengths.
_condition (bool) : (bool) Flag to enable calculation. Set to true to calculate on every bar; otherwise, set to barstate.islast.
Returns: (int) The length at which the absolute slope value is highest.
calcRLengthZero(_src, _len, _minLen, _step, _condition)
Identifies the length with the lowest absolute R value.
Parameters:
_src (float) : (float) The source data.
_len (int) : (int) The maximum lookback length (minimum of 2).
_minLen (int) : (int) The minimum length to start from.
_step (int) : (int) The step for incrementing lengths.
_condition (bool) : (bool) Flag to enable calculation. Set to true to calculate on every bar; otherwise, set to barstate.islast.
Returns: (int) The length with the lowest absolute R value.
calcRLengthHighest(_src, _len, _minLen, _step, _condition)
Identifies the length with the highest R value.
Parameters:
_src (float) : (float) The source data.
_len (int) : (int) The maximum lookback length (minimum of 2).
_minLen (int) : (int) The minimum length to start from.
_step (int) : (int) The step for incrementing lengths.
_condition (bool) : (bool) Flag to enable calculation. Set to true to calculate on every bar; otherwise, set to barstate.islast.
Returns: (int) The length with the highest R value.
calcRLengthLowest(_src, _len, _minLen, _step, _condition)
Identifies the length with the lowest R value.
Parameters:
_src (float) : (float) The source data.
_len (int) : (int) The maximum lookback length (minimum of 2).
_minLen (int) : (int) The minimum length to start from.
_step (int) : (int) The step for incrementing lengths.
_condition (bool) : (bool) Flag to enable calculation. Set to true to calculate on every bar; otherwise, set to barstate.islast.
Returns: (int) The length with the lowest R value.
calcRLengthAbsolute(_src, _len, _minLen, _step, _condition)
Identifies the length with the highest absolute R value.
Parameters:
_src (float) : (float) The source data.
_len (int) : (int) The maximum lookback length (minimum of 2).
_minLen (int) : (int) The minimum length to start from.
_step (int) : (int) The step for incrementing lengths.
_condition (bool) : (bool) Flag to enable calculation. Set to true to calculate on every bar; otherwise, set to barstate.islast.
Returns: (int) The length with the highest absolute R value.
calcDevReverse(_src, _len, _slope, _y1, _inputDev, _emphasis, _condition)
Calculates the regressive linear deviation in reverse order, with optional emphasis on recent data.
Parameters:
_src (float) : (float) The source data.
_len (int) : (int) The length of the lookback period.
_slope (float) : (float) The slope of the linear regression.
_y1 (float) : (float) The y-intercept (oldest bar) of the linear regression.
_inputDev (float) : (float) The input deviation multiplier.
_emphasis (float) : (float) Emphasis factor: 0 for equal weight; >0 emphasizes recent bars; <0 emphasizes older bars.
_condition (bool) : (bool) Flag to enable calculation (true = calculate).
Returns: A 2-element tuple: .
calcDevForward(_src, _len, _slope, _y1, _inputDev, _emphasis, _condition)
Calculates the progressive linear deviation in forward order (oldest to most recent bar), with optional emphasis.
Parameters:
_src (float) : (float) The source data array, where _src is oldest and _src is most recent.
_len (int) : (int) The length of the lookback period.
_slope (float) : (float) The slope of the linear regression.
_y1 (float) : (float) The y-intercept of the linear regression (value at the most recent bar, adjusted by slope).
_inputDev (float) : (float) The input deviation multiplier.
_emphasis (float) : (float) Emphasis factor: 0 for equal weight; >0 emphasizes recent bars; <0 emphasizes older bars.
_condition (bool) : (bool) Flag to enable calculation (true = calculate).
Returns: A 2-element tuple: .
calcDevBalanced(_src, _len, _slope, _y1, _inputDev, _emphasis, _condition)
Calculates the balanced linear deviation with optional emphasis on recent or older data.
Parameters:
_src (float) : (float) Source data array, where _src is the most recent and _src is the oldest.
_len (int) : (int) The length of the lookback period.
_slope (float) : (float) The slope of the linear regression.
_y1 (float) : (float) The y-intercept of the linear regression (value at the oldest bar).
_inputDev (float) : (float) The input deviation multiplier.
_emphasis (float) : (float) Emphasis factor: 0 for equal weight; >0 emphasizes recent bars; <0 emphasizes older bars.
_condition (bool) : (bool) Flag to enable calculation (true = calculate).
Returns: A 2-element tuple: .
calcDevMean(_src, _len, _slope, _y1, _inputDev, _emphasis, _condition)
Calculates the mean absolute deviation from a forward-applied linear trend (oldest to most recent), with optional emphasis.
Parameters:
_src (float) : (float) The source data array, where _src is the most recent and _src is the oldest.
_len (int) : (int) The length of the lookback period.
_slope (float) : (float) The slope of the linear regression.
_y1 (float) : (float) The y-intercept (oldest bar) of the linear regression.
_inputDev (float) : (float) The input deviation multiplier.
_emphasis (float) : (float) Emphasis factor: 0 for equal weight; >0 emphasizes recent bars; <0 emphasizes older bars.
_condition (bool) : (bool) Flag to enable calculation (true = calculate).
Returns: A 2-element tuple: .
calcDevMedian(_src, _len, _slope, _y1, _inputDev, _emphasis, _condition)
Calculates the median absolute deviation with optional emphasis on recent data.
Parameters:
_src (float) : (float) The source data array (index 0 = oldest, index _len - 1 = most recent).
_len (int) : (int) The length of the lookback period.
_slope (float) : (float) The slope of the linear regression.
_y1 (float) : (float) The y-intercept (oldest bar) of the linear regression.
_inputDev (float) : (float) The deviation multiplier.
_emphasis (float) : (float) Emphasis factor: 0 for equal weight; >0 emphasizes recent bars; <0 emphasizes older bars.
_condition (bool) : (bool) Flag to enable calculation (true = calculate).
Returns:
calcDevPercent(_y1, _inputDev, _condition)
Calculates the percent deviation from a given value and a specified percentage.
Parameters:
_y1 (float) : (float) The base value from which to calculate deviation.
_inputDev (float) : (float) The deviation percentage.
_condition (bool) : (bool) Flag to enable calculation (true = calculate).
Returns: A 2-element tuple: .
calcDevFitted(_len, _slope, _y1, _emphasis, _condition)
Calculates the weighted fitted deviation based on high and low series data, showing max deviation, with optional emphasis.
Parameters:
_len (int) : (int) The length of the lookback period.
_slope (float) : (float) The slope of the linear regression.
_y1 (float) : (float) The Y-intercept (oldest bar) of the linear regression.
_emphasis (float) : (float) Emphasis factor: 0 for equal weight; >0 emphasizes recent bars; <0 emphasizes older bars.
_condition (bool) : (bool) Flag to enable calculation (true = calculate).
Returns: A 2-element tuple: .
calcDevATR(_src, _len, _slope, _y1, _inputDev, _emphasis, _condition)
Calculates an ATR-style deviation with optional emphasis on recent data.
Parameters:
_src (float) : (float) The source data (typically close).
_len (int) : (int) The length of the lookback period.
_slope (float) : (float) The slope of the linear regression.
_y1 (float) : (float) The Y-intercept (oldest bar) of the linear regression.
_inputDev (float) : (float) The input deviation multiplier.
_emphasis (float) : (float) Emphasis factor: 0 for equal weight; >0 emphasizes recent bars; <0 emphasizes older bars.
_condition (bool) : (bool) Flag to enable calculation (true = calculate).
Returns: A 2-element tuple: .
calcPricePositionPercent(_top, _bot, _src)
Calculates the percent position of a price within a linear regression channel. Top=100%, Bottom=0%.
Parameters:
_top (float) : (float) The top (positive) deviation, corresponding to 100%.
_bot (float) : (float) The bottom (negative) deviation, corresponding to 0%.
_src (float) : (float) The source price.
Returns: (float) The percent position within the channel.
plotLinReg(_len, _y1, _y2, _slope, _devTop, _devBot, _scaleTypeLog, _lineWidth, _extendLines, _channelStyle, _colorFill, _colUpLine, _colDnLine, _colUpFill, _colDnFill)
Plots the linear regression line and its deviations, with configurable styles and fill.
Parameters:
_len (int) : (int) The lookback period for the linear regression.
_y1 (float) : (float) The starting y-value of the regression line.
_y2 (float) : (float) The ending y-value of the regression line.
_slope (float) : (float) The slope of the regression line (used to determine line color).
_devTop (float) : (float) The top deviation to add to the line.
_devBot (float) : (float) The bottom deviation to subtract from the line.
_scaleTypeLog (bool) : (bool) Use a log scale if true; otherwise, linear scale.
_lineWidth (int) : (int) The width of the plotted lines.
_extendLines (string) : (string) How lines should extend (none, left, right, both).
_channelStyle (string) : (string) The style of the channel lines (solid, dashed, dotted).
_colorFill (bool) : (bool) Whether to fill the space between the top and bottom deviation lines.
_colUpLine (color) : (color) Line color when slope is positive.
_colDnLine (color) : (color) Line color when slope is negative.
_colUpFill (color) : (color) Fill color when slope is positive.
_colDnFill (color) : (color) Fill color when slope is negative.

RSI Divergence[UgurTash] – Real-Time📈 RSI Divergence – Real-Time, Adaptive, and Intelligent RSI Divergence Detection
🚀 What Does This Indicator Do?
RSI Divergence is a real-time divergence detection tool that helps traders identify bullish and bearish divergences between price and the Relative Strength Index (RSI). Unlike traditional RSI-based indicators, this script offers:
✅ Real-time detection – No need to wait for bar closes or repainting.
✅ Dynamic time-frame adaptation – The script automatically adjusts RSI settings based on the selected chart time frame.
✅ Multi-layered divergence analysis – Supports short-term, medium-term, and long-term divergence detection with an optional all-term mode that dynamically selects the best configuration.
🛠 How Does It Work?
Pivot-Based Divergence Detection:
The script analyzes pivot points on both price and RSI to determine valid divergences.
Bullish divergence occurs when price forms a lower low but RSI trends higher, indicating potential upward momentum.
Bearish divergence occurs when price forms a higher high but RSI trends lower, signaling possible weakness.
Adaptive RSI Calculation:
The RSI length is dynamically adjusted based on the chosen time frame:
Short-Term: RSI (7) for 1-5 min charts.
Medium-Term: RSI (14) for 15-60 min charts.
Long-Term: RSI (28) for 4H+ charts.
In All-Term Mode, the script automatically determines the best RSI length based on the active chart timeframe.
Smart Visualization & Alerts:
Bullish divergences are marked with green lines & labels.
Bearish divergences are highlighted in red.
Users can customize symbol size, divergence labels, and colors.
Instant alerts notify traders as soon as a divergence is detected.
🎯 How to Use This Indicator?
📌 For Trend Reversals: Look for bullish divergences at key support levels and bearish divergences at resistance zones.
📌 For Trend Continuation: Combine divergence signals with moving averages, volume analysis, or price action strategies to confirm trades.
📌 For Scalping & Swing Trading: Adjust the time-frame settings to match your trading style.
🏆 What Makes This Indicator Original?
🔹 Unlike standard RSI divergence indicators, this script features real-time analysis with no repainting, allowing for instant trading decisions.
🔹 The time-frame adaptive RSI makes it dynamic and suitable for any market condition.
🔹 The multi-term divergence detection offers flexibility, giving traders a precise view of both short-term & long-term market structure.
⚠ Note: No indicator guarantees 100% accuracy. Always use additional confirmations and sound risk management strategies.
If you find this tool useful, don’t forget to support & share! 🚀

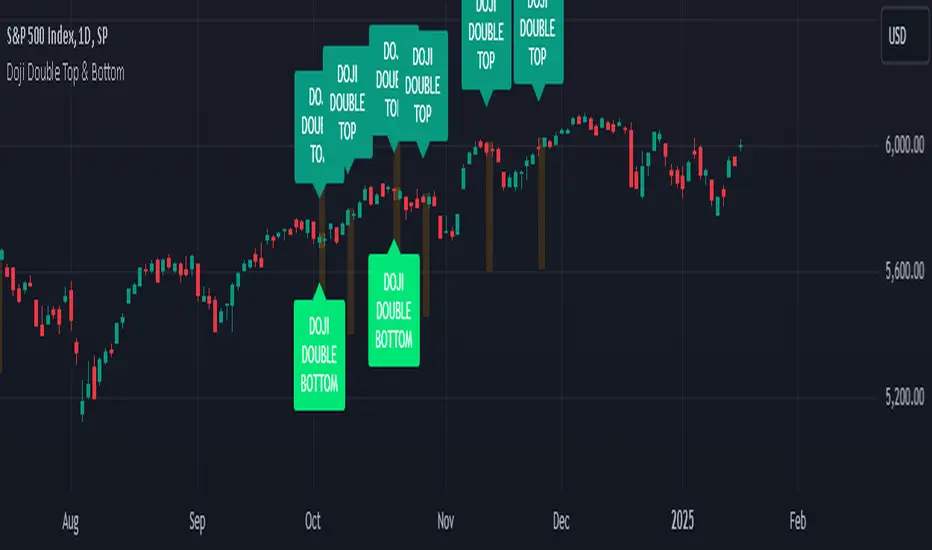
Doji Double Top & Double Bottom
FUNCTION :
This indicator checks if 2 consecutive candlesticks are formed in such a way that both the lows or both the highs of the consecutive candlesticks are almost at the same level and either of them is a doji
TIMEFRAMES :
it works on daily, weekly, monthly and higher timeframes
CRITERIA :
There is maximum difference value between 2 consecutive candlesticks' lows or 2 consecutive candlesticks' highs
Minimum value of the doji's wick size
Maximum value of the doji's body size
These 3 conditions need to be fulfilled for the 2 consecutive candlesticks to be considered as a Double top or Double bottom by this indicator
EXAMPLES :
Here the indicator is giving only double Bottom signals on CRUDE OIL chart
Here the indicator is giving only double top signals on GOLD chart
Here the indicator gives both double top & double bottom signals on EUR/USD Daily chart
Here the indicator is giving both double top & double bottom signals on EUR/USD Half-Yearly chart
DEFINITIONS :
There are 2 types -
DOJI DOUBLE BOTTOM - if the lows of 2 consecutive candlesticks are almost at the same level & either of them is doji then it is called Double Bottom and market is supposed to go higher after forming it.
DOJI DOUBLE TOP - if the highs of 2 consecutive candlesticks are almost at the same level & either of them is doji then it is called Double Top and market is supposed to go lower after forming it.
SETTINGS :
There are options to change the value of each of the 3 parameters within the indicator's settings for daily, weekly & monthly chart [
LIMITATIONS :
You should not trade based on the signals from this indicator solely, you should check other parameters too before making trading decision
Prime Bands [ChartPrime]The Prime Standard Deviation Bands indicator uses custom-calculated bands based on highest and lowest price values over specific period to analyze price volatility and trend direction. Traders can set the bands to 1, 2, or 3 standard deviations from a central base, providing a dynamic view of price behavior in relation to volatility. The indicator also includes color-coded trend signals, standard deviation labels, and mean reversion signals, offering insights into trend strength and potential reversal points.
⯁ KEY FEATURES AND HOW TO USE
⯌ Standard Deviation Bands :
The indicator plots upper and lower bands based on standard deviation settings (1, 2, or 3 SDs) from a central base, allowing traders to visualize volatility and price extremes. These bands can be used to identify overbought and oversold conditions, as well as potential trend reversals.
Example of 3-standard-deviation bands around price:
⯌ Dynamic Trend Indicator :
The midline of the bands changes color based on trend direction. If the midline is rising, it turns green, indicating an uptrend. When the midline is falling, it turns orange, suggesting a downtrend. This color coding provides a quick visual reference to the current trend.
Trend color examples for rising and falling midlines:
⯌ Standard Deviation Labels :
At the end of the bands, the indicator displays labels with price levels for each standard deviation level (+3, 0, -3, etc.), helping traders quickly reference where price is relative to its statistical boundaries.
Price labels at each standard deviation level on the chart:
⯌ Mean Reversion Signals :
When price moves beyond the upper or lower bands and then reverts back inside, the indicator plots mean reversion signals with diamond icons. These signals indicate potential reversal points where the price may return to the mean after extreme moves.
Example of mean reversion signals near bands:
⯌ Standard Deviation Scale on Chart :
A visual scale on the right side of the chart shows the current price position in relation to the bands, expressed in standard deviations. This scale provides an at-a-glance view of how far price has deviated from the mean, helping traders assess risk and volatility.
⯁ USER INPUTS
Length : Sets the number of bars used in the calculation of the bands.
Standard Deviation Level : Allows selection of 1, 2, or 3 standard deviations for upper and lower bands.
Colors : Customize colors for the uptrend and downtrend midline indicators.
⯁ CONCLUSION
The Prime Standard Deviation Bands indicator provides a comprehensive view of price volatility and trend direction. Its customizable bands, trend coloring, and mean reversion signals allow traders to effectively gauge price behavior, identify extreme conditions, and make informed trading decisions based on statistical boundaries.

Improved G-Trend DetectionIt is the Improved version of G trend channel detection.
The Umair Trend Detection Indicator is a powerful tool designed to help traders identify potential buy and sell opportunities by combining dynamic price channels with RSI-based confirmation. This indicator is suitable for all types of financial markets, including stocks, forex, and cryptocurrencies.
Key Features:
Dynamic G-Channels
Calculates upper, lower, and average price channels based on the "G-Channel" methodology.
Helps identify market extremes and potential reversal points.
RSI Confirmation
Integrates RSI (Relative Strength Index) to filter buy and sell signals.
Avoids false signals by ensuring market momentum aligns with trend direction.
Buy/Sell Signals
Generates "Buy" signals when bullish conditions align with oversold RSI levels.
Generates "Sell" signals when bearish conditions align with overbought RSI levels.
Exit Signals
Provides optional exit points for both long and short positions using a buffer for confirmation.
Visual Clarity
Displays clearly plotted channels and average lines to help visualize price trends.
Buy and sell signals are marked with arrows for easy identification on the chart.
Custom Alerts
Offers customizable alerts for buy, sell, and exit conditions, ensuring traders never miss an opportunity.
Input Parameters:
Channel Length: Controls the sensitivity of the G-Channels.
Multiplier: Adjusts the width of the channels to suit different market conditions.
RSI Settings: Customize RSI length and thresholds for overbought/oversold conditions.
Exit Signal Buffer: Adds flexibility to the exit strategy by delaying signals for confirmation.
How It Helps:
The Umair Trend Detection Indicator is perfect for traders looking for an easy-to-use trend-following system with strong confirmation. By combining dynamic channels with RSI, it provides accurate and reliable signals to enter and exit trades, minimizing risks associated with false breakouts or trend reversals.
Use Cases:
Trend Trading: Identify and follow long-term trends with confidence.
Swing Trading: Spot reversals and capitalize on medium-term price movements.
Risk Management: Use exit signals to lock in profits or limit losses effectively.
This indicator is a versatile tool for both novice and experienced traders. Fine-tune its settings to align with your trading style and improve your decision-making in any market.

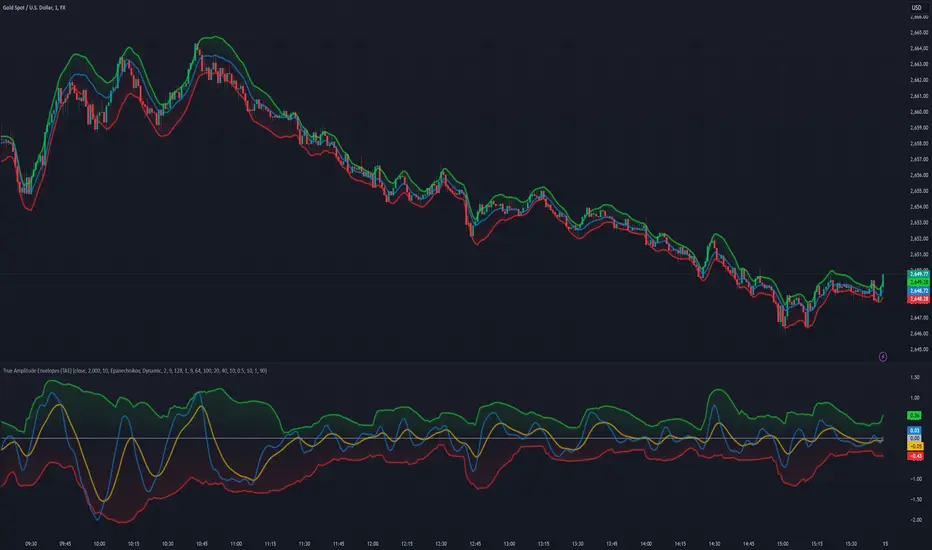
True Amplitude Envelopes (TAE)The True Envelopes indicator is an adaptation of the True Amplitude Envelope (TAE) method, based on the research paper " Improved Estimation of the Amplitude Envelope of Time Domain Signals Using True Envelope Cepstral Smoothing " by Caetano and Rodet. This indicator aims to create an asymmetric price envelope with strong predictive power, closely following the methodology outlined in the paper.
Due to the inherent limitations of Pine Script, the indicator utilizes a Kernel Density Estimator (KDE) in place of the original Cepstral Smoothing technique described in the paper. While this approach was chosen out of necessity rather than superiority, the resulting method is designed to be as effective as possible within the constraints of the Pine environment.
This indicator is ideal for traders seeking an advanced tool to analyze price dynamics, offering insights into potential price movements while working within the practical constraints of Pine Script. Whether used in dynamic mode or with a static setting, the True Envelopes indicator helps in identifying key support and resistance levels, making it a valuable asset in any trading strategy.
Key Features:
Dynamic Mode: The indicator dynamically estimates the fundamental frequency of the price, optimizing the envelope generation process in real-time to capture critical price movements.
High-Pass Filtering: Uses a high-pass filtered signal to identify and smoothly interpolate price peaks, ensuring that the envelope accurately reflects significant price changes.
Kernel Density Estimation: Although implemented as a workaround, the KDE technique allows for flexible and adaptive smoothing of the envelope, aimed at achieving results comparable to the more sophisticated methods described in the original research.
Symmetric and Asymmetric Envelopes: Provides options to select between symmetric and asymmetric envelopes, accommodating various trading strategies and market conditions.
Smoothness Control: Features adjustable smoothness settings, enabling users to balance between responsiveness and the overall smoothness of the envelopes.
The True Envelopes indicator comes with a variety of input settings that allow traders to customize the behavior of the envelopes to match their specific trading needs and market conditions. Understanding each of these settings is crucial for optimizing the indicator's performance.
Main Settings
Source: This is the data series on which the indicator is applied, typically the closing price (close). You can select other price data like open, high, low, or a custom series to base the envelope calculations.
History: This setting determines how much historical data the indicator should consider when calculating the envelopes. A value of 0 will make the indicator process all available data, while a higher value restricts it to the most recent n bars. This can be useful for reducing the computational load or focusing the analysis on recent market behavior.
Iterations: This parameter controls the number of iterations used in the envelope generation algorithm. More iterations will typically result in a smoother envelope, but can also increase computation time. The optimal number of iterations depends on the desired balance between smoothness and responsiveness.
Kernel Style: The smoothing kernel used in the Kernel Density Estimator (KDE). Available options include Sinc, Gaussian, Epanechnikov, Logistic, and Triangular. Each kernel has different properties, affecting how the smoothing is applied. For example, Gaussian provides a smooth, bell-shaped curve, while Epanechnikov is more efficient computationally with a parabolic shape.
Envelope Style: This setting determines whether the envelope should be Static or Dynamic. The Static mode applies a fixed period for the envelope, while the Dynamic mode automatically adjusts the period based on the fundamental frequency of the price data. Dynamic mode is typically more responsive to changing market conditions.
High Q: This option controls the quality factor (Q) of the high-pass filter. Enabling this will increase the Q factor, leading to a sharper cutoff and more precise isolation of high-frequency components, which can help in better identifying significant price peaks.
Symmetric: This setting allows you to choose between symmetric and asymmetric envelopes. Symmetric envelopes maintain an equal distance from the central price line on both sides, while asymmetric envelopes can adjust differently above and below the price line, which might better capture market conditions where upside and downside volatility are not equal.
Smooth Envelopes: When enabled, this setting applies additional smoothing to the envelopes. While this can reduce noise and make the envelopes more visually appealing, it may also decrease their responsiveness to sudden market changes.
Dynamic Settings
Extra Detrend: This setting toggles an additional high-pass filter that can be applied when using a long filter period. The purpose is to further detrend the data, ensuring that the envelope focuses solely on the most recent price oscillations.
Filter Period Multiplier: This multiplier adjusts the period of the high-pass filter dynamically based on the detected fundamental frequency. Increasing this multiplier will lengthen the period, making the filter less sensitive to short-term price fluctuations.
Filter Period (Min) and Filter Period (Max): These settings define the minimum and maximum bounds for the high-pass filter period. They ensure that the filter period stays within a reasonable range, preventing it from becoming too short (and overly sensitive) or too long (and too sluggish).
Envelope Period Multiplier: Similar to the filter period multiplier, this adjusts the period for the envelope generation. It scales the period dynamically to match the detected price cycles, allowing for more precise envelope adjustments.
Envelope Period (Min) and Envelope Period (Max): These settings establish the minimum and maximum bounds for the envelope period, ensuring the envelopes remain adaptive without becoming too reactive or too slow.
Static Settings
Filter Period: In static mode, this setting determines the fixed period for the high-pass filter. A shorter period will make the filter more responsive to price changes, while a longer period will smooth out more of the price data.
Envelope Period: This setting specifies the fixed period used for generating the envelopes in static mode. It directly influences how tightly or loosely the envelopes follow the price action.
TAE Smoothing: This controls the degree of smoothing applied during the TAE process in static mode. Higher smoothing values result in more gradual envelope curves, which can be useful in reducing noise but may also delay the envelope’s response to rapid price movements.
Visual Settings
Top Band Color: This setting allows you to choose the color for the upper band of the envelope. This band represents the resistance level in the price action.
Bottom Band Color: Similar to the top band color, this setting controls the color of the lower band, which represents the support level.
Center Line Color: This is the color of the central price line, often referred to as the carrier. It represents the detrended price around which the envelopes are constructed.
Line Width: This determines the thickness of the plotted lines for the top band, bottom band, and center line. Thicker lines can make the envelopes more visible, especially when overlaid on price data.
Fill Alpha: This controls the transparency level of the shaded area between the top and bottom bands. A lower alpha value will make the fill more transparent, while a higher value will make it more opaque, helping to highlight the envelope more clearly.
The envelopes generated by the True Envelopes indicator are designed to provide a more precise and responsive representation of price action compared to traditional methods like Bollinger Bands or Keltner Channels. The core idea behind this indicator is to create a price envelope that smoothly interpolates the significant peaks in price action, offering a more accurate depiction of support and resistance levels.
One of the critical aspects of this approach is the use of a high-pass filtered signal to identify these peaks. The high-pass filter serves as an effective method of detrending the price data, isolating the rapid fluctuations in price that are often lost in standard trend-following indicators. By filtering out the lower frequency components (i.e., the trend), the high-pass filter reveals the underlying oscillations in the price, which correspond to significant peaks and troughs. These oscillations are crucial for accurately constructing the envelope, as they represent the most responsive elements of the price movement.
The algorithm works by first applying the high-pass filter to the source price data, effectively detrending the series and isolating the high-frequency price changes. This filtered signal is then used to estimate the fundamental frequency of the price movement, which is essential for dynamically adjusting the envelope to current market conditions. By focusing on the peaks identified in the high-pass filtered signal, the algorithm generates an envelope that is both smooth and adaptive, closely following the most significant price changes without overfitting to transient noise.
Compared to traditional envelopes and bands, such as Bollinger Bands and Keltner Channels, the True Envelopes indicator offers several advantages. Bollinger Bands, which are based on standard deviations, and Keltner Channels, which use the average true range (ATR), both tend to react to price volatility but do not necessarily follow the peaks and troughs of the price with precision. As a result, these traditional methods can sometimes lag behind or fail to capture sudden shifts in price momentum, leading to either false signals or missed opportunities.
In contrast, the True Envelopes indicator, by using a high-pass filtered signal and a dynamic period estimation, adapts more quickly to changes in price behavior. The envelopes generated by this method are less prone to the lag that often affects standard deviation or ATR-based bands, and they provide a more accurate representation of the price's immediate oscillations. This can result in better predictive power and more reliable identification of support and resistance levels, making the True Envelopes indicator a valuable tool for traders looking for a more responsive and precise approach to market analysis.
In conclusion, the True Envelopes indicator is a powerful tool that blends advanced theoretical concepts with practical implementation, offering traders a precise and responsive way to analyze price dynamics. By adapting the True Amplitude Envelope (TAE) method through the use of a Kernel Density Estimator (KDE) and high-pass filtering, this indicator effectively captures the most significant price movements, providing a more accurate depiction of support and resistance levels compared to traditional methods like Bollinger Bands and Keltner Channels. The flexible settings allow for extensive customization, ensuring the indicator can be tailored to suit various trading strategies and market conditions.
PitchforkLibrary "Pitchfork"
Pitchfork class
method tostring(this)
Converts PitchforkTypes/Fork object to string representation
Namespace types: Fork
Parameters:
this (Fork) : PitchforkTypes/Fork object
Returns: string representation of PitchforkTypes/Fork
method tostring(this)
Converts Array of PitchforkTypes/Fork object to string representation
Namespace types: array
Parameters:
this (array) : Array of PitchforkTypes/Fork object
Returns: string representation of PitchforkTypes/Fork array
method tostring(this, sortKeys, sortOrder)
Converts PitchforkTypes/PitchforkProperties object to string representation
Namespace types: PitchforkProperties
Parameters:
this (PitchforkProperties) : PitchforkTypes/PitchforkProperties object
sortKeys (bool) : If set to true, string output is sorted by keys.
sortOrder (int) : Applicable only if sortKeys is set to true. Positive number will sort them in ascending order whreas negative numer will sort them in descending order. Passing 0 will not sort the keys
Returns: string representation of PitchforkTypes/PitchforkProperties
method tostring(this, sortKeys, sortOrder)
Converts PitchforkTypes/PitchforkDrawingProperties object to string representation
Namespace types: PitchforkDrawingProperties
Parameters:
this (PitchforkDrawingProperties) : PitchforkTypes/PitchforkDrawingProperties object
sortKeys (bool) : If set to true, string output is sorted by keys.
sortOrder (int) : Applicable only if sortKeys is set to true. Positive number will sort them in ascending order whreas negative numer will sort them in descending order. Passing 0 will not sort the keys
Returns: string representation of PitchforkTypes/PitchforkDrawingProperties
method tostring(this, sortKeys, sortOrder)
Converts PitchforkTypes/Pitchfork object to string representation
Namespace types: Pitchfork
Parameters:
this (Pitchfork) : PitchforkTypes/Pitchfork object
sortKeys (bool) : If set to true, string output is sorted by keys.
sortOrder (int) : Applicable only if sortKeys is set to true. Positive number will sort them in ascending order whreas negative numer will sort them in descending order. Passing 0 will not sort the keys
Returns: string representation of PitchforkTypes/Pitchfork
method createDrawing(this)
Creates PitchforkTypes/PitchforkDrawing from PitchforkTypes/Pitchfork object
Namespace types: Pitchfork
Parameters:
this (Pitchfork) : PitchforkTypes/Pitchfork object
Returns: PitchforkTypes/PitchforkDrawing object created
method createDrawing(this)
Creates PitchforkTypes/PitchforkDrawing array from PitchforkTypes/Pitchfork array of objects
Namespace types: array
Parameters:
this (array) : array of PitchforkTypes/Pitchfork object
Returns: array of PitchforkTypes/PitchforkDrawing object created
method draw(this)
draws from PitchforkTypes/PitchforkDrawing object
Namespace types: PitchforkDrawing
Parameters:
this (PitchforkDrawing) : PitchforkTypes/PitchforkDrawing object
Returns: PitchforkTypes/PitchforkDrawing object drawn
method delete(this)
deletes PitchforkTypes/PitchforkDrawing object
Namespace types: PitchforkDrawing
Parameters:
this (PitchforkDrawing) : PitchforkTypes/PitchforkDrawing object
Returns: PitchforkTypes/PitchforkDrawing object deleted
method delete(this)
deletes underlying drawing of PitchforkTypes/Pitchfork object
Namespace types: Pitchfork
Parameters:
this (Pitchfork) : PitchforkTypes/Pitchfork object
Returns: PitchforkTypes/Pitchfork object deleted
method delete(this)
deletes array of PitchforkTypes/PitchforkDrawing objects
Namespace types: array
Parameters:
this (array) : Array of PitchforkTypes/PitchforkDrawing object
Returns: Array of PitchforkTypes/PitchforkDrawing object deleted
method delete(this)
deletes underlying drawing in array of PitchforkTypes/Pitchfork objects
Namespace types: array
Parameters:
this (array) : Array of PitchforkTypes/Pitchfork object
Returns: Array of PitchforkTypes/Pitchfork object deleted
method clear(this)
deletes array of PitchforkTypes/PitchforkDrawing objects and clears the array
Namespace types: array
Parameters:
this (array) : Array of PitchforkTypes/PitchforkDrawing object
Returns: void
method clear(this)
deletes array of PitchforkTypes/Pitchfork objects and clears the array
Namespace types: array
Parameters:
this (array) : Array of Pitchfork/Pitchfork object
Returns: void
PitchforkDrawingProperties
Pitchfork Drawing Properties object
Fields:
extend (series bool) : If set to true, forks are extended towards right. Default is true
fill (series bool) : Fill forklines with transparent color. Default is true
fillTransparency (series int) : Transparency at which fills are made. Only considered when fill is set. Default is 80
forceCommonColor (series bool) : Force use of common color for forks and fills. Default is false
commonColor (series color) : common fill color. Used only if ratio specific fill colors are not available or if forceCommonColor is set to true.
PitchforkDrawing
Pitchfork drawing components
Fields:
medianLine (Line type from Trendoscope/Drawing/2) : Median line of the pitchfork
baseLine (Line type from Trendoscope/Drawing/2) : Base line of the pitchfork
forkLines (array type from Trendoscope/Drawing/2) : fork lines of the pitchfork
linefills (array type from Trendoscope/Drawing/2) : Linefills between forks
Fork
Fork object property
Fields:
ratio (series float) : Fork ratio
forkColor (series color) : color of fork. Default is blue
include (series bool) : flag to include the fork in drawing. Default is true
PitchforkProperties
Pitchfork Properties
Fields:
forks (array) : Array of Fork objects
type (series string) : Pitchfork type. Supported values are "regular", "schiff", "mschiff", Default is regular
inside (series bool) : Flag to identify if to draw inside fork. If set to true, inside fork will be drawn
Pitchfork
Pitchfork object
Fields:
a (chart.point) : Pivot Point A of pitchfork
b (chart.point) : Pivot Point B of pitchfork
c (chart.point) : Pivot Point C of pitchfork
properties (PitchforkProperties) : PitchforkProperties object which determines type and composition of pitchfork
dProperties (PitchforkDrawingProperties) : Drawing properties for pitchfork
lProperties (LineProperties type from Trendoscope/Drawing/2) : Common line properties for Pitchfork lines
drawing (PitchforkDrawing) : PitchforkDrawing object
Double Top/Bottom [AlgoAlpha]Introducing the Double Top/Bottom Indicator by AlgoAlpha, a powerful tool designed to identify key reversal patterns in the market with precision. This indicator meticulously detects double tops and double bottoms, helping traders recognize potential trend reversals and make informed trading decisions.
Key Features:
🔍 Pattern Detection : Accurately identifies double top and double bottom formations based on customizable time horizons.
🎨 Customizable Appearance : Choose your preferred colors for bullish and bearish trends to match your trading style.
📊 Signal Labels : Option to display only the second pivot of the double top/bottom for a cleaner chart view.
🔧 Flexible Settings : Adjust the time horizon to control the look-back period, allowing for detection of both short-term and long-term patterns.
📈 Visual Enhancements : Draws trend lines and fills between pivotal points to visually highlight potential reversal zones.
🔔 Alerts : Set up alerts for potential double top and double bottom formations to stay informed of key market movements.
How to Use the Double Top/Bottom Indicator :
🛠 Add the Indicator : Simply add the Double Top/Bottom Indicator to your TradingView chart from your favorites. Customize the time horizon and appearance settings to fit your trading preferences.
📊 Analyze Patterns : Watch for the identified double top and double bottom patterns along with the corresponding trend lines and filled areas to anticipate potential market reversals.
🔔 Set Alerts : Enable alerts to receive notifications when double top or double bottom patterns are detected, ensuring you never miss a critical trading opportunity.
How It Works : The indicator scans the price action for pivot highs and lows within a specified time horizon, identifying potential double top and double bottom patterns. It maintains a sequence of these pivots and verifies the formation of these patterns based on the relationship between consecutive pivots and the proximity to a defined limit. When a double top or double bottom is confirmed, the indicator marks the second pivot point with a label and draws trend lines to visualize the reversal pattern. Additionally, it provides alert conditions to notify traders of potential confirmations, enhancing decision-making without cluttering the chart.
⚠️ Important Reminder : The labels indicating double tops and bottoms appear with a delay and are intended to mark the formations after they have already formed. They are not meant to be used as real-time trading signals. While they align perfectly with pivot points in hindsight, please use them as markers for analysis rather than immediate trading triggers.

Flag Screener [QuantVue]Flag Screener is a screening tool that identify bull and bear flags in up to 40 different symbols.
The indicator takes a comma separated list of symbols and then scans the symbols in real time to detect bull or bear flags.
What are flags
Flags are continuation patterns that occur within the general trend of the security. A bull flag represents a temporary pause or consolidation before price resumes it's upward movement, while a bear flag occurs before price continues its downward movement.
Both flag patterns consist of two components:
The Pole
The Flag
The pole is the initial strong upward surge or decline that precedes the flag. The pole is usually a fast move accompanied by heavy volume signaling significant buying or selling pressure.
The flag is then formed as price consolidates after the initial surge or decline from the pole. For a bull flag price will drift slightly downward to sideways, a bear flag will drift upward to sideways. The best flags often see volume dry up during this phase of the pattern.
Indicator Settings
Both components are fully customizable in the indicator so the user can adjust for any time frame or volatility. Select the minimum and maximum accepted limits from the % gain loss required for the pole, the maximum acceptable flag depth or rally and the minimum and maximum number of bars for each component.

FVG Channel [LuxAlgo]The FVG Channel indicator displays a channel constructed from the averages of unmitigated historical fair value gaps (FVG), allowing to identify trends and potential reversals in the market.
Users can control the amount of FVGs to consider for the calculation of the channels, as well as their degree of smoothness through user settings.
🔶 USAGE
The FVG Channel is constructed by averaging together recent unmitigated Bullish FVGs (contributing to the creation of the upper bands), and Bearish unmitigated FVGs (contributing to the creation of the lower bands) within a lookback determined by the user. A higher lookback will return longer-term indications from the indicator.
The channel includes 5 bands, with one upper and one lower outer extremities, as well as an inner series of values determined using the Fibonacci ratios (respectively 0.786, 0.5, 0.236) from the channel's outer extremities.
An uptrend can be identified by price holding above the inner upper band (obtained from the 0.786 ratio), this band can also provide occasional support when the price retraces to it while in an uptrend.
Breaking below the inner upper band with an unwillingness to reach above again is a clear sign of hesitation in the market and can be indicative of an upcoming consolidation or reversal.
This can directly be applied to downtrends as well, below are examples displaying both scenarios.
Uptrend Example:
Downtrend Example:
🔹 Breakout Levels
When the price mitigates all FVGs in a single direction except for 1, the indicator will display a "Breakout Level". This is the level that price will need to cross in order for all FVGs in that direction to be mitigated, because of this they can also be aptly called "Last Stand Levels".
These levels can be considered as potential support and resistance levels, however, should always be monitored for breakouts since a substantial push above or below these points would indicate strong momentum.
🔹 Signals
The indicator includes Bullish and Bearish Signals, these signals fire when all FVGs for a single direction have been mitigated and an engulfing candle occurs in the opposite direction. These are reversal signals and should be used alongside other indicators to appropriately manage risk.
Note: When all FVGs in a single direction have been mitigated, the candles will change colors accordingly.
🔶 DETAILS
The script uses a typical identification method for FVGs. Once identified, the script collects and stores the mitigation levels of the respective bullish and bearish FVGs:
For Bullish FVGs this is the bottom of the FVG.
For Bearish FVGs this is the top of the FVG.
The data is managed to only consider a specific amount of FVG mitigation levels, determined by the set "Unmitigated FVG Lookback". If an FVG is mitigated, it frees up a spot in the memory for a new FVG, however, if the memory is full, the oldest will be deleted.
The averages displayed (Channel Upper and Lower) are created from 2 calculation steps, the first step involves taking the raw average of the FVG mitigation levels, and the second step applies a simple moving average (SMA) smoothing of the precedent obtained averages.
Note: To view the mitigation levels average obtained in the first step, the "Smoothing Length" can be set to 1.
🔶 SETTINGS
Unmitigated FVG Lookback: Sets the maximum number of Unmitigated FVG mitigation levels that the script will use to calculate the channel.
Smoothing Length: Sets the smoothing length for the channel to reduce noise from the raw data.

Periodic Linear Regressions [LuxAlgo]The Periodic Linear Regressions (PLR) indicator calculates linear regressions periodically (similar to the VWAP indicator) based on a user-set period (anchor).
This allows for estimating underlying trends in the price, as well as providing potential supports/resistances.
🔶 USAGE
The Periodic Linear Regressions indicator calculates a linear regression over a user-selected interval determined from the selected "Anchor Period".
The PLR can be visualized as a regular linear regression (Static), with a fit readjusting for new data points until the end of the selected period, or as a moving average (Rolling), with new values obtained from the last point of a linear regression fitted over the calculation interval. While the static method line is prone to repainting, it has value since it can further emphasize the linearity of an underlying trend, as well as suggest future trend directions by extrapolating the fit.
Extremities are included in the indicator, these are obtained from the root mean squared error (RMSE) between the price and calculated linear regression. The Multiple setting allows the users to control how far each extremity is from the other.
Periodic Linear Regressions can be helpful in finding support/resistance areas or even opportunities when ranging in a channel.
The anchor - where a new period starts - can be shown (in this case in the top right corner).
The shown bands can be visualized by enabling Show Extremities in settings ( Rolling or Static method).
The script includes a background gradient color option for the bands, which only applies when using the Rolling method.
The indicator colors can be suggestive of the detected trend and are determined as follows:
Method Rolling: a gradient color between red and green indicates the trend; more green if the output is rising, suggesting an uptrend, and more red if it is decreasing, suggesting a downtrend.
Method Static: green if the slope of the line is positive, suggesting an uptrend, red if negative, suggesting a downtrend.
🔶 DETAILS
🔹 Anchor Type
When the Anchor Type is set to Periodic , the indicator will be reset when the "Anchor Period" changes, after which calculations will start again.
An anchored rolling line set at First Bar won't reset at a new session; it will continue calculating the linear regression from the first bar to the last; in other words, every bar is included in the calculation. This can be useful to detect potential long-term tops/bottoms.
Note that a linear regression needs at least two values for its calculation, which explains why you won't see a static line at the first bar of the session. The rolling linear regression will only show from the 3rd bar of the session since it also needs a previous value.
🔹 Rolling/Static
When Anchor Type is set at Periodic , a linear regression is calculated between the first bar of the chosen session and the current bar, aiming to find the line that best fits the dataset.
The example above shows the lines drawn during the session. The offered script, though, shows the last calculated point connected to the previous point when the Rolling method is chosen, while the Static method shows the latest line.
Note that linear regression needs at least two values, which explains why you won't see a static line at the first bar of the session. The rolling line will only show from the 3rd bar of the session since it also needs a previous value.
🔶 SETTINGS
Method: Indicator method used, with options: "Static" (straight line) / "Rolling" (rolling linear regression).
Anchor Type: "Periodic / First Bar" (the latter works only when "Method" is set to "Rolling").
Anchor Period: Only applicable when "Anchor Type" is set at "Periodic".
Source: open, high, low, close, ...
Multiple: Alters the width of the bands when "Show Extremities" is enabled.
Show Extremities: Display one upper and one lower extremity.
🔹 Color Settings
Mono Color: color when "Bicolor" is disabled
Bicolor: Toggle on/off + Colors
Gradient: Background color when "Show extremities" is enabled + level of gradient
🔹 Dashboard
Show Dashboard
Location of dashboard
Text size

HTF TriangleHTF Triangle by ZeroHeroTrading aims at detecting ascending and descending triangles using higher time frame data, without repainting nor misalignment issues.
It addresses user requests for combining Ascending Triangle and Descending Triangle into one indicator.
Ascending triangles are defined by an horizontal upper trend line and a rising lower trend line. It is a chart pattern used in technical analysis to predict the continuation of an uptrend.
Descending triangles are defined by a falling upper trend line and an horizontal lower trend line. It is a chart pattern used in technical analysis to predict the continuation of a downtrend.
This indicator can be useful if you, like me, believe that higher time frames can offer a broader perspective and provide clearer signals, smoothing out market noise and showing longer-term trends.
You can change the indicator settings as you see fit to tighten or loosen the detection, and achieve the best results for your use case.
Features
It draws the detected ascending and descending triangles on the chart.
It supports alerting when a detection occurs.
It allows for selecting ascending and/or descending triangle detection.
It allows for setting the higher time frame to run the detection on.
It allows for setting the minimum number of consecutive valid higher time frame bars to fit the pattern criteria.
It allows for setting a high/low factor detection criteria to apply on higher time frame bars high/low as a proportion of the distance between the reference bar high/low and open/close.
It allows for turning on an adjustment of the triangle using highest/lowest values within valid higher time frame bars.
Settings
Ascending checkbox: Turns on/off ascending triangle detection. Default is on.
Descending checkbox: Turns on/off descending triangle detection. Default is on.
Higher Time Frame dropdown: Selects higher time frame to run the detection on. It must be higher than, and a multiple of, the chart's timeframe. Default is 5 minutes.
Valid Bars Minimum field: Sets minimum number of consecutive valid higher time frame bars to fit the pattern criteria. Default is 3. Minimum is 1.
High/Low Factor checkbox: Turns on/off high/low factor detection criteria. Default is on.
High/Low Factor field: Sets high/low factor to apply on higher time frame bars high/low as a proportion of the distance between the reference bar high/low and open/close. Default is 0. Minimum is 0. Maximum is 1.
Adjust Triangle checkbox: Turns on/off triangle adjustment using highest/lowest values within valid higher time frame bars. Default is on.
Detection Algorithm Notes
The detection algorithm recursively selects a higher time frame bar as reference. Then it looks at the consecutive higher time frame bars (as per the requested number of minimum valid bars) as follows:
Ascending Triangle
Low must be higher than previous bar.
Open/close max value must be lower than (or equal to) reference bar high.
When high/low factor criteria is turned on, high must be higher than (or equal to) reference bar open/close max value plus high/low factor proportion of the distance between reference bar high and open/close max value.
Descending Triangle
High must be lower than previous bar.
Open/close min value must be higher than (or equal to) reference bar low.
When high/low factor criteria is turned on, low must be lower than (or equal to) reference bar open/close min value minus high/low factor proportion of the distance between reference bar low and open/close min value.

Half Cup [LuxAlgo]The Half Cup indicator detects and displays patterns with the shape of a Half Cup , initiating a channel. From this channel, breakouts are detected and highlighted with dots.
Users can control the shape of the Half Cup and the channel length through various settings.
Do note that the displayed half cups are displayed retrospectively, making them subject to backpainting.
🔶 USAGE
The idea behind the indicator is derived from the Cup & Handle pattern, which requires waiting for the pattern full completion.
Our Half Cup publication aims to find opportunities when the potential cup is only formed halfway.
In this example, a green dot shows the first breakout of the upper channel extremity. A few bars later, the price went under it, after which it returned above, triggering a second green dot. Both triggers were good opportunities in this case, and the price rose afterward.
The Half Cup pattern can be the start of a potential complete Cup & Handle (As in the example above, a complete Cup pattern (without the Handle ) is shown, manually drawn with dashed lines).
Every green/red dot, whether on a bullish or bearish pattern, points to a breakout respectively above/below the channel.
Besides drawing patterns and the corresponding breakouts, the Half Cup indicator can also provide insights into trends and potential opportunities in the long run.
🔶 DETAILS
🔹 Validation
Several criteria must be fulfilled before a visible pattern on the chart is drawn.
Calculations are done beforehand to know where the Half Cup pattern would be positioned.
The pattern's bottom and top edges are checked for the number of bars whose closing price is outside the half-cup area. When the number of breakouts above/below is equal to or lower than the user-defined settings ( Max % Breaks Top/Bottom ), the pattern is drawn together with a brighter-colored channel next to it.
Dots highlighting the channel's breakout can be drawn from that moment until the end of both channel lines.
🔹 Positioning
Users can adjust the following settings to fit their needs:
% Broadness: Moves the Top/Bottom line (bullish or bearish) diagonally upwards/downwards.
Vertical Shift: Shifts the entire pattern up/down.
Channel Length: Sets the line length of the channel.
Note that adjusting the position of the pattern will change the validation; the script will be rerun to check if patterns are still valid or if new patterns can be drawn. Some patterns may disappear, while new ones may appear.
Before adjusting the position, the user can set Max % Breaks Top/Bottom at 100%. When the positioning is set, Max % Breaks Top/Bottom can be set as desired.
🔹 Updated Drawings
The Half Cup pattern is always drawn retrospectively (that is it is subject to backpainting), the channel is drawn from the bar from where the pattern is detected. Every breakout of the channel will remain visible as dots.
When a new swing high/low is found while the previous swing low/high remains the same, the pattern is updated to minimize clutter. The dots of earlier drawings will remain visible (to ensure no repainting occurs), but the color becomes faded, as such bright dots are associated with patterns that are visible on the chart, while faded dots are from removed/updated patterns.
🔶 SETTINGS
Swing Length: Period used for the swing detection, with higher values returning longer-term Swing Levels.
🔹 Validation
Max % Breaks Bottom: Allowed maximum amount of bars where the closing price is below the bottom of the Half Cup pattern against the total width of the pattern (bars).
Max % Breaks Top: Allowed maximum amount of bars where the closing price is above the top of the Half Cup pattern against the total width of the pattern (bars).
🔹 Positioning
% Broadness: Moves the Top/Bottom line (bullish or bearish) diagonally upwards/downwards.
Vertical Shift: Shifts the entire pattern up/down.
Channel Length: Sets the line length of the channel.

HTF Descending TriangleHTF Descending Triangle aims at detecting descending triangles using higher time frame data, without repainting nor misalignment issues.
Descending triangles are defined by a falling upper trend line and an horizontal lower trend line. It is a chart pattern used in technical analysis to predict the continuation of a downtrend.
This indicator can be useful if you, like me, believe that higher time frames can offer a broader perspective and provide clearer signals, smoothing out market noise and showing longer-term trends.
You can change the indicator settings as you see fit to tighten or loosen the detection, and achieve the best results for your use case.
Features
It draws the detected descending triangle on the chart.
It supports alerting when a detection occurs.
It allows for setting the higher time frame to run the detection on.
It allows for setting the minimum number of consecutive valid higher time frame bars to fit the pattern criteria.
It allows for setting a low factor detection criteria to apply on higher time frame bars low as a proportion of the distance between the reference bar low and open/close.
It allows for turning on an adjustment of the triangle using highest/lowest values within valid higher time frame bars.
Settings
Higher Time Frame dropdown: Selects higher time frame to run the detection on. It must be higher than, and a multiple of, the chart's timeframe.
Valid Bars Minimum field: Sets minimum number of consecutive valid higher time frame bars to fit the pattern criteria.
Low Factor checkbox: Turns on/off low factor detection criteria.
Low Factor field: Sets low factor to apply on higher time frame bars low as a proportion of the distance between the reference bar low and open/close.
Adjust Triangle checkbox: Turns on/off triangle adjustment using highest/lowest values within valid higher time frame bars.
Detection Algorithm Notes
The detection algorithm recursively selects a higher time frame bar as reference. Then it looks at the consecutive higher time frame bars (as per the requested number of minimum valid bars) as follows:
High must be lower than previous bar.
Open/close min value must be higher than reference bar low.
When low factor criteria is turned on, low must be lower than reference bar open/close min value minus low factor proportion of the distance between reference bar low and open/close min value.

HTF Ascending TriangleHTF Ascending Triangle aims at detecting ascending triangles using higher time frame data, without repainting nor misalignment issues.
Ascending triangles are defined by an horizontal upper trend line and a rising lower trend line. It is a chart pattern used in technical analysis to predict the continuation of an uptrend.
This indicator can be useful if you, like me, believe that higher time frames can offer a broader perspective and provide clearer signals, smoothing out market noise and showing longer-term trends.
You can change the indicator settings as you see fit to tighten or loosen the detection, and achieve the best results for your use case.
Features
It draws the detected ascending triangle on the chart.
It supports alerting when a detection occurs.
It allows for setting the higher time frame to run the detection on.
It allows for setting the minimum number of consecutive valid higher time frame bars to fit the pattern criteria.
It allows for setting a high factor detection criteria to apply on higher time frame bars high as a proportion of the distance between the reference bar high and open/close.
It allows for turning on an adjustment of the triangle using highest/lowest values within valid higher time frame bars.
Settings
Higher Time Frame dropdown: Selects higher time frame to run the detection on. It must be higher than, and a multiple of, the chart's timeframe.
Valid Bars Minimum field: Sets minimum number of consecutive valid higher time frame bars to fit the pattern criteria.
High Factor checkbox: Turns on/off high factor detection criteria.
High Factor field: Sets high factor to apply on higher time frame bars high as a proportion of the distance between the reference bar high and close/open.
Adjust Triangle checkbox: Turns on/off triangle adjustment using highest/lowest values within valid higher time frame bars.
Detection Algorithm Notes
The detection algorithm recursively selects a higher time frame bar as reference. Then it looks at the consecutive higher time frame bars (as per the requested number of minimum valid bars) as follows:
Low must be higher than previous bar.
Open/close max value must be lower than reference bar high.
When high factor criteria is turned on, high must be higher than reference bar open/close max value plus high factor proportion of the distance between reference bar high and open/close max value.
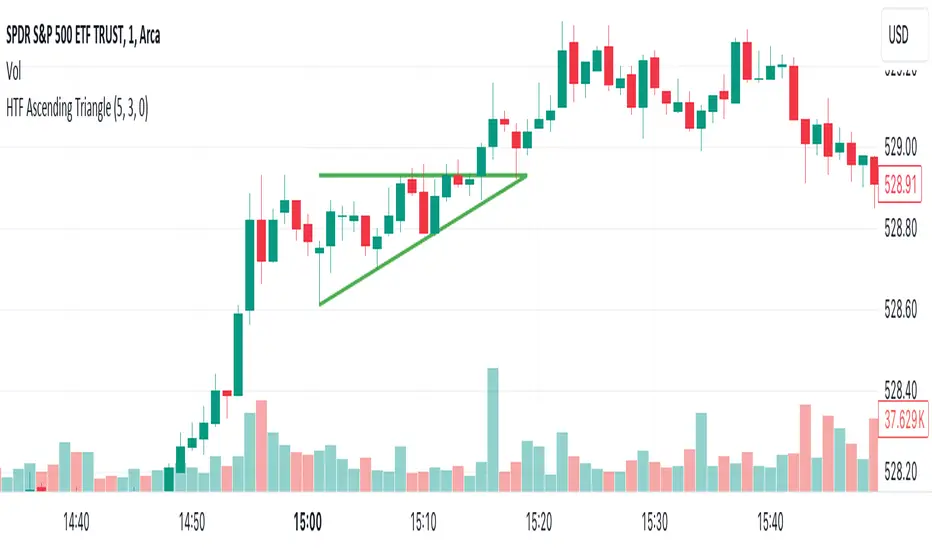
Flags With Measured Move [QuantVue]Flags with Measured Moves is a technical analysis tool that identifies bull flags and provides a measured move target.
A bull flag is a continuation pattern that occurs within the context of a general uptrend. It represents a pause or small consolidation before the price resumes its upward movement.
A bull flag consists of two sections: the flagpole and the flag.
The flagpole is the initial upward movement that occurs before the flag forms.
The flag forms as the price consolidates after the initial uptrend. During this phase, the price tends to drift downward or sideways, ideally with declining volume.
Once the flag has put in a low, the initial range of thrust is added to the flag low to form the measured move target.
Every element of the flag is customizable by the trader, including the size and length of the prior uptrend and the minimum and maximum flag depth and length.
The indicator also includes alerts for when new flags are formed, when a breakout from the flag occurs, and when the measured move target is reached.
By default, the indicator settings are set for use on a daily timeframe. If using the indicator on an intraday timeframe, you will need to adjust the settings.
Give this indicator a BOOST and COMMENT your thoughts!
We hope you enjoy.
Cheers!
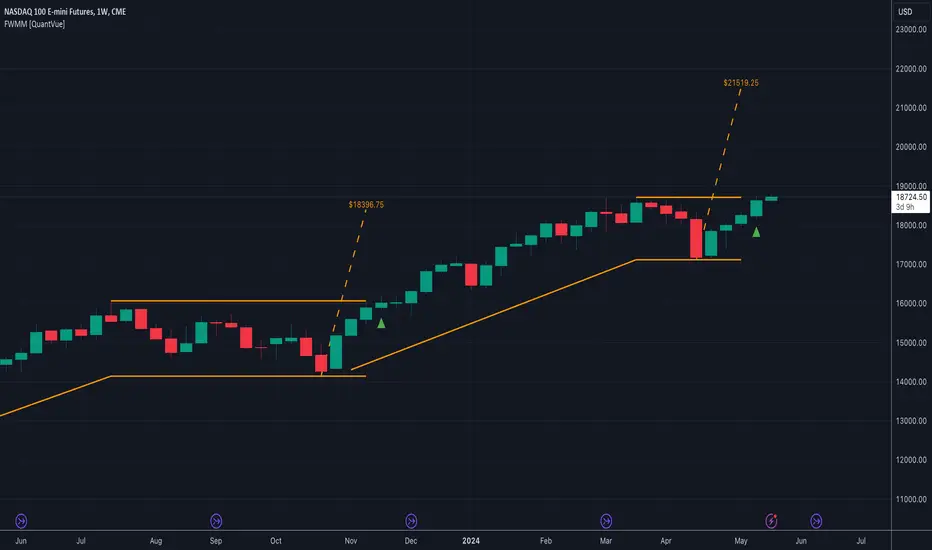
Head and Shoulders PatternHello Traders!
The Head and Shoulders Pattern indicator utilizes a unique swing-based pattern recognition to pinpoint head and shoulders patterns in real-time with unparalleled precision.
The head and shoulders chart pattern is a technical analysis pattern used to identify potential trend reversals in financial markets. It consists of three swing highs (peaks), with the middle peak being the highest and the two outside swing highs being slightly lower. The middle peak is referred to as the "head" and the two outside peaks are referred to as the "shoulders."
The pattern typically forms after an uptrend and is in most cases a bearish signal. The neckline is a support level that connects the lows of the two shoulders. Once the price breaks below the neckline, the pattern is confirmed, and a new down trend starts. Conversely, an "inverse head and shoulders" pattern forms after a downtrend and is a bullish signal.
Feature List
Real-time pattern detection
Visualization of entry, stop-loss and take-profit levels
Pattern performance statistics
Calculation of risk-rewards ratio
Risk Management
Breakout alerts
Customizable pattern size and accuracy
Customizable look and feel
The value of this indicator is to support traders to easily identify the Head and Shoulders pattern in an automated way. The special swing-based pattern recognition and the numerous built-in premium features make this indicator unique. The trader saves a lot of time scanning the markets for head and shoulders patterns, since everything is done automatically for the trader: Finding the pattern, looking and alerting for a breakout, computing the entry, stop loss and take profit levels as well as handling the risk management and computing the optimal order quantity.
How to Trade with the TRN Head and Shoulders Indicator
Identify the Pattern
Add the Head and Shoulders Pattern Indicator to your chart and look for the pattern on the asset and timeframe of your choice. The pattern is detected in real-time. If the pattern develops further in the next bars, then the indicator updates the pattern accordingly until a breakout is confirmed or the pattern becomes invalid.
You can also use the built-in alerts to easily get notified when a pattern occurs. In the indicator settings in the "Alerts" section you can choose whether you want to get notified when a pattern is
1. in the making (Pattern active),
2. confirms an up breakout (B/O Up Confirmed)
3. confirms a down breakout (B/O Down Confirmed)
4. (Unconfirmed) in case a pattern breakout occurs, even if the pattern is not yet confirmed
This allows you to stay informed about potential breakout opportunities that are still awaiting confirmation.
Check Pattern Statistics
The pattern statistics make it easy for you to see how successful a pattern is on the asset and timeframe you are watching. You should always check the statistics before entering a trade. The chart displays the statistics in the upper right corner. These statistics are categorized into two sections: "long" for inverse head and shoulders patterns and "short" for head and shoulders patterns.
In the initial columns, labeled as "short" and "long", the identified breakouts are further divided based on whether the risk-reward ratio (R) is below a specified value (< x) or equal to/greater than the specified value (>= x). The following columns represent the count of the events:
1. Occ. (Occurrence) categorized according to the values of R from the first column
2. TP1, TP2, TP3 (Take Profit) - targets 1, 2 and 3
3. SL (Stop Loss)
4. T/O (Time Out) - neither stop loss or targets where hit in a certain amount of time
Breakout – Entry, Stop Loss and Targets
The indicator automatically displays the entry price line (EP) in grey at the point where the price breaks through the neckline, indicating a breakout. Once a breakout has been confirmed, place a buy order near the EP level for a long position, or a sell order for a short position. Set your stop-loss at the price level of the red stop-loss line (SL) and set your take-profits at the price level of the green take-profit-lines (TP1, TP2, TP3).
Risk Management
The Head and Shoulders Pattern Indicator comes with a built-in risk management feature. Just go to the settings and scroll down to the section "Risk Management". Here you can enter your Account Size and the percentage you want to Risk when you enter a position after a pattern breakout.
In the "Trade Management" section, you have the option to define the minimum accepted risk-reward ratio for confirmed rectangles. This means that breakouts of patterns failing to meet the minimum risk-reward ratio will not be considered as confirmed signals. If a breakout gets confirmed, the indicator automatically calculates the position size (Quantity). You can read the quantity from the gray entry point line (EP), which is located to the right of the risk-reward ratio (R). Note that your risk-reward ratio (R) is calculated based on TP1.
Customization and Settings
The indicator can scan for smaller and larger patterns at the same time. Adjust the Head and Shoulders Sizes in the indicator settings to align them with your preferences. A larger size results in larger patterns. Depending on the asset class, the market or the market phase, different sizes should be used for the Head and Shoulders pattern detection.
To detect more patterns, increase the tolerance level, even though it may result in lower accuracy. However, be mindful that a higher tolerance level may result in more patterns hitting their stop-loss. Look for a tolerance level that leads to favorable statistics and focus on trading patterns with a proven performance history.
Finally, you have the flexibility to customize various visual elements, such as the color of the pattern and whether to display values like price, target, or risk-reward ratio on your chart. You can also choose where these values appear.
Computation Details
The real-time detection of the Head and Shoulders Pattern Indicator utilizes a unique swing-based pattern recognition. The difference to other swing-based computations is that the pivot points are identified without a look-ahead value. The result is a faster and better real-time detection. Furthermore, the detection of the ratios between the single swings is based on a dynamic volatility measurement similar to the ATR. The tolerance level unites several internal parameters into one and results in a user-friendly setting.
Risk Disclaimer
The content, tools, scripts, articles, and educational resources offered by TRN Trading are intended solely for informational and educational purposes. Remember, past performance does not ensure future outcomes.

Double Tops/Bottoms [UAlgo]🔶Description:
The "Double Tops/Bottoms " indicator is designed to identify potential double tops and double bottoms on price charts. These patterns are often considered significant as they may indicate a reversal in the prevailing trend. The indicator can be applied to both high/low and close price data, offering flexibility in analyzing different aspects of market behavior.
🔶Key Features:
Source Selection: Users can choose between using high/low or close prices as the basis for identifying double tops and bottoms, allowing for tailored analysis based on specific price actions.
Lookback Length: The indicator offers a customizable lookback length, enabling users to adjust the sensitivity of pattern detection according to their trading preferences and timeframes.
Pivot Length: Users can specify the length of the pivot used in identifying double tops and bottoms, providing flexibility in capturing different market dynamics.
Minimum Bar Count Between Tops/Bottoms: A minimum bar count parameter allows users to control the distance between consecutive tops or bottoms, enhancing the accuracy of pattern recognition.
Pivot Tops/Bottoms Only: The indicator offers the option to focus exclusively on pivot tops and bottoms, streamlining the analysis process for users interested specifically in these key reversal points.
Disclaimer:
Trading involves substantial risk and is not suitable for every investor. The indicator provided here is intended for informational purposes only and should not be construed as investment advice or a recommendation to buy, sell, or hold any securities. Users are solely responsible for evaluating their own investment decisions and should seek professional financial advice if needed. The creator of this indicator (UAlgo) does not guarantee the accuracy, completeness, or reliability of the information provided, and shall not be liable for any losses incurred in connection with its use. By using this indicator, users acknowledge and agree to assume all risks associated with trading activities.

Linear Regression Channel 200█ OVERVIEW
This a simplified version of linear regression channel which use length 200 instead of traditional length 100.
█ FEATURES
Color change depends light / dark mode.
█ LIMITATIONS
Limited to source of closing price and max bars back is 1500.
█ SIMILAR
Regression Channel Alternative MTF
Regression Channel Alternative MTF V2