BTC CME Gaps Detector [SwissAlgo]BTC CME Gaps Detector
Track Unfilled Gaps & Identify Price Magnets
------------------------------------------------------
Overview
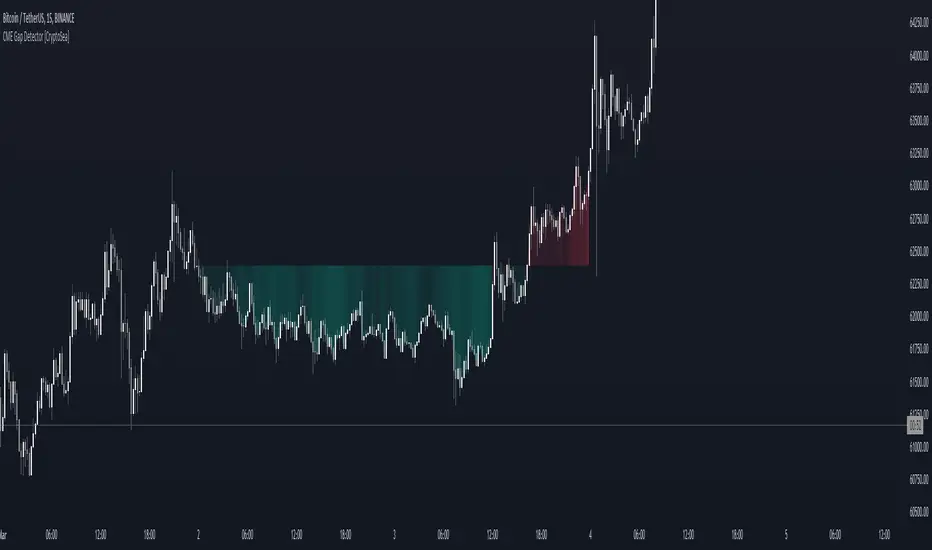
The BTC CME Gap Detector identifies and tracks unfilled price gaps on any timeframe (1-minute recommended for scalping) to gauge potential trading bias.
Verify Gap Behavior Yourself : Use TradingView's Replay Mode on the 1-Minute chart to observe how the price interacts with gaps. Load the BTC1! ticker (Bitcoin CME Futures), enable Replay Mode, and play forward through time (for example: go back 15 days). You may observe patterns such as price frequently returning to fill gaps, nearest gaps acting as near-term targets, and gaps serving as potential support/resistance zones. Some gaps may fill quickly, while others may remain open for longer periods. This hands-on analysis lets you independently assess how gaps may influence price movement in real market conditions and whether you may use this indicator as a complement to your trading analysis.
------------------------------------------------------
Purpose
Price gaps occur when there is a discontinuity between consecutive candles - when the current candle's low is above the previous candle's high (gap up), or when the current candle's high is below the previous candle's low (gap down).
This indicator identifies and tracks these gaps on any timeframe to help traders:
Identify gap zones that may attract price (potential "price magnets")
Monitor gap fill progression
Assess potential directional bias based on nearest unfilled gaps (long, short)
Analyze market structure and liquidity imbalances
------------------------------------------------------
Why Use This Indicator?
Universal Gap Detection : Identifies all gaps on any timeframe (1-minute, hourly, daily, etc.)
Multi-Candle Mitigation Tracking : Detects gap fills that occur across multiple candles
Distance Analysis : Shows percentage distance to nearest bullish and bearish gaps
Visual Representation : Color-coded boxes indicate gap status (active vs. mitigated)
Age Filtering : Option to display only gaps within specified time periods (3/6/12/24 months), as older gaps may lose relevance
ATR-Based Sizing : Minimum gap size adjusts to instrument volatility to filter noise (i.e. small gaps)
------------------------------------------------------
Trading Concept
Gaps represent price zones where no trading occurred. Historical market behavior suggests that unfilled gaps may attract price action as markets tend to revisit areas of incomplete price discovery. This phenomenon creates potential trading opportunities:
Bullish gaps (above current price) may act as upside targets where the price could move to fill the gap
Bearish gaps (below current price) may act as downside targets where price could move to fill the gap
The nearest gap often provides directional bias, as closer gaps may have a higher probability of being filled in the near term
This indicator helps quantify gap proximity and provides a visual reference for these potential target zones.
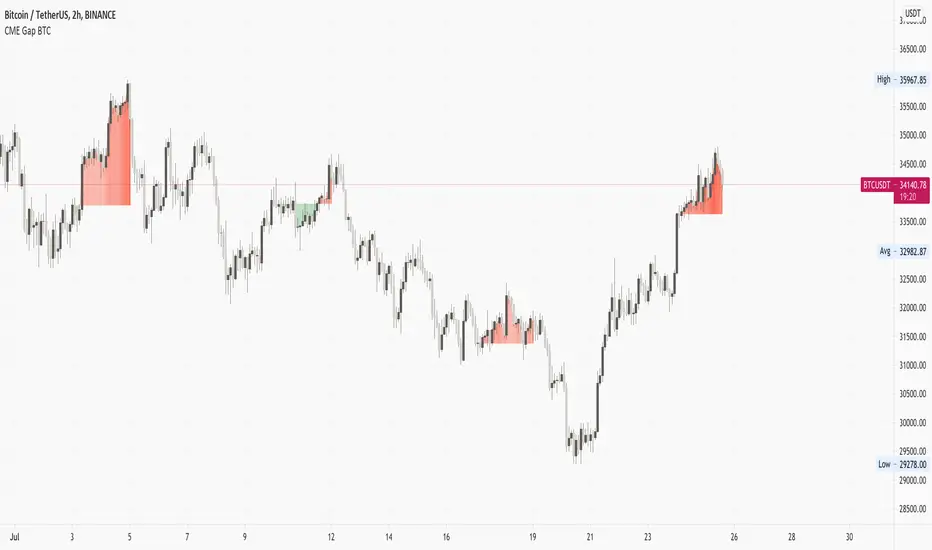
EXAMPLE
Step 1: Bearish Gaps Appear Below Price
Step 2: Price Getting Close to Fill Gap
Step 3: Gap Mitigated Gap
------------------------------------------------------
Recommended Setup
Timeframe: 1-minute chart recommended for maximum gap detection frequency. Works on all timeframes (higher timeframes will show fewer, larger gaps).
Symbol: Any tradable instrument. Originally designed for BTC1! (CME Bitcoin Futures) but compatible with all symbols.
Settings:
ATR Length: 14 (default)
Min Gap Size: 0.5x ATR (adjust based on timeframe and noise level)
Gap Age Limit: 3 months (configurable)
Max Historical Gaps: 300 (adjustable 1-500)
------------------------------------------------------
How It Works
Gap Detection : Identifies price discontinuities on every candle where:
Gap up: current candle low > previous candle high
Gap down: current candle high < previous candle low
Minimum gap size filter (ATR-based) eliminates insignificant gaps
Mitigation Tracking : Monitors when price touches both gap boundaries. A gap is marked as filled when the price has touched both the top and bottom of the gap zone, even if this occurs across multiple candles.
Visual Elements :
Green boxes: Unfilled gaps above current price (potential bullish targets)
Red boxes: Unfilled gaps below current price (potential bearish targets)
Gray boxes: Filled gaps (historical reference)
Labels: Display gap type, price level, and distance percentage
Analysis Table: Shows :
Distance % to nearest bullish gap (above price)
Distance % to nearest bearish gap (below price)
Trade bias (LONG if nearest gap is above, SHORT if nearest gap is below)
------------------------------------------------------
Key Features
Detects gaps on any timeframe (1m, 5m, 1h, 1D, etc.)
Boxes extend 500 bars forward for active gaps, stop at the fill bar for mitigated gaps
Real-time distance calculations update on every candle
Configurable age filter removes outdated gaps
ATR multiplier ensures gap detection adapts to market volatility and timeframe
------------------------------------------------------
Disclaimer
This indicator is provided for informational and educational purposes only.
It does not constitute financial advice, investment recommendations, or trading signals. The concept that gaps attract price is based on historical observation and does not guarantee future results.
Gap fills are not certain - gaps may remain unfilled indefinitely, or the price may reverse before reaching a gap. This indicator should not be used as the sole basis for trading decisions.
All trading involves substantial risk, including the potential loss of principal. Users should conduct their own research, apply proper risk management, test strategies thoroughly, and consult with qualified financial professionals before making trading decisions.
The authors and publishers are not responsible for any losses incurred through the use of this indicator.
CME

Weekend GapsIdentify unfilled gaps between the close of one candle and the opening of the next. Optimised for weekends by highlighting friday gaps with a triangle and bold horizontal ray. Depending on the price action required to fill it, they are marked in red or green.

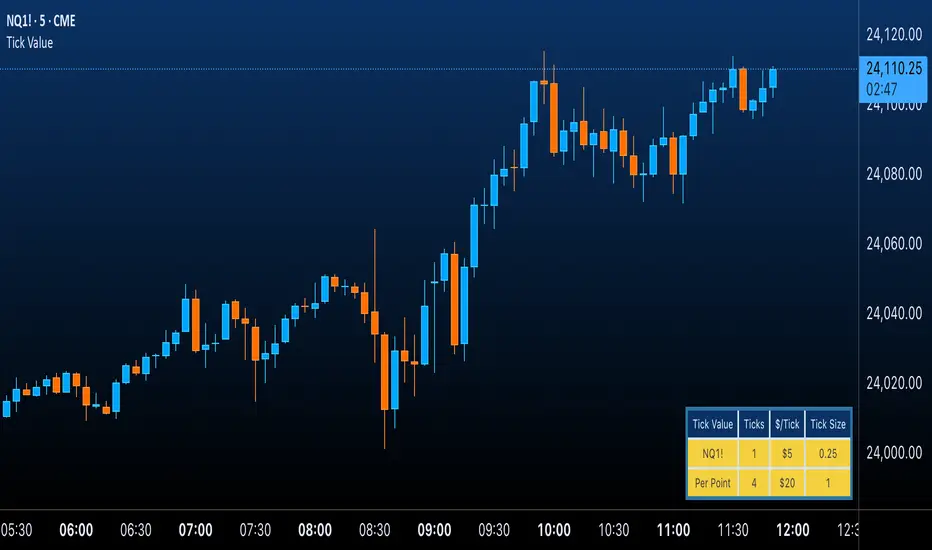
Futures Tick & Point Value [BoredYeti]Futures Tick & Point Value
This utility displays tick size, dollars per tick, and (optionally) a per-point row for the current futures contract.
Features
• Hardcoded $/tick map for common CME/NYMEX/CBOT/COMEX contracts
• Automatic fallback using pointvalue * mintick for any other symbol
• Table settings: adjustable position, text size, customizable colors
• Optional “Per Point” row showing ticks and $/point
Notes
• Contract specs can vary by broker/exchange and may change over time. Always confirm with official specifications.
• Educational tool only; not financial advice.
BTC CME Futures Gaps (BTCGapHunt_CME)BTC CME Futures Gaps Indicator
Overview
This indicator visualises price gaps between the daily close and open of Bitcoin CME futures (CME:BTC1!). These gaps are often revisited ("filled") by market price action and may serve as technical targets.
Thanks
... to Maven and the Blockchain Masons (x.com/Masons_DAO) to push me on this topic.
What Is a CME Gap?
CME Bitcoin Futures do not trade 24/7. Gaps form when the market reopens at a different price than where it last closed.
Gaps are often used as support/resistance or liquidity targets.
This indicator tracks, visualises, and alerts on these gaps.
Key Features
Automatic gap detection using daily open/close on CME:BTC1!
Dynamic gap size threshold based on ATR (Average True Range)
Highlight unfilled gaps and track partial fills visually
Alerts for gap formation and fill events
Parameter overlay showing real-time settings
Supported and Overrideable Parameters
ATR Length: Defines the lookback period for ATR calculation (default: 14)
Gap Size Multiplier: Multiplies the ATR to set the dynamic gap threshold (default: 1.0)
Proximity Threshold: Price distance from gap edge to consider it filled (default: 100 USD)
Max Gaps Tracked: Maximum number of concurrent gaps shown (default: 50)
Alerts Enabled: Toggle alerts for gap formation and gap fill events
How the Gap Size Is Calculated
Minimum Gap Size = ATR(14) * Gap Size Multiplier
ATR Length and Gap Size Multiplier are configurable.
Gap threshold adjusts dynamically with market volatility.
Visual Guide
Red Box: Fully unfilled gap
Lemon Yellow Box: Partially filled gap
Right Margin Boxes: Snapshot of unfilled gaps for quick access
Top-Right Panel: Current ATR, Gap Size, Thresholds, etc.
Alerts
Gap Formed: A new gap is detected.
Gap Filled: The gap is either partially or fully filled.
Recommended Timeframes
1H, 4H, 1D (best resolution)
Designed for BTC spot/perpetual charts (e.g., BTCUSD, BTCUSDT)
How To Use
Add the script to your BTC chart.
Monitor red/yellow boxes for unfilled gaps.
Check config panel for current threshold and settings.
Enable alerts via TradingView for real-time updates.
Notes
Up to 50 gaps are tracked (adjustable).
Data source: CME futures via request.security.
All visuals and alerts are time-synced with your chart.
Disclaimer
This script is for educational purposes only. Trade at your own risk.

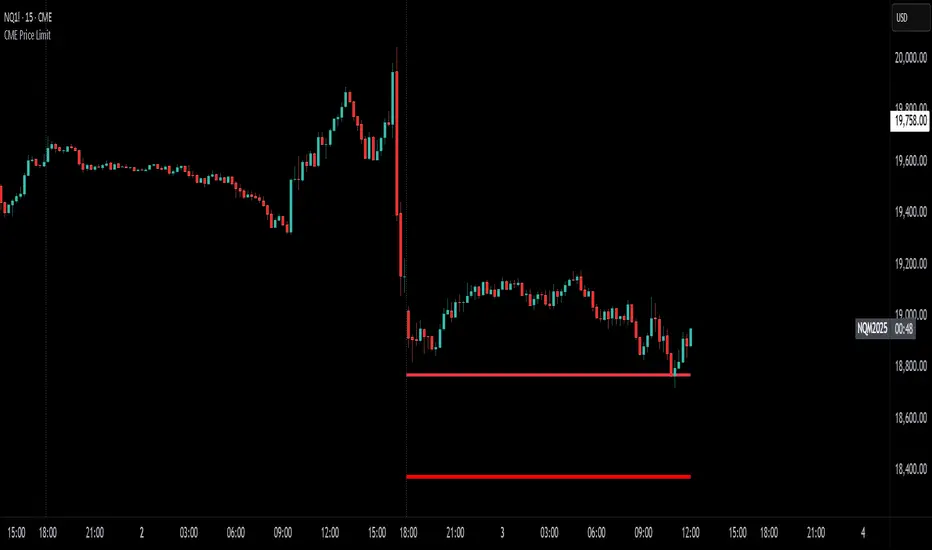
CME Price LimitCalculates the CME Price Limit
The reference price is obtained from the previous day's closing settlement price
(data pulled from the asset's daily chart with settlement enabled)
Percentage limit can be modified in settings
Buffer can be enabled (for example, 2% buffer on a 7% limit, so a line gets drawn at 5% too)
Alert can be enabled for price crossing a certain percentage from reference on the day
You can choose to plot the historical lines on every day, or the current day only
The reference price output can be found in the data window, or in the indicator status line if enabled in the settings.
Before placing real trades with this, you should compare the indicator's reference price to what's shown on CME's website, to double check that TradingView's data matches for your contract.
www.cmegroup.com
Combined Bitcoin CME Gaps and Weekend DaysScript Description: Combined Bitcoin CME Gaps and Weekend Days
Author: NeoButane (Bitcoin CME Gaps), JohnIsTrading (Day of Week),
Contributor : MikeTheRuleTA (Combined and optimizations)
This Pine Script indicator provides a combined view of Bitcoin CME gaps and customizable weekend day backgrounds on your chart. It’s designed to help traders visualize CME gaps along with customizable weekend day highlights.
Features:
CME Gaps Visualization:
Enable CME Gaps: Toggle the display of CME gaps on your chart.
Show Real vs. CME Price: Choose whether to display chart prices or CME prices for gap analysis.
Weekend Gaps Only: Filter to show only weekend gaps for a cleaner view (note: this may miss holidays).
CME Gaps Styling:
Weekend Background Highlighting:
Enable Weekend Background: Toggle the weekend day background highlight on or off.
Timezone Selection: Choose the relevant timezone for accurate weekend highlighting.
Customizable Weekend Colors: Define colors for Saturday and Sunday backgrounds.
How It Works:
CME Gaps: The script identifies gaps between CME and chart prices when the CME session is closed. It plots these gaps with customizable colors and line widths.
You can choose to see gaps based on CME prices or chart prices and decide whether to include only weekends.
Weekend Backgrounds: The script allows for background highlighting of weekends (Saturday and Sunday) on your chart. This can be enabled or disabled and customized with specific colors.
The timezone setting ensures that the background highlights match your local time settings.
Inputs:
CME Gaps Settings:
Enable CME Gaps
Show Real vs. CME Price
Only Show Weekend Gaps
CME Gaps Style:
Gap Fill Color Up
Gap Fill Color Down
Gap Fill Transparency
Weekend Settings:
Enable Weekend Background
Timezone
Enable Saturday
Saturday Color
Enable Sunday
Sunday Color
Usage:
Add this script to your TradingView chart to overlay CME gaps and weekend highlights.
Adjust the settings according to your preferences for a clearer view of gaps and customized weekend backgrounds.
This indicator provides a comprehensive tool for tracking CME gaps and understanding weekend market behaviors through visual enhancements on your trading charts.
Futures Settlement [NeoButane]Traders use settlement prices as both support/resistance and as a target for price to trend towards. The intention of this script is to provide possible entry and exit levels for swing and scalp trades by drawing horizontal lines of true settlement prices provided by TradingView.
The settlement price, which is calculated daily, is used to determine the profit/loss of a trader's futures position. Prior to the daily close, price settlement of futures contracts is performed by taking the average of its traded price during a specified period of time.
Usage
The settlement prices, shown as horizontal lines, serve as support or resistance for entry or exit. There are hundreds of ways to combine this with favorite indicators, or it can be used as levels for pure price action traders.
See how settlement price levels can be used in confluence with oscillators.
Configuration
Toggles to show each settlement. Reprint shows prior weeks or months after they've ended. Back-adjusted futures, which affect expired futures price history on continuous futures charts, should only be enabled on non-standard charts to match the user's chart settings.
What this script does
This script plots the daily, weekly, and monthly settlements for futures, including an average for the two most recent weekly or monthly settlements. The weekly settlement uses the last day of the week's daily settlement and the monthly settlement uses the last day of the month's daily settlement. For symbols that do not have settlement prices, which will be almost if not all symbols that are not futures, the settlement price instead becomes price at the last second before the daily/weekly/monthly close. In those cases, this script becomes a tool for automatically plotting daily/weekly/monthly closes.
See below for two different bitcoin charts. The chart on top is a non-futures chart and a futures chart is at the bottom. Note that CME bitcoin futures settle 4 hours (1500 CST) before bitcoin's daily close (UTC).
How this script works
TradingView has a built-in ability to display daily settlements instead of the actual daily close. This can be enabled in chart settings for futures on the daily timeframe and there is an argument for Pine Script to do so as well. Because settlement times are different for multiple products during the day, the script uses the settlement price from daily timeframe, which is guaranteed to be correct because TradingView is wonderful. I accidentally found the undocumented backadjustment and settlement_at_close when I was trying to use ticker.inherit() to create a symbol with its daily close time changed to another symbol's, which I still haven't figured out. TradingView has since added documentation for both of them, but there's still an ambiguous 'etc.' in the description of ticker.inherit() so maybe there's more secret arguments...
The script is able to be used on non-standard charts by using ticker.standard(), but back-adjustment will need to be changed by input to match chart settings.
References
Investopedia explanation of settlement price.
www.investopedia.com
Settlement prices for ES.
www.cmegroup.com
CME summary of settlement price.
www.cmegroup.com
How to enable settlement price as close for daily intervals in TradingView. This does not affect the use of this script.
www.tradingview.com
About back-adjustment for continuous futures charts in TradingView.
www.tradingview.com

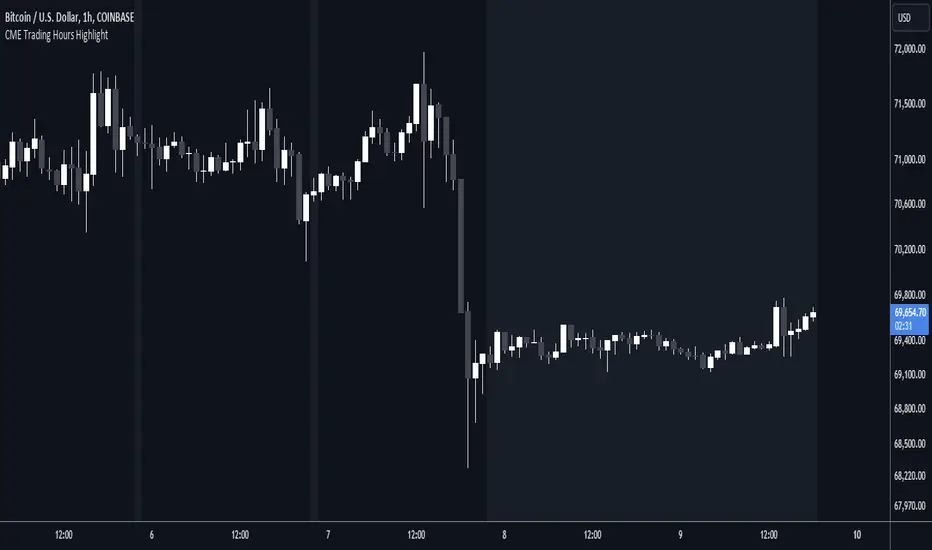
CME Trading Hours HighlightDisplay the times when the CME is or isn't trading, on a non-CME symbol.
The Chicago Mercantile Exchange hours are usually from 17:00 one day to 16:00 the next, with an hour's break. Trading halts from Friday evening to Sunday evening. The exchange is in Chicago.
You might want to display these hours if you trade the same asset on a different exchange. For example, you might want to overlay the CME BTC1! hours on a Coinbase BTC chart to see how trading in these futures contracts affects the market.
Inputs:
Shade Outside Trading Hours - If selected (the default), then the chart background is shaded when the CME is closed. If unselected, the background is shaded when it's open.
Highlight Color - The colour to use for the background shade.
Just for fun, I wanted to publish a useful script that only took up one line 😁
CME Gap Oscillator [CryptoSea]Introducing the CME Gap Oscillator , a pioneering tool designed to illuminate the significance of market gaps through the lens of the Chicago Mercantile Exchange (CME). By leveraging gap sizes in relation to the Average True Range (ATR), this indicator offers a unique perspective on market dynamics, particularly around the critical weekly close periods.
Key Features
Gap Measurement : At its core, the CME Oscillator quantifies the size of weekend gaps in the context of the market's volatility, using the ATR to standardize this measurement.
Dynamic Levels : Incorporating a dynamic extreme level calculation, the tool adapts to current market conditions, providing real-time insights into significant gap sizes and their implications.
Band Analysis : Through the introduction of upper and lower bands, based on standard deviations, traders can visually assess the oscillator's position relative to typical market ranges.
Enhanced Insights : A built-in table tracks the frequency of the oscillator's breaches beyond these bands within the latest CME week, offering a snapshot of recent market extremities.
Settings & Customisation
ATR-Based Measurement : Choose to measure gap sizes directly or in terms of ATR for a volatility-adjusted view.
Band Period Adjustability : Tailor the oscillator's sensitivity by modifying the band calculation period.
Dynamic Level Multipliers : Adjust the multiplier for dynamic levels to suit your analysis needs.
Visual Preferences : Customise the oscillator, bands, and table visuals, including color schemes and line styles.
In the example below, it demonstrates that the CME will want to return to the 0 value, this would be considered a reset or gap fill.
Application & Strategy
Deploy the CME Oscillator to enhance your market analysis
Market Sentiment : Gauge weekend market sentiment shifts through gap analysis, refining your strategy for the week ahead.
Volatility Insights : Use the oscillator's ATR-based measurements to understand the volatility context of gaps, aiding in risk management.
Trend Identification : Identify potential trend continuations or reversals based on the frequency and magnitude of gaps exceeding dynamic levels.
The CME Oscillator stands out as a strategic tool for traders focusing on gap analysis and volatility assessment. By offering a detailed breakdown of market gaps in relation to volatility, it empowers users with actionable insights, enabling more informed trading decisions across a range of markets and timeframes.

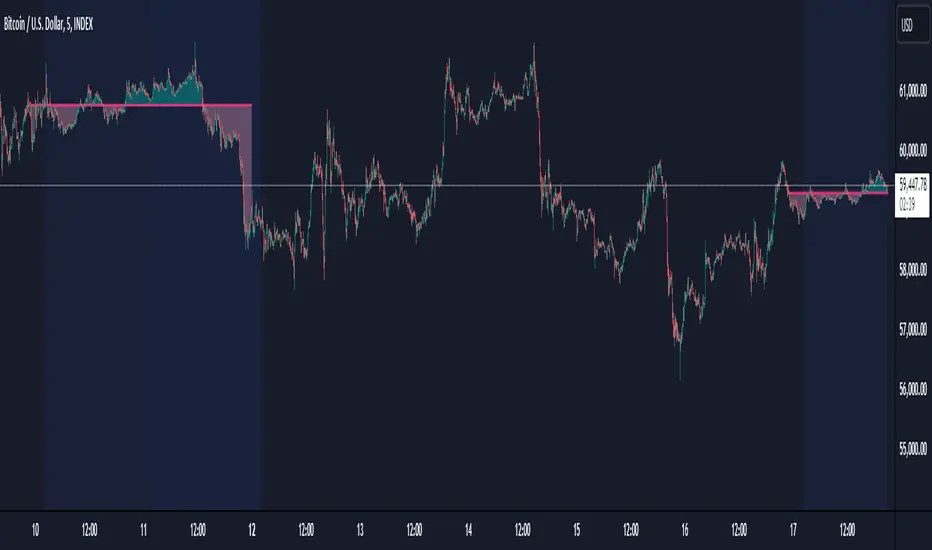
CME Gap Detector [CryptoSea]The CME Gap Indicator , is a tool designed to identify and visualize potential price gaps in the cryptocurrency market, particularly focusing on gaps that occur during the weekend trading sessions. By highlighting these gaps, traders can gain insights into potential market movements and anticipate price behavior.
Key Features
Gap Identification: The indicator identifies gaps in price between the Friday close and the subsequent opening price on Monday. It plots these gaps on the chart, allowing traders to easily visualize and analyze their significance.
Weekend Price Comparison: It compares the closing price on Friday with the opening price on Monday to determine whether a gap exists and its magnitude.
Customizable Visualization: Traders have the option to customize the visualization of the gaps, including the color scheme for better clarity and visibility on the chart.
Neutral Candle Color Option: Users can choose to display neutral candle colors, enhancing the readability of the chart and reducing visual clutter.
How it Works
Data Fetching and Calculation: The indicator fetches the daily close price and calculates whether a gap exists between the Friday close and the subsequent Monday opening price.
Plotting: It plots the current price and the previous Friday's close on the chart, making it easy for traders to compare and analyze.
Gradient Fill: The indicator incorporates a gradient fill feature to visually represent the magnitude of the gap, providing additional insights into market sentiment.
Weekend Line Logic: It includes logic to identify Sunday bars and mark them on the chart, aiding traders in distinguishing weekend trading sessions.
Application
Gap Trading Strategy: Traders can use the identified gaps as potential entry or exit points in their trading strategies, considering the tendency of price to fill gaps over time.
Market Sentiment Analysis: Analyzing the presence and size of weekend gaps can provide valuable insights into market sentiment and participant behavior.
Risk Management: Understanding the existence and significance of gaps can help traders manage their risk exposure and make informed decisions.
The CME Gap indicator offers traders a valuable tool for analyzing weekend price gaps in the cryptocurrency market, empowering them to make informed trading decisions and capitalize on market opportunities.
ILM CFTC COT Disaggregated PlotUse this indicator on Daily Timeframe
Please refer to the below link for CFTC Disaggregated COT
www.cftc.gov
This script is very similar to COT Financial Plot indicator except that it plots the data for Disaggregated Futures

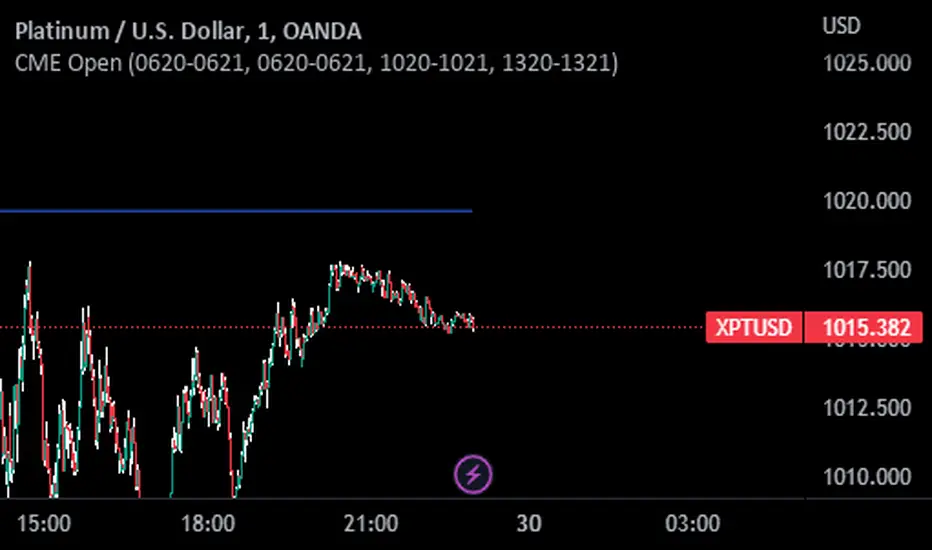
CME OpenThis indicator prints CME open line price on chart.
Please choose the right time to input depending on the broker you are using in Tradingview.
List of brokers:
OANDA 0620-0621
FOREX.COM 0620-0621
SAXO 0620-0621
GLOBALPRIME 0620-0621 (Working only on 1 minute chart)
VANTAGE 0620-0621
EASYMARKETS 0620-0621
PHILLIPNOVA 0620-0621
FXCM (FX) 0620-0621
CURRENCYCOM 0620-0621
CAPITALCOM 0620-0621
FXOPEN 1220-1221
PEPPERSTONE 1020-1021
SKILLING 1020-1021
EIGHTCAP 1320-1321
BLACKBULL 1320-1321
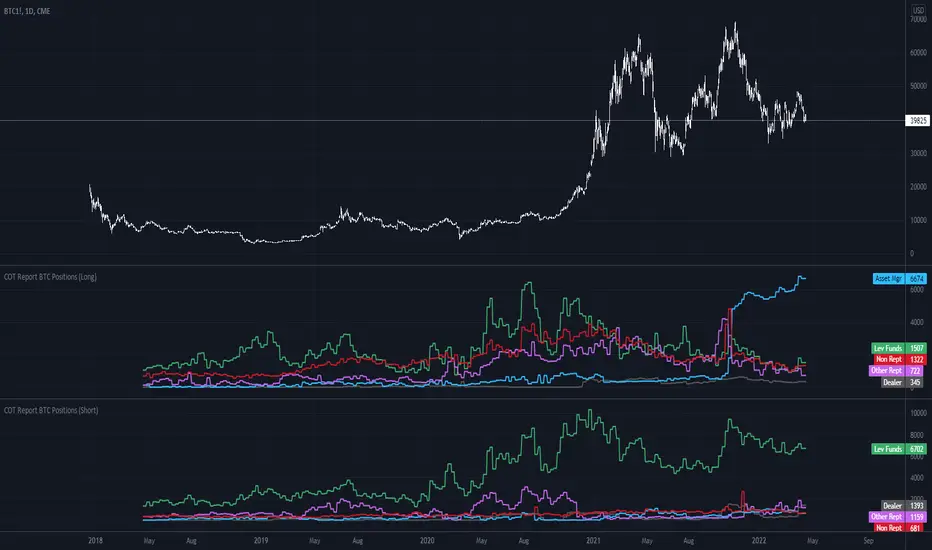
COT Report BTC Positions█ OVERVIEW
Showing the Commitments of Traders (COT) report(*) for BITCOIN Positions - CHICAGO MERCANTILE EXCHANGE (futures only) with COT charts on TradingView data.
* COT reports are released each Friday (except for U.S. holidays) by the CFTC.
* Each COT report release includes data from the previous Tuesday.
* Original data is www.cftc.gov
Data currently displayed are through April 12, 2022
█ FEATURES
You can switch the display for each of the following Positions :
Long
Short
You can switch the display for each of the following Categories :
Dealer
Asset manager
Leverage funds
Other reportable
Non reportable
█ HOW TO USE IT
This indicator allows you to see changes for each category within TradingView without having to refer directly to each report.
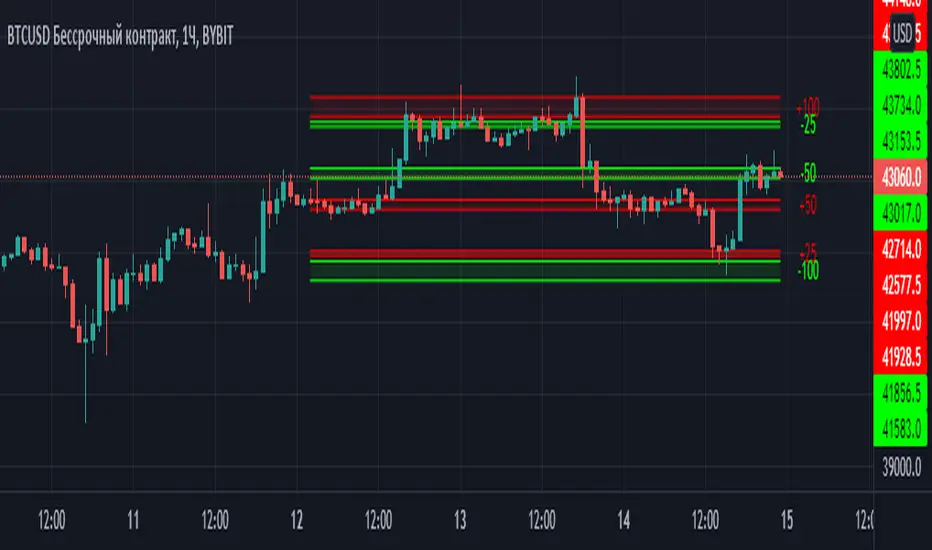
Margin Zones[kryptodude]This indicator is based on the margin requirements of the CME exchange.
Zones act as support and resistance levels, which are more likely to have a price reaction.
The recommended zones for entering a position, as well as taking profits, are zones 50 and 100.
For example, you decide to open a short position on the +100 zone,
in which case it is recommended to place a stop-loss behind the zone.
Take-profit part at -50 and -100, based on the zones from the formed maximum at the +100 zone.
Settings:
Select the currency pair and the exchange on which the indicator will work, For example BINANCE:BTCUSD
"Margin" (for example,now 68280, the next day the margin will be different)
"Tick cost" for BTC = 25 or 12.5
taken from the CME exchange.
"Price max"- High yesterday (for example 44451).
"Price min"- Low yesterday (for example 41280).
Please note, with strong volatility,
it is recommended to change the Tick cost instead of 25 to put 12.5
And also, only dots " . " not commas ", " work in the indicator.
CME Gap BTCThis script highlights the CME gap. It takes the daily close from Friday from CME Futures Bitcoin security (can be switched) and plots the difference from current close.
With the premise that CME gaps will be filled next week; when the current close is higher than Friday close, it plots a bear color, when the current close is lower, it plots a bull color. Colors can be changed
BTC COT Delta BBitcoin CME COT Delta Strategy
---------------------------------------
Reading 4 largest long positions and 4 largest short positions, this script uses (shorts - longs) to produce a long/short signal.
• When delta <= buy threshold, a "long" signal will appear on the chart.
• When shorts >= sell threshold, a "short" signal will appear on the chart.
To see the indicator below, since it's not possible to mix the two, use this script:
** This is not a trading advice, it's for research purposes only. Do not trade based upon these signals.

Ether (Ethereum) CME Gaps [NeoButane]Detects gaps in trading for CME's "Ether" cash-settled futures. This will show gaps as they happen on the 24/7 charts that crypto exchanges use. It is not usable on CME's tickers themselves, as gaps in trading are not displayed.
This indicator will only display if viewing an ETH chart.
More information on the CME ETH futures here:
www.cmegroup.com
Based on:
What's different: CME's BTC and ETH markets trade the same hours, but one may hit a limit breaker while there may be a case where the other does not.

BITCOIN CME FUTURES GAPSDisplays information about Bitcoin CME Futures Gaps over BTCUSD (or XBTUSD) charts.
You can configure a threshold percentage to only display gaps whose size is greater than that percentage. The gap precentage is calculated based on the current close price.
Gaps up are displayed in Orange, gaps down in Green

KZ SessionsThis shows killzone sessions for London NY, Asia sessions.
In addition to the opening hours of session, the pre-market and closing time periods are also marked with a grey color
Generally these are consided period of high activity and can experience more volatility in these periods
I also have enabled it to display the session times even on weekends. There is no session open at such times but heightened activity is noticed in these periods even on weekends.
If want to disable showing it on weekends, then remove ":1234567" from all the lines in code

CME Equity Futures Price Limits
Breakers for CME's futures contracts. Should work on CST/EST/UTC charts.
CME says it uses the last 30 seconds of the session to grab a reference price, so I took the open of the last session's candle because it's easier.
Out of session breakers: +/-5%
Limit downs: -7%/-13%/-20%
There are some minor nuances for the later part of the NY session but I don't really care to add that in right now.
Options:
- Input a manual reference price to override the selected price for accuracy.
- Show only the current/last session's limits. This breaks the in session limit down lines.
Live prices:
www.cmegroup.com
Month codes:
www.cmegroup.com
Reference:
www.cmegroup.com
It's best to check the last updated reference price to ensure it's correct.

Bitcoin CME Gaps [NeoButane]Simple script that checks for gaps in price from CME. tickerid(x, y, sess) doesn't seem to be applying correctly for the ticker specified at the moment so there are a couple of 'gaps' peppered on lower timeframes.
Gaps are legitimate price levels to look as a support or resistance. The theory is that volume needs to be gap filled, but I currently believe it's an easy entry/exit trade for those who can move the market. I don't think there is sound analysis behind the why, but it is real.

It's Sunday and 2300UTCCME bitcoin trading opens at 5p.m. CT (UTC-6) on Sunday. This translates to 2300 UTC.
www.cmegroup.com
Orange: CME open hour candle's range is smaller than the previous hourly candle
Fuchsia: CME open hour candle's range is larger than the previous hourly candle
If there is a blue highlight after CME open, that means the candle after the open has a larger range. Otherwise there is no highlight.

CME & XBT - BTC Futures Settlement DatesHi everyone
This in an indicator inspired by Scarrff
I added the XBT quarterly and yearly settlement dates
Enjoy
David
