[SignalFI] CogniFI V1CogniFI uses 8 independent Fibonacci based inputs to calculate a unified Center Of Gravity (COG) and RMA or RSI based moving average created by J. Welles Wilder.
FIBONACCI BASED TREND AND MOMENTUM DISCOVERY
RSI BASED MOVING AVERAGES COMBINED WITH CENTER OF GRAVITY (COG)
COLOR BASED TREND SMOOTHING FOR INDICATOR SIGNAL
SignalFI was created to help traders and investors to effectively analyze the market based on the Golden Mean Ratio (Fibonacci numbers), plan a trade and ultimately execute it. To help inform and educate market decisions we developed a set of Trading Indicators which are available on TradingView , the most advanced and yet easy to use charting platform available on the web.
SignalFI indicators are just that, indicators. Our indicators are generally configured to use completely historical data (negating repaint), and we advise all alerts created with SignalFI indicators to be fired upon "close" of the current candle. Our indicators can provide valuable context and visualization support when performing market analysis and executing buy and sell decisions. However. we are not financial experts, and all information presented on this site or our other media outlets are for educational purposes only.
For subscription information, visit www.signalfi.net and follow us on twitter: @signalfi_
COG

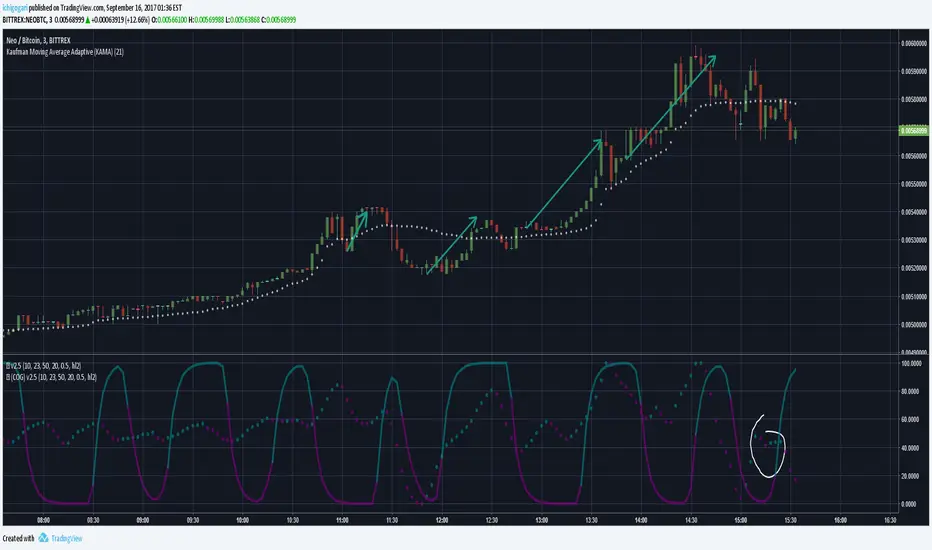
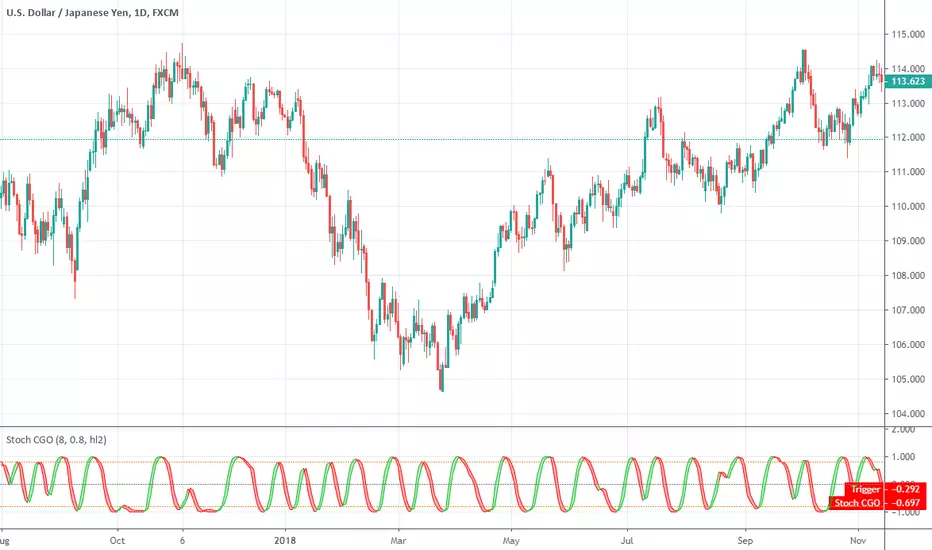
Stochastic CG Oscillator (Center of Gravity)Stochastic CG Oscillator (Center of Gravity) script.
This indicator was originally developed by John F. Ehlers (see his book `Cybernetic Analysis for Stocks and Futures`, Chapter 8: `Stochasticization and Fisherization of Indicators`).
MTF Center of Gravity Grid [checkm8]Hello and welcome to my multi-timeframe center of gravity (COG) grid.
Center of gravity is a zero-lag oscillator created by John Ehlers and to get a better understanding of it, you can read his original works here: www.mesasoftware.com
My oscillator features a grid from four timeframes (selected by the user), to show the whether the center of gravity line is above or below its relative EMA. You can use this indicator as a tool to spot potential changes in the trend as they occur. In addition to this, the oscillator displays the COG line, with its relative EMA, on the current timeframe.
By default:
1) The fill between the COG and the EMA will be navy blue when the COG is dominant, and maroon when the EMA is dominant.
2) The grid will show fuchsia-colored blocks when the COG is above its relative EMA on the selected MTF timeframe, and orange when the COG is below the EMA.
If you have any questions, suggestions, or concerns, feel free to reach out.
Happy trading!

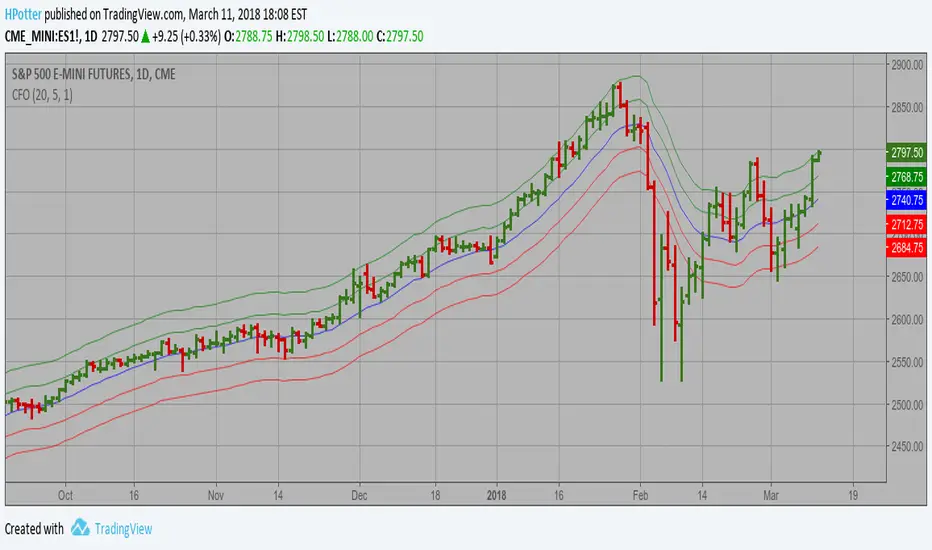
Center Of Gravity Backtest The indicator is based on moving averages. On the basis of these, the
"center" of the price is calculated, and price channels are also constructed,
which act as corridors for the asset quotations.
You can change long to short in the Input Settings
WARNING:
- For purpose educate only
- This script to change bars colors.

Center Of Gravity Strategy The indicator is based on moving averages. On the basis of these, the
"center" of the price is calculated, and price channels are also constructed,
which act as corridors for the asset quotations.
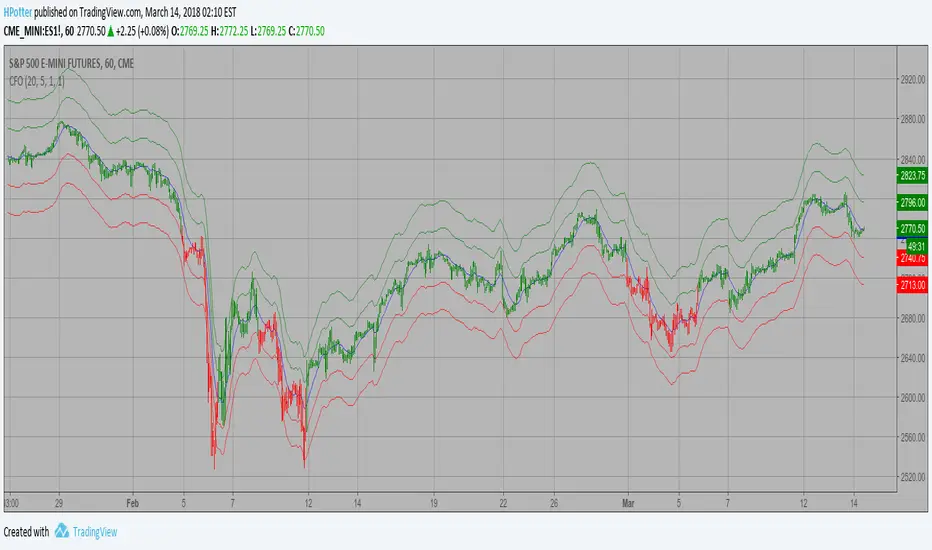
Center Of Gravity The indicator is based on moving averages. On the basis of these, the
"center" of the price is calculated, and price channels are also constructed,
which act as corridors for the asset quotations.
Strawberry Trends 🍓 (COG/Center of Gravity)A restyled Center of Gravity indicator to be used along with the Strawberry Trends (Cycles) script. Helps detect minor changes in trends, especially during pumps/dumps.