Session Bar/Candle ColoringChange the color of candles within a user-defined trading session. Borders and wicks can be changed as well, not just the body color.
PREFACE
This script can be used an educational resource for those who are interested in learning Pine Script. Therefore, the script is published open source and is organized in a manner that follows the recommended Style Guide .
While the main premise of the indicator is rather simple, the script showcases various things that can be achieved such as conditional plotting, alignment of indicator settings, user input validation, script optimization, and more. The script also has examples of taking into consideration the chart timeframe and/or different chart types (Heikin Ashi, Renko, etc.) that a user might be running it on. Note: for complete beginners, I strongly suggest going through the Pine Script User Manual (possibly more than once).
FEATURES
Besides being able to select a specific time window, the indicator also provides additional color settings for changing the background color or changing the colors of neutral/indecisive candles, as shown in the image below.
This allows for a higher level of customization beyond the TradingView chart settings or other similar scripts that are currently available.
HOW TO USE
First, define the intraday trading session that will contain the candles to modify. The session can be limited to specific days of the week.
Next, select the parts of the candles that should be modified: Body, Borders, Wick, and/or Background.
For each of the candle parts that were enabled, you can select the colors that will be used depending on whether a candle is bullish (⇧), bearish (⇩), or neutral (⇆).
All other indicator settings will have a detailed tooltip to describe its usage and/or effect.
LIMITATIONS
The indicator is not intended to function on Daily or higher timeframes due to the intraday nature of session time windows.
The indicator cannot always automatically detect the chart type being used, therefore the user is requested to manually input the chart type via the " Chart Style " setting.
Depending on the available historical data and the selected choice for the " Portion of bar in session " setting, the indicator may not be able to update very old candles on the chart.
EXAMPLE USAGE
This section will show examples of different scenarios that the indicator can be used for.
Emphasizing a main trading session.
Defining a "Pre/post market hours background" like is available for some symbols (e.g., NASDAQ:AAPL ).
Highlighting in which bar the midnight candle occurs.
Hiding indecision bars (neutral candles).
Showing only "Regular Trading Hours" for a chart that does not have the option to toggle ETH/RTH. To achieve this, the actual chart data is hidden, and only the indicator is visible; alternatively, a 2nd instance of the indicator could change colors to match the chart background.
Using a combination of Bars and Japanese Candlesticks. Alternatively, this could be done by hiding the main chart data and using 2 instances of the indicator (one with " Chart Style " setting as Bars , and the other set to Candles ).
Using a combination of thin and thick bars on Range charts. Note: requires disabling the "Thin Bars" setting for Bar charts in the TradingView chart settings.
NOTES
If using more than one instance of this indicator on the same chart, you can use the TradingView "Save Indicator Template" feature to avoid having to re-configure the multiple indicators at a later time.
This indicator is intended to work "out-of-the-box" thanks to the behind_chart option introduced to Pine Script in October 2024. But you can always manually bring the indicator to the front just in case the color changes are not being seen (using the "More" option in the indicator status line: More > Visual Order > Bring to front ).
Many thanks to fikira for their help and inspiring me to create open source scripts.
Any feedback including bug reports or suggestions for improving the indicator (or source code itself) are always welcome in the comments section.
Colorscheme

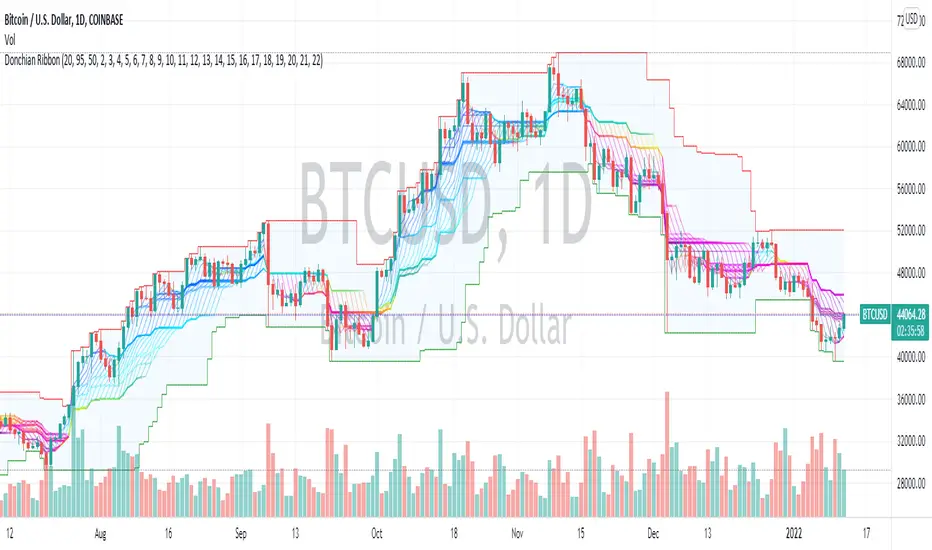
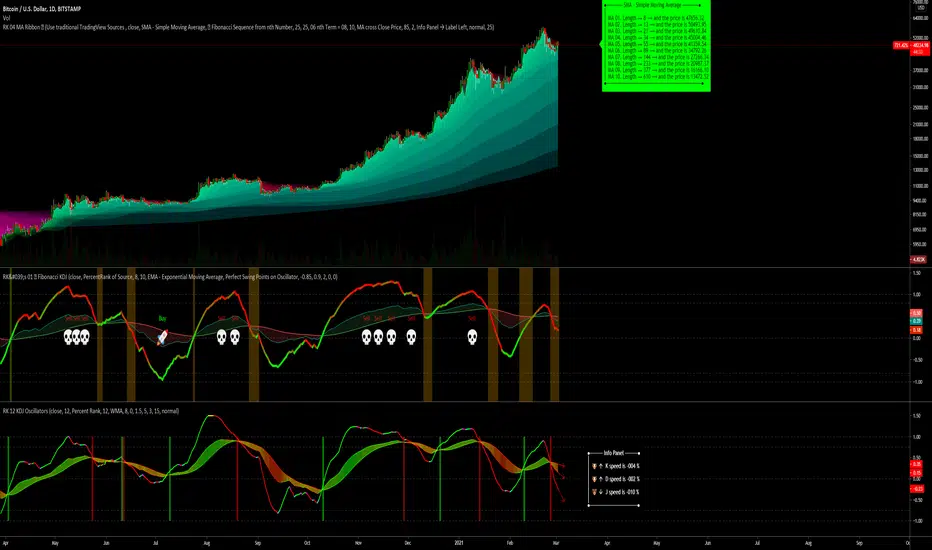
Donchian Range, RSI, and Levels SystemThe Donchian average is defined as average(highest, lowest) for a given period length. By plotting many different lengths, clustering of the lines seems to form natural support/resistance levels. A Donchian Channel and RSI rainbow colors are also provided to define the range and trend.
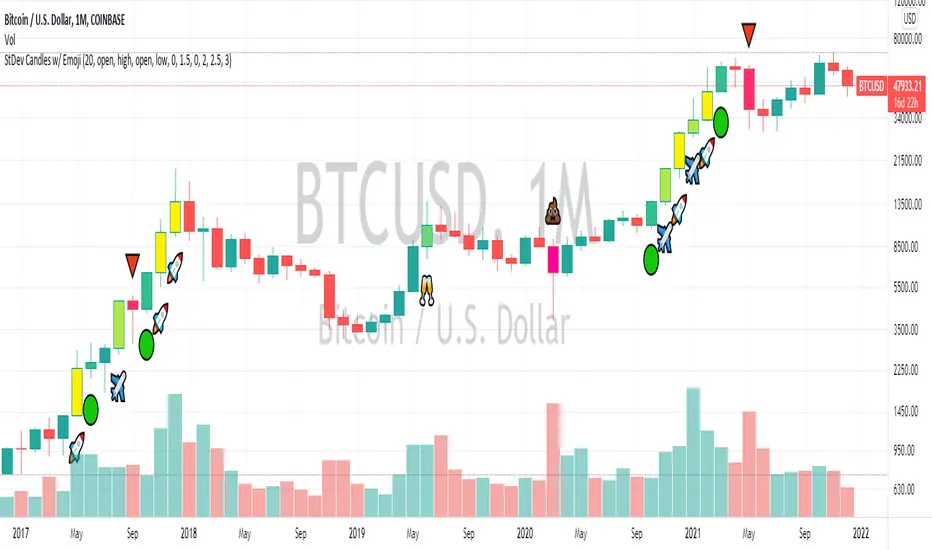
Standard Deviation Candles (With Emoji)In crypto, significant price moves can be a sign of continuation or reversal. This script measures if price move is greater than a certain number of standard deviations vs. previous periods, then alters bar colours and/or prints an emoji signal.
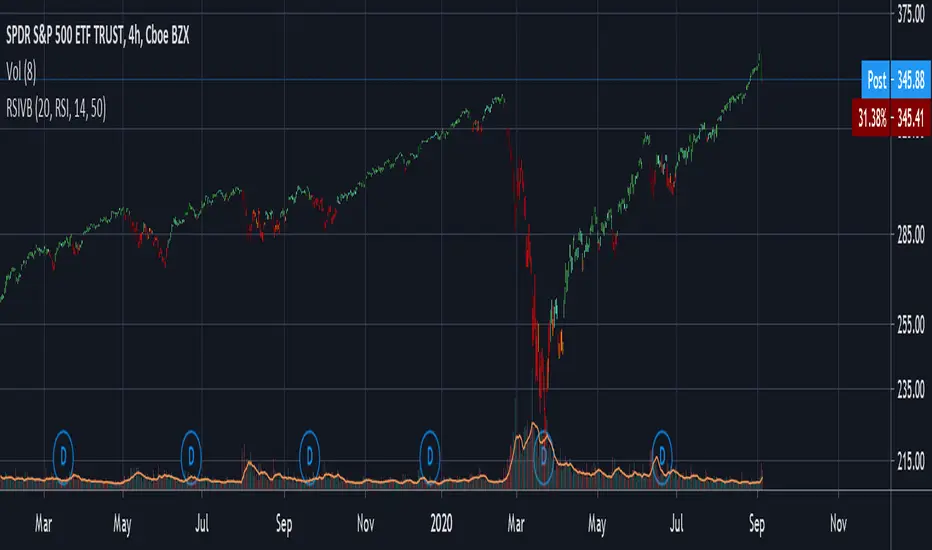
RSI CrayonsThis simple script colors candles based on the Relative Strength Index. RSI Values > 50 are solid colors, RSI values < 50 are pastels, with additional colors/fills/alerts for overheated and oversold (both user adjustable thresholds) conditions.
As an added bonus, RSI can be calculated by non-traditional methods (not using the running/smoothed moving average) using a variety of different moving averages, but you may have to adjust the time-frame for 'faster' moving averages. An option for plotting the moving average basis is also available.
Value Added:
This indicator can be used to chart RSI without adding an "oscillator frame" to your chart, since we don't normally care too much about RSI values between 30 and 70 under normal conditions.

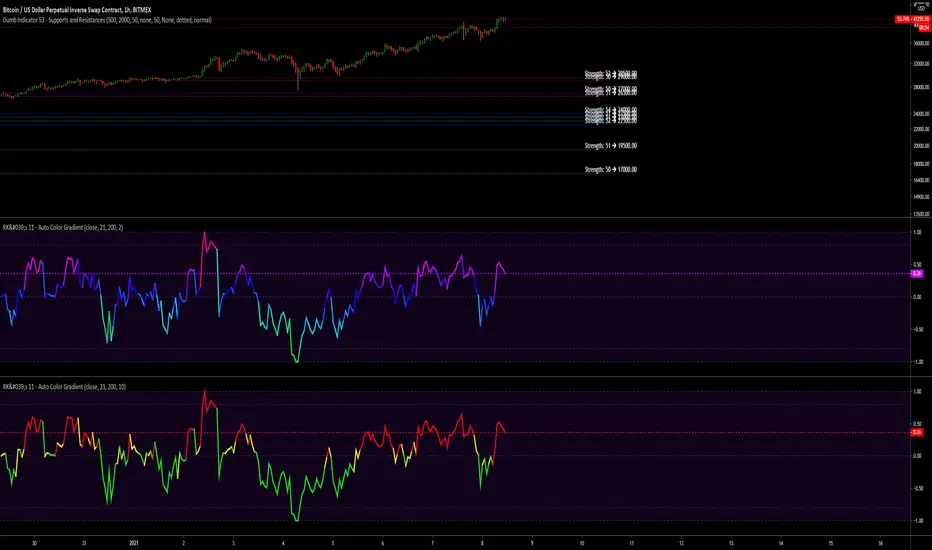
RK's Framework 01 - Auto Color GradientThis started as a personal arrays study, but after a few tests I decided to made a framework to get my own scripts simplest, lighter and faster.
And now I'm sharing with you guys.
Is very simple to use:
Copy evething inside "RK's Auto Color Gradient Framework" block;
Paste anywhere before the plotting;
Declare the color variable name calling the function "f_autocolor(___, ___)" with the source you gonna plot and the size of the scale do you want to use to compare the data.
Feel free to use.
Hope brings some profits for you guys!!
RK's 04 - Lots of MA Types RibbonHello again,
I made this script to test what is the better Moving Average type to predict the market direction, so I put a function with All the MA I know.
To go beyond, this script have an option to increase the MA length as a Fibonacci Number or any other simple number to step.
If the drawing is too slow, just reduce the amount of MA lines in the input option ("Number of MA to Plot:") to 10 or less and it will be faster.
Hope you like, and if you know other Moving Average type, just tell me how can I get the formula and (if its good, not copyrighted and I have time) I can add here and update for all of us.
Obs: To avoid errors, the Maximum Nth Fibonacci Term to use in MA Length is 19 (4181)
RSI & Volume Coloured BarsCandles get darker when volume is high, and brighter when volume is low. They are red or green depending on whether the RSI is above or below a threshold value, or alternatively you can pick a more vanilla coloring based on current close vs last close or last open.
For personal use as I enjoy the aesthetics of it. The more solid RSI coloring helps highlight the brightness variations from changing volume and makes trends crystal clear.
Inspired by "Volume Based Coloured Bars" by KivancOzbilgic:
and by and by RSI bars chart by taskman9:
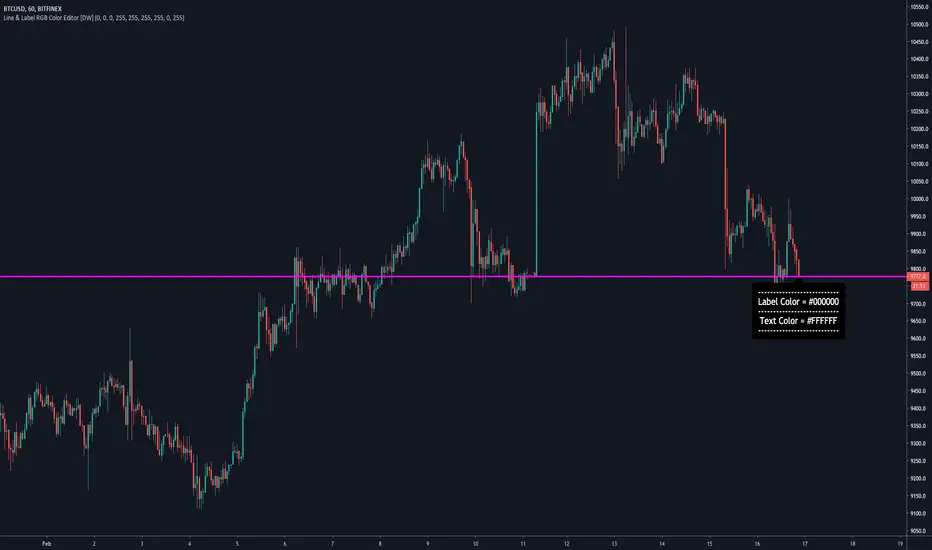
Line & Label RGB Color Editor [DW]This script is a template designed to provide developers with UI color customization for v4 lines and labels.
The color pallete used within this script is a full spectrum "web safe" format with 216 colors to choose from.
Colors are easily modified via the RGB inputs. The designated color selector function takes in the RGB values and returns the corresponding hex color.
Transparency can be modified as well. However, the color.new function only supports constant integers for transparency value, so it has to be manually adjusted within the code.
On line 42, you'll see a variable within the color selector function named trans. This is the transparency value, which can be set to any integer from 0 to 100. I have it set to 0 by default.
I included a sample label to demonstrate how the color editor works. It also displays the hex codes for the current label and text colors for some additional reference.
Implementing this in your own script is pretty straightforward.
All you need to do is copy the color selector function and inputs (feel free to name them whatever you want) into your desired script. Then, you can use them to declare your color variables.