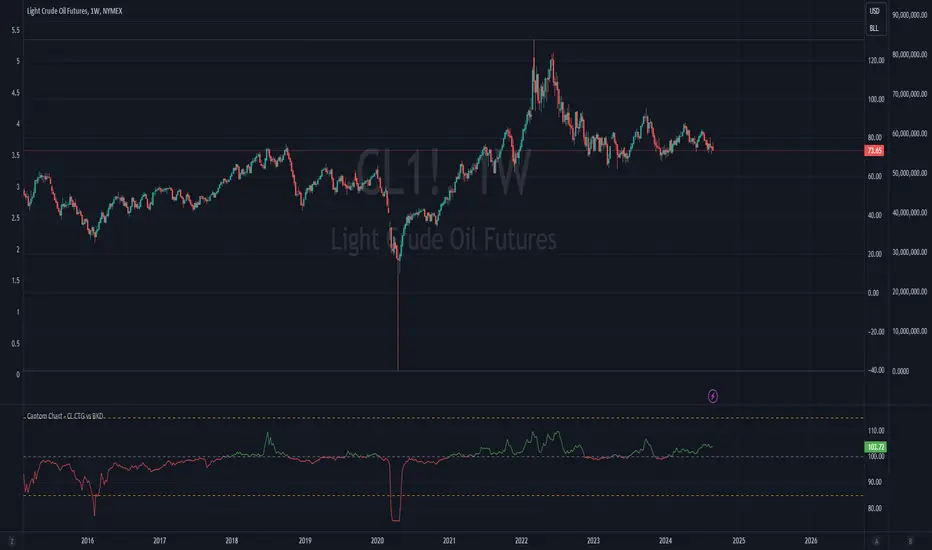
[astropark] Volume that mattersDear Followers,
does volume say something about market makers and what will happen in near future?
Today a new Price Action Tool , the "Volume that matters" indicator.
When a Market Maker executes his/her orders, there is no way he/she can do it without giving us some footprints: volume!
Specific Volume spikes happen as
reactions at support or resistance range , as well as at supply and demand zones
market makers' actions
trend switching in short-term and mid-term future
They can be both bullish or bearish , but the real problem is that not all, but only a few volume candle matters ! And this tool will filter them for you.
This indicator works
on every timeframe (eg. 15m, 30m, 1h, 2h, 4h, 6h, 1D, ...), the higher, the better!
on cryptocurrencies (eg. XBTUSD, ETHUSD, ETHBTC, both USDT and BTC markets, ...)
on forex (eg. EURUSD, GPBUSD, JPYUSD, ...)
on stocks (eg. AMZN, FB, TSLA, GOOG, NFLX, ...)
on commodities (eg. GOLD, SILVER, OIL, ...)
This indicator has following options:
edit volume filter and period analysis
edit filter based on fixed or percentage volatility change
edit filter based on candle value size
show a suggestion of possible entries and stoploss
You can enhance your trading by using it together with my "Engulfing that matters", my "Pinbar that matters" and my "Breaker Blocks (BB) and Supply/Demand Order Blocks (OB)" indicators, so you can easily spot confluences and have more confidence in trades.
Here my Engulfing that matters indicator
Here my Pinbar that matters indicator
Here my Breaker Blocks (BB) and Supply/Demand Order Blocks (OB) indicator
Here below some examples on how to use the indicator.
BTCUSDT 1D
ETHUSD 4h
LINKBTC 1h
EURUSD 4h
AMZN 1h
XAUUSD 4h
Here below an example of suggested entries and stoploss
This is a premium indicator , so send me a private message in order to get access to this script .
Komoditi
Intraday BUY/SELLBUY & SELL Scalp Signals for Crude Oil Future Contracts (Or it can be used with any scrip with good amount of Volume) based on Sma & RSI overbought/oversold alert (!) for possible reversal indication.
Take Buy position only if candle breaks the high of alert candle & for Sell positions, take position if candle breaks low of the alert candle.
Best to perform with 3 min timeframe on Crude Oil Futures
Crude Oil Indicator [SIDD]Crude Oil Indicator is giving two signal Bullish and Bearish . Bullish signal is used to take long trade and Bearish signal is used to close existing long trade and take new short trade and so on.
To get More signal of Bullish and Bearish user must enable More Signals check box that will check crossover and cross down of price close with Gaps.
I am using 2 ATR and one ADX and Gaps and VWMA to make signal profitable with 15 minutes 1 hr ,2hr,3hr,4hr chart time frame.
I have checked last few years data for back testing. Based on past performance it doesn't work well in 30 minute and 1 day chart time frame as results are not good in back testing. I have designed this indicator for Indian crude oil context though it can be used with other market as well.
1st ATR used to find trend with price crossover.
2nd ATR ADX is used to find the trend change details only. I have taken VWMA and ATR both to consider trend change.
Highlight Gap Up and Gap Down is used to know daily market opening gap up and gap down area. Gaps act as support and resistance .
VWMA Plotted as Blue line. Rising VWMA considered as uptrend and falling VWMA considered as downtrend.
Flat VWMA considered as no trend zone. In no trend zone every second third candles cross VWMA .
User must keep the default setting for getting better results as results are back tested. If setting changed then result may vary.
I have added here back tested performance user can see those results. I have added commission and slippage as well. Past year performance not guarantee for future years result so before taking any trade trader must take conscious decision.
This indicator is available on Subscription.
PM/ DM for more information about the script access.
Use the link below to obtain access to this indicator.
[astropark] Pinbar that mattersDear Followers,
today a new Price Action Tool , the "Pinbar that matters" , also known as Hammer (bullish case) and Inverted Hammer (bearish case).
Everybody knows the importance of pinbar to highlight
reaction at support or resistance range , as well as at supply and demand zones
market makers' actions
trend switching in short-term and mid-term future
They can be both bullish or bearish , but the real problem is that not all, but only a few pinbar matters ! And this tool will filter them for you.
This indicator works
on every timeframe (eg. 5m, 15m, 30m, 1h, 2h, 4h, 6h, 1D, ...)
on cryptocurrencies (eg. XBTUSD, ETHUSD, ETHBTC, both USDT and BTC markets, ...)
on forex (eg. EURUSD, GPBUSD, JPYUSD, ...)
on stocks (eg. AMZN, FB, TSLA, GOOG, NFLX, ...)
on commodities (eg. GOLD, SILVER, OIL, ...)
This indicator has following options:
edit filter based on fixed or percentage volatility change
edit filter based on candle value size
show a suggestion of possible entries and stoploss
Be sure to edit both fixed and percentage volatility options in order to have a correct filter on your chart and timeframe.
You can enhance your trading by using it together with my "Engulfing that matters" and my "Breaker Blocks (BB) and Supply/Demand Order Blocks (OB)" indicators, so you can easily spot important points where to start a short or a long trade.
Here my Engulfing that matters indicator
Here my Breaker Blocks (BB) and Supply/Demand Order Blocks (OB) indicator
Here below some examples on how to use the indicator.
XBTUSD 5m
ETHUSD 15m
BNBBTC 1h
ETHBTC 12h
EURUSD 1h
JPYUSD 4h
AMZN 5m
FB 4h
XAUUSD 15m
Copper Futures 1h
Here below an example of suggested entries and stoploss
This is a premium indicator , so send me a private message in order to get access to this script .
[astropark] Fair Value GapsDear Followers,
today a new epic tool, the "Fair Value Gap (FVG) Finder" .
Fair Value Gaps are quite important to trade, as they represent both volume and trading unfilled gaps, which most of the time are filled and then price reverse .
This indicator will let you set alerts on when a new FVG is found and when it is filled.
Traded together with Breaker Blocks (BB) and Supply/Demand Order Blocks (OB) , you can easily spot important points where to start a short or a long trade.
Here my Breaker Blocks (BB) and Supply/Demand Order Blocks (OB) indicator
Here below some examples on how to use the indicator.
On Bitcoin
On EURUSD
[astropark] Sniper ScalperDear Followers,
today a new Scalper Tool , which works great on all timeframes , from 1 minute to 1 month!
Keep in mind that this is a Scalper, so it's always a good idea to take or lock your profits, despite you may use it also for swing trading.
This tool has some cool features:
it works on all timeframes , from 1 minute to 1 month!
you can change a filter option from 1 (lowest) to 7 (highest)
Here some examples on how it performs on many timeframes and charts.
EURUSD 15m chart
AMZN 1h chart
Bitmex XBTUSD 4h chart
Bitfinex ETHUSD 1h chart
Binance Chainlink LINKBTC 1h chart
Binance Ethereum ETHBTC 1h chart
GOLD XAUUSD 15m chart
The user who wants to use this strategy, especially via an automated bot, must always manage to set a take profit and stoploss, as well as use a proper money and risk management strategies .
This is not the "Holy Grail", so use it with caution.
This is a premium indicator , so send me a private message in order to get access to this script.
Borsa İstanbul Correlation Analysis&Center of Gravity IndicatorFormula Used :
COG = SUM of closing prices Pn x (n+1) / Sum of closing prices Pn
Portfolio and Risk Management: Gold Based Net Growth CoefficientHello, if our topic is stocks, whatever signal we get, we have to divide and reduce the risk.
Apart from the risk, we need inflation-free figures to detect a clear growth.
Gold is one of the most successful tools to beat inflation in this regard in the historical context.
When the economy is good, we have to beat both commodities and inflation.
For this purpose, I found it appropriate to develop a net growth factor free from gold growth.
Investors need several stocks with a high growth rate and as much risk-free as possible.
Personally, I think that the science of portfolio and risk management will last a lifetime and should continue.
I think this subject is a research and development subject.(R & D)
My research and publications on this matter will continue publicly.
I wish everyone a good day.
NOTE : You can determine the return in the time period you want to look back by adjusting the period in the rate you want from the menu.
The standard value is 200 days. (1 year)
GOLD SUPER TREND ARROW SIGNALS STRATEGY WITH PERFORMANCEThe strategy is based on combination of ATR, Moving Averages, Volatility indicators that was filtered and final strategy based on accurate arrows that catch trend and
also predict pivot points for intraday Gold ( XAUUSD ) charts.
The strategy script can be used for time frames 30 MIN, 45 MIN, 1Hour, 4 HOURS.
The goal was to create trending strategy with maximum profit and lowest drawdown.
For initial deposit $12000 time frame 30 MIN profit was 42% with maximum drawdown 6%:
For time frame 45 MIN profit was 30% with maximum drawdown 5%:
Open Close Profit - [Alerts]This script comes with the following indicators and features:
Moving Average trend filter (Hull, ZLEMA, McGinley)
Pin Bar Filter
MACD indicator
Pump and Dump filter
Entry, Take Profit, and Stop Loss Alerts
And a few more indicators in the back-end to increase accuracy, optimize entries and filter out sideways PA
This script works really well as a scalper on lower Time Frames as well as on higher Time Frames. Besides that you can also use it on pretty much any coin or asset.
This script is not repainting. We advise to use alerts on “Once Per Bar Close”.
If you’d like to automate this script you can do that by using AutoView, ProfitView, ProfitTrailer, CryptoHopper etc.
Leave a message if you’d like to try it out.
Deviation from the futures market for GOLDThis indicator shows the deviation from the gold futures market.
Blue FX Trend StrategyHi, welcome to the Blue FX Trend Strategy Script.
What does it do?
Our strategy will help you identify the current trend in the markets and highlight when this is changing. The strategy itself is based upon 4 indicators lining up in total confluence to increase the probability of the trade being a success, this is specifically an EMA, MACD settings, Supertrend criteria and also Momentum.
Absolutely no technical analysis is needed to trade this successfully - this can be used on all time frames and all pairs - obviously with varying profitability as all pairs work differently - this can be reviewed quickly in 'Strategy Tester' to hone in on your own desired settings.
When all criteria is in alignment the strategy will convert all candles to the relevant colour - Green for an uptrend and Red for a downtrend; a candle that is printed normally simply shows that no current trend is in place to warrant a colour change. A normal coloured candle could possibly indicate a change in current market direction or the market consolidating before a further move in the initial direction. When a new signal is valid 'Blue FX Buy'' or 'Blue FX Sell' will be displayed and the small arrow shown on candle open for entry.
How do I use it?
Our strategy is invite only - upon joining our group we will allow you access to the script. This will then simply display on your device ready for you to start trading from. There is substantial functionality within the strategy, you can;
See the success of the default settings in the past using the 'Strategy Tester' Function for numerous settings
1. Following the settings 'Trail'
2. Changing your TP function with the other criteria listed
3. Using a Fixed TP or SL function
Upon changing the Script to 'Fixed' you will see numerous trades on the chart displayed differently.
Scaling into a profitable position is also possible - this is ideally done when the candle colour confirms the trend is continuing after rejection/support from the EMA; we show this below;
You could also enter here if you missed the initial sell signal, we have MA rejection and a red printed candle indicating all confluences are in play and we have high probability for the move to continue.
How do I know its profitable?
We have built numerous customisable settings into the strategy for you to see that this is profitable - you can visually see this too. The settings are also customisable to find the right criteria for the right pair on the right time-frame. Ultimately, with the strategy confluences in place, you are putting probability in your favour and can quickly determine the trend in place if there is one. Within the customisable settings there is a compound function too, so if you were to compound your profit the results can be exceptional.
We have also added an H4 confluence, so you can ensure if trading on a lower time-frame you are in the overall direction of the H4 trend too, a useful setting for more confluence again.
Where do I set my Stop loss or Take Profit?
There is no right or wrong to this and we have attempted to build numerous ways of doing this into the strategy for reference.
For setting a SL you could;
1. Use a fixed SL.
2. Place the SL below the last high or low in the trend.
3. Use an ATR function.
4. Place the SL 5 pips below the last 3 candles.
5. Or, trail the price if you are on screen until the next signal is given and a new trend starts - although unless a big trend, you may miss out on some profit by the time price has pulled back.
For placing a Take Profit, you could;
1. Use a fixed TP.
2. Look for the next supply/demand area on the chart (if it breaks and candle colour supports direction - you could enter again).
3. Use an ATR function.
5. Or, trail the price if you are on screen until the next signal is given and a new trend starts - although unless a big trend, you may miss out on some profit by the time price has pulled back.
6. Secure multiple TPs - 20/50/100 pips with Stop loss to entry after the first target is hit.
Here are some examples of the Buy and Sell signals in action;
Will also work on Commodities and Indices as shown below too;
Our recommended visual settings are below;
1. Set to'Trail' Strategy
2. Under 'Style' tab, select Trades on Chart, but un-select both Signal Labels and Quantity to clean up the chart - these settings are useful when testing to see where the trades are opened and closed.
3. We like the candles changing colour to the trend and criteria set however, these can be turned off to display normal bullish and bearish candles.
When reviewing profitability you can do this by selecting 'Overview' 'Performance Summary' and 'List of Trades'.
Please consider that the settings based into the strategy could differ to your own money management rules and your management of your SL and TP as outlined above - we have tried to cover as many bases as possible here.
We look forward to you using this strategy to profit from the market, please share your feedback and results with us.
Kind regards
Blue FX Team
GOLD_COTThis indicator shows GOLD_COT.
Uniqueness: You can show open interest in addition to long, short and net positions.
Correlation & BetaDisplay the correlation coefficient and/or Beta of an asset to a specified market.
Options to:
- Specify market (S&P500 futures by default)
- Display one or other metrics
- Modify assessment period (200 bars by default)
- Calculate on price, returns or log-returns
Yield Curve Inversion MonitorIdentifies when the US Treasury Yield Curve inverts (2 and 10 year bond rates).
When they ‘invert’ long-term bonds have a lower interest rate than short-term bonds. In other words, the bond market is pricing in a significant drop in future interest rates (which might be caused by the US Fed fighting off a recession in the future).
In the last 50 years, every time the US treasury yield curve inverted a recession followed within 3 years. On average the S&P500 gained 19.1% following the inversion and peaked 13 months later. In other words, as far as investors are concerned, the recession began roughly one year later.
However, once the market peaks, it then drops 37.6% on average, wiping out all those gains and more.
...Looks like 2020 is shaping up to be another prime example.
Autonomouscript
Hello friends, in this script, hand drawing and loyalty to terminals are minimized.
***FEATURES
1 - Rational Auto Support and Resistance Levels
NOTE : For 1W TF , you can take 0.000 - 1.000 for 1 area , i didn't find to necessary to autoplot this condition because of between levels are so large and for long term.
Multi time-frame
In small time frames, unreasonable support eliminates resistance levels.
Suitable for every pair.
If the prices change by region, automatic drawing is made in the new region and given to the screen.
Automatic Plotting Feature
Rational Levels
2 - Auto Risk/Reward Ratio Calculator
Calculations are made according to support and resistance in less than 4 hours TF.
The opposite is true for Short.
2 methods in 4 hours and larger time frames and two zones specified:
1. Price < 0.618 Level :
Long Position Calculation : From Current Support to 0.618 Level
Short Position Calculation: From Current Resistance to 0.000 Level
2. Price > 0.618 Level
Long Position Calculation :Support and 1.000 Level .
Short Position Calculation : Resistance and 0.000 Level
Risk/Reward Ratio Calculation Examples (TF = Timeframe) :
1 - TF < 4H and Long - Short Risk/Reward Ratio Calculation :
For Long Position :
For Short Position :
2 - TF > 4H and Long-Short Risk/Reward Ratio Calculation :
For Long Position :
For Short Position :
NOTE :
Some algorithms have been added to make this formulation accurate and safe.
Therefore, Stop-Loss can be flexed slightly under the support or on the resistance in short position.
The target does not change.
Staying on the safe side calculates the risk / reward ratio for the worst possible odds.
*** Since stop-loss levels are chosen close to support and resistance and determine financial leverage, there is absolutely no need for stop-loss, the investor can determine himself according to the risk / reward ratio.
Generally, the support is slightly lower for long and the resistance slightly reasonable for short.
3 - Moving Averages and Cloud
a-) Slow Moving Average (Fuchsia)
Uses Autonomous LSTM moving average for external timeframes of 1W, Relativity moving average for timeframes 1W and above.
NOTE : They are built on price instead of Stochastic Money Flow Index.
And because they are price based
The High-Low Selection Algorithm has been removed.
For more information :
Autonomous LSTM =>
Relativity =>
b-) Signal Moving Average (Blue)
I just added this average after long tests.
It was created based on the relative states of the Relativity and Autonomous LSTM and candle states.
It is very fast and adaptive but, you should definitely use the risk / reward ratio if you are going to trade just by looking at it.
c_) Cloud :
It is the region between fast and slow moving average.
Cloud Color : Red for : crossunder(price , signal ma) and Green for : crossover(price,signal ma)
d-) Plotarrows :
Plotted after crossover and crossunder closings to inform the intersection of the two adaptive moving averages.
e*) Triangle Shapes :
They only reports when the moving average of the signal is long and short. And cloud color is same but without risk/reward radio rule.Rules :
Blue : Long Condition with Long Risk/Reward Ratio < 2.5
Orange : Short Condition with Short Risk/Reward Ratio < 2.5
Green : Long Condition with Long Risk/Reward Ratio >= 2.5
Red : Short Condition with Short Risk/Reward Ratio >= 2.5
4 - INFOPANEL - Trader Panel
- Calculation results of Risk / Reward Ratios for each bar for Long and Short Position
- Current Support and Resistance Levels
- Percentage change of the price moving average (period = signal period) only in the signal period
* Percentage change of the volume moving average (period = signal period) only in the signal period
* Supply and Demand Bias :
They are given separately for both long and short (Bull - Bear).
It is the reflection of the quantum formulas that form the core of relativity.
Nevertheless, the signal moving averages data price and volume are also above in InfoPanel.
Important Note : Two starred rules are given to investors and traders to choose between the following facts :
Increasing Volume __ Increasing Price = > Healthy Bear Session
Increasing Price __ Increasing Volume = > Healthy Bull Session
Decreasing Volume __ Increasing Price = > Bulls are weakening
Decreasing Volume __ Decreasing Price = > Bears are weakening
*** SUMMARY AND USAGE :
NOTES
It's definitely not just for signals,
all data in the system
evaluating according to the current economic agenda,
carry out your trade like that.
You can zoom in using the zoom in zoom out feature (+) of Tradingview, especially in small timeframes.
And according to the signal average of the price, cloud coloring was made in green and red.
Because in some cases, infopanel can intervene and block small triangles.
Alerts :
There is no need for any precise alert.
In case of need, users can set alarms at support and resistance levels.
NOTE :
In the design and basic cases of support and resistance levels,inspired by borserman's this script:
Special thanks to him.
Last Note and Reminder
This script may will be updated in terms of design and simplification if deemed necessary.
Best regards.
Gold-Stocks RatioA historic risk-off flag.
When the Gold-Stocks Ratio is above the 200 week moving average, investors may fair better holding gold and avoiding equities, as was the case for the last 20 years.
™TradeChartist - Show and Tell - Ichimoku Cloud™TradeChartist Show and Tell - Ichimoku Cloud is a free and easy to use script that helps anyone learn and understand the Ichimoku cloud by using the 'Show and Tell' option from the indicator settings and by choosing the Ichimoku component/Signal from the dropdown box. For individuals new to Ichimoku Cloud , Show and Tell option will help explain the components and signals of Ichimoku Cloud on the chart without having to navigate away from price action, thus making it easier to learn and understand Ichimoku cloud with respect to chart price action on the corresponding time frame.
The indicator automatically detects cryptocurrencies as it uses different settings specific to cryptocurrencies market - (20,60,120,30) respectively as opposed to classic - (9,26,52,26).
When 'Show and Tell' is unchecked from indicator settings, the script detects signals and important Ichimoku events like Bull/Bear crosses, Bullish/Bearish Kumo Twists, Bullish/Bearish Kumo Breakouts etc and plots labels on chart. To turn off this feature, just uncheck 'Labels' from the styles tab under the indicator settings.
This is a free to use indicator. Give a thumbs up or leave a comment if you like the script.
[astropark] ALGO Trading V3 [strategy]Dear Followers,
today another awesome Swing and Scalping Trading Strategy indicator, runnable on a bot , which works great on many timeframes (from 1h and above is suggested), just write me in order to help you find correct settings).
It must be said that this strategy works even better on 1m Renko chart!
If you are a scalper or you are a swing trader, you will love suggested entries for fast and long-lasting profit.
Keep in mind that a proper trailing stop strategy and risk management and money management strategies are very important (DM me if you need any clarification on these points).
This is not an evolution of "ALGO Trading V1" or "ALGO Trading V2" , but a twin sister of them.
For your reference, here it is the "ALGO Trading V1" indicator
and here the "ALGO Trading V2"
This strategy has the following options:
enable/disable signals on chart
enable/disable bars and background coloring based on trend
enable/disable a "filter noise" option , which try to reduce overtrading (you can easily check it on backtesting)
enable/disable a Take Profit / Stop Loss option (you can easily check it on backtesting too)
enable/disable a secret SmartOption which may improve profit on your chart (again, check it on you chart if it helps or not)
This strategy only trigger 1 buy or 1 sell. If you enable Take Profit / Stop Loss option, consider that many TP can be triggered before trend reversal, so take partial profit on every TP an eventually buy/sell back lower/higher to maximize your profit.
In order to get notified when a signal is triggered, you need to use the "alarms" version of this indicator (just search for astropark's "ALGO Trading V3" indicator and choose the one with "alarms" suffix).
Strategy results are calculated on the time window from 1995 to now, so on more than 15 years, using 1000$ as initial capital and working at 1x leverage (so no leverage at all! If you like to use leverage, be sure to use a safe option, like 3x or 5x at most in order to have liquidation price very far).
This is not the "Holy Grail", so use a proper risk management strategy.
This script will let you backtest how the indicator will perform on any chart and timeframe you may like to test and/or trade. Of course results will be very different depending on the chart and timeframe you will open. I tested a lot of charts and always you can find a combination that keep this strategy in profit on swing trading style (and this means that if you can have a daily look at the chart you can always manage to maximize your profit on each trade!)
This is a premium indicator , so send me a private message in order to get access to this script.
Silver Long/Short Combines Gold and Silver price ratio with SMA trend indicators for buy and sell signals.
[astropark] Ichimoku Cloud Strategy [alarms]Dear Followers,
today a Great Swing Trading Strategy , runnable on a bot , which works great on High Timeframes (1D is suggested!) but also even better on 1m Renko chart.
If you are a scalper, you will love suggested entries for fast profit. You can run it on 1h timeframe (below is not suggested) if you are used to scalp trading and close each trade whenever you feel happy (a proper trailing stop strategy is suggested anyway).
This strategy is based on the Ichimoku Cloud Indicator and let's you set a lot of settings:
works on all timeframes (but 1D and above is suggested on normal candlesticks chart)
you can run this indicator on 1m Renko chart (be sure to enable the "USING RENKO CHART? ENABLE THIS OPTION" setting)
you can use 4 kind of Ichimoku Cloud (Custom, Slow, Standard and Fast - keep only one enabled)
you can make the Ichimoku Cloud show or not
you can enable showing the possibile re-entries
you can enable an heiking ashi analysis
you can enable a trailing stop strategy ("Auto Trailing Stop Loss" and "Close Trade When Price Breaks Above the Ichimoku Cloud" are two options very much suggested to keep enabled, especially on bot trading)
you can create your own trailing stop stategy and take profit strategy
you can enable a simple take profit strategy based on RSI Overbought and Oversold levels
This strategy only trigger 1 buy or 1 sell, but if you missed the possibility to open your long or short position don't get mad, but just enable the "show re-entry signals" option, so yout will be able to enter again (be sure to always use a proper money management ).
By the way, you can set any alarms you like in order to get notified when any kind of signal is triggered (you need to use the "alarms" version for this).
Strategy results are calculated on the timeframe from May 2017 to now, so on 2 years and half, using 10000$ as initial capital and working at 1x leverage (so no leverage at all! If you like to use leverage, be sure tp use a safe option, like 3x or 5x at most in order to have liquidation price very far).
This is not the "Holy Grail", so use a proper risk management strategy.
This script will let you set all notifications you may need in order to be alerted on each triggered signals (there is also an "ALL-IN-ONE" option for free tradingview users.
The backtesting version of this indicator, which will let you backtest how the indicator will perform on any chart you may test, can be found by searching for "Ichimoku Cloud Strategy" and then choosing the astropark indicator with "red and green arrows" at the end of the name. You can find it here below too:
This is a premium indicator , so send me a private message in order to get access to this script.
[astropark] Ichimoku Cloud StrategyDear Followers,
today a Great Swing Trading Strategy , runnable on a bot , which works great on High Timeframes (1D is suggested!) but also even better on 1m Renko chart.
If you are a scalper, you will love suggested entries for fast profit. You can run it on 1h timeframe (below is not suggested) if you are used to scalp trading and close each trade whenever you feel happy (a proper trailing stop strategy is suggested anyway).
This strategy is based on the Ichimoku Cloud Indicator and let's you set a lot of settings:
works on all timeframes (but 1D and above is suggested on normal candlesticks chart)
you can run this indicator on 1m Renko chart (be sure to enable the "USING RENKO CHART? ENABLE THIS OPTION" setting)
you can use 4 kind of Ichimoku Cloud (Custom, Slow, Standard and Fast - keep only one enabled)
you can make the Ichimoku Cloud show or not
you can enable showing the possibile re-entries
you can enable an heiking ashi analysis
you can enable a trailing stop strategy ("Auto Trailing Stop Loss" and "Close Trade When Price Breaks Above the Ichimoku Cloud" are two options very much suggested to keep enabled, especially on bot trading)
you can create your own trailing stop stategy and take profit strategy
you can enable a simple take profit strategy based on RSI Overbought and Oversold levels
This strategy only trigger 1 buy or 1 sell, but if you missed the possibility to open your long or short position don't get mad, but just enable the "show re-entry signals" option, so yout will be able to enter again (be sure to always use a proper money management ).
By the way, you can set any alarms you like in order to get notified when any kind of signal is triggered (you need to use the "alarms" version for this).
Strategy results are calculated on the timeframe from January 2016 to now, so on 3 years, using 10000$ as initial capital, doing only 6 trades (great swings!) and working at 1x leverage (so no leverage at all! perfect spot trading style!). If you like to use leverage, be sure tp use a safe option, like 3x or 5x at most in order to have liquidation price very far).
This is not the "Holy Grail", so use a proper risk management strategy.
This script will let you backtest how the indicator will perform on any chart you may test. Of course results will be very different depending on the chart you will open. I tested a lot of charts and always you can find a combination that keep this strategy in profit on swing trading style (and this means that if you can have a daily look at the chart you can always manage to maximize your profit on each trade!
The alarms version of this indicator, which will let you set all notifications you may need in order to be alerted on each triggered signals, can be found by searching for "astropark Ichimoku Cloud Strategy" and then choosing the "astropark" indicator with "alarms" suffix in the name.
This is a premium indicator , so send me a private message in order to get access to this script.