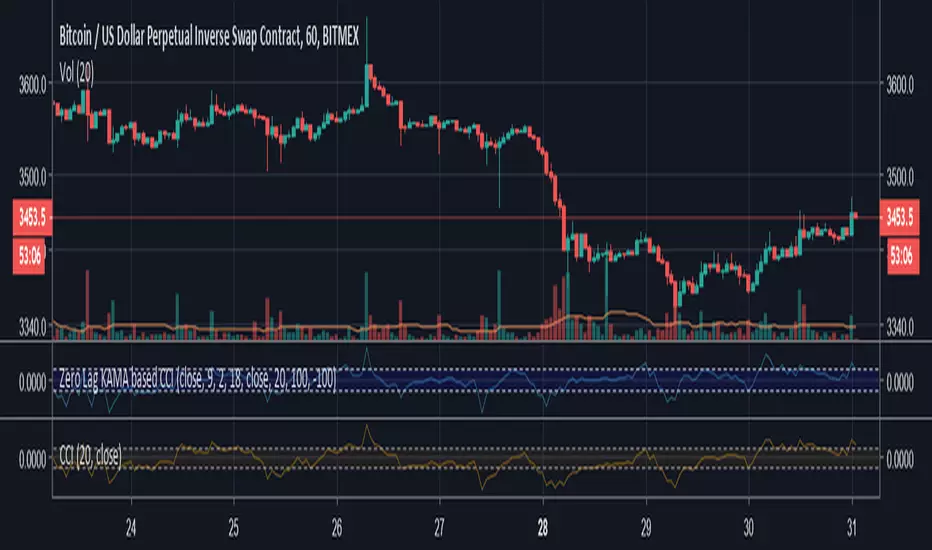
Zero Lag KAMA based CCIExperiment that uses an (optional) Zero Lag adjustment and KAMA instead of the default SMA to calculate the CCI.
Commodity Channel Index (CCI)
Donochian CCISo this indicator have the following:
1. MTF CCI
2. donochian channel MTF both non repaint mode
buliish and bearish zone determine by ratio of the the donochian cahnnel
enter or exit can be either the bullish or bearish change of color or by cross over or under of the CCI
or combination of both
The high max and low max of the donochian channel show in hilated bar

Mby_test straegythis indicator based on Mby_stoch and CCI flow +etc
this indicator got about 66% benefits.

CCI × MACD SIGNALThis is a script that displays entry points using "CCI" and "MACD".
I think that scalping will work well if I use "FXBTCJPY" 1 minute as the main and it would be nice if you do not want your interests and take a little profit

Steroid CCI w/ Overbought & Oversold Alert//@version=2
//By Tantamount
//Channel Commodity Index (CCI) with overbought and oversold alert features! Highly configurable indicator that includes a Topography map feature, used to detect & show minute threshold crosses.
//CCI is a momentum based technical trading tool used to help determine when an asset is reaching an overbought or oversold condition and is an great alternative to RSI.
//This CCI tool comes loaded with features and is easily configurable back to standard CCI or with your own preferences.
Customize to your liking:
Simple alert signals
The full enchilada, with Topo map view!
Stand alone CCI oscillator

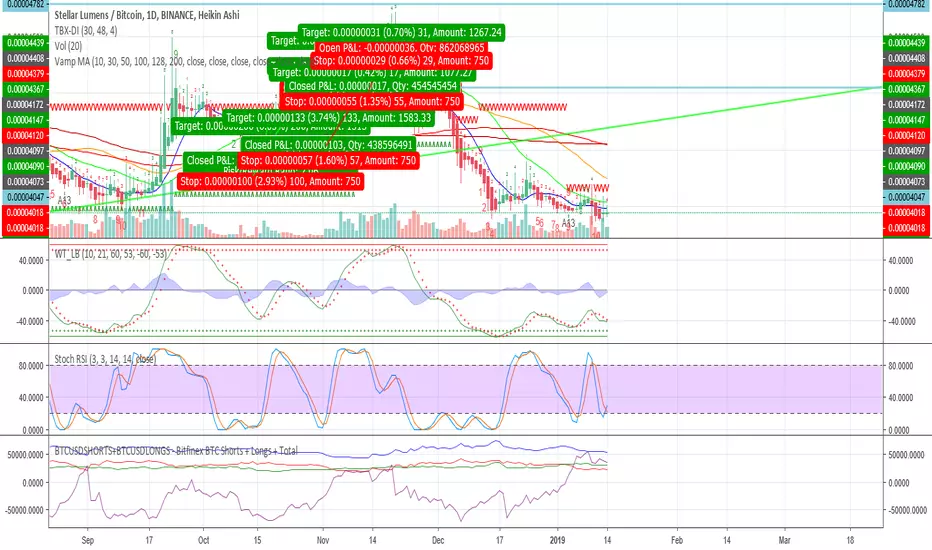
BTCUSDSHORTS+BTCUSDLONGS - Bitfinex BTC Shorts + Longs + TotalLongs, Shorts, Longs + Shorts, Longs VS Shorts

ccid (with high low histogram)So this indicator has the following : CCI where the buy and sell signal can be either cross of the fast the slow and vice versa or cross of CCI bellow -50 and cross down CCI +50
the histogram (blue and red) is made by high low like histogram the buy and sell is based on crossing of the 0 . since its MTF type . you can toon the TF either to the time frame or use lower graph time with higher TF
since both indicator complement each other then I put them together

CCI Divergence w/ TrendLooks for divergences between the CCI and price. Provides signals based on the trend.


CCI strategy(Lirshah)cci CCI is a versatile momentum oscillator that can be used to identify overbought/oversold levels or trend reversals.
The indicator becomes overbought or oversold when it reaches a relative extreme.
this strategy has been written based on CCI oscillator , and has a good results on some of crypto pairs.

[SC]CCI - RainbowOverlay CCI lines of various durations are displayed.
36 CCI lines between min period and max period are calculated.
And ema is applied to those lines twice.

Multi-Timeframe Commodity Channel IndexCCI indicator that will display resolutions other than the current.

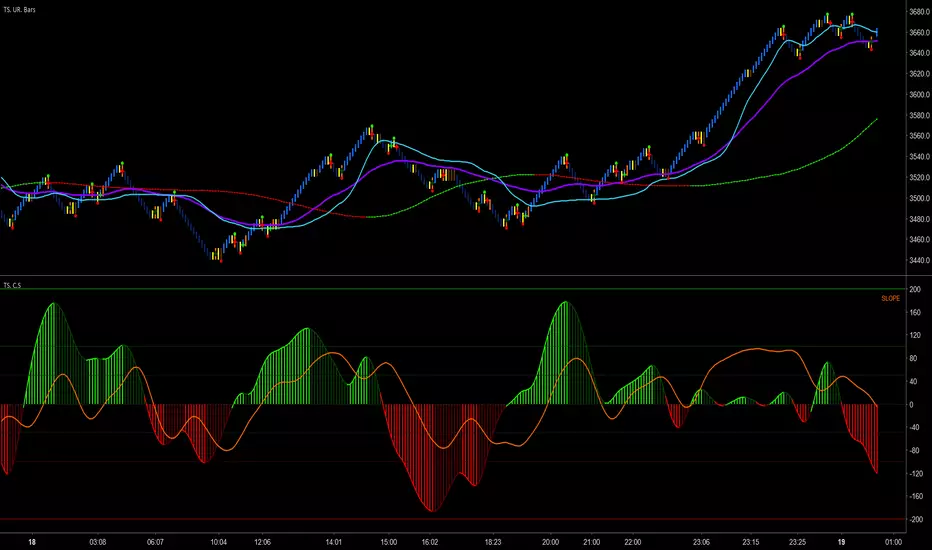
Trader Set - CCI Slope ComboThis is an oscillator that I was doing R&D for developing it, it took near three weeks. If you ever use Super CCI and keep it side by side with slope oscillator, in more than few cases, day in day out, you would find that both of them show similarities. These similarities suggest that there should be a way to combine these two and get a unique indicator that would do both jobs at the same time without the complexity of CCI and WITH simplicity of Slope!
The answer for the R&D was in ehlers books. Well, not the formulas he gave to the world but the concept! Here is a combination behavior of CCI and Slope, if you ever drop ehlers Universal Oscillator near this, you would see where the concept came but they are totally different in look and behavior.
Please don't contact me for access. This is part of my personal methodology that I teach to my students and soon, the English section of my website will be ready with English course for the methodology. When the course is ready I will announce it under every related indicator and those who participate will have access to these indicators.
Color Coded Standard CCIThis is an old script that had limited access for some of my students, these days, it has no usage in my teaching methodology, but because some of my students asked for it, I updated it with the addition of a moving average and a formulated regression on the cci. Keep in mind, there is no special methodology to use the moving average or the regression in any way, it's up to you to decide if you need them or you want to hide them and to develop your own methods.

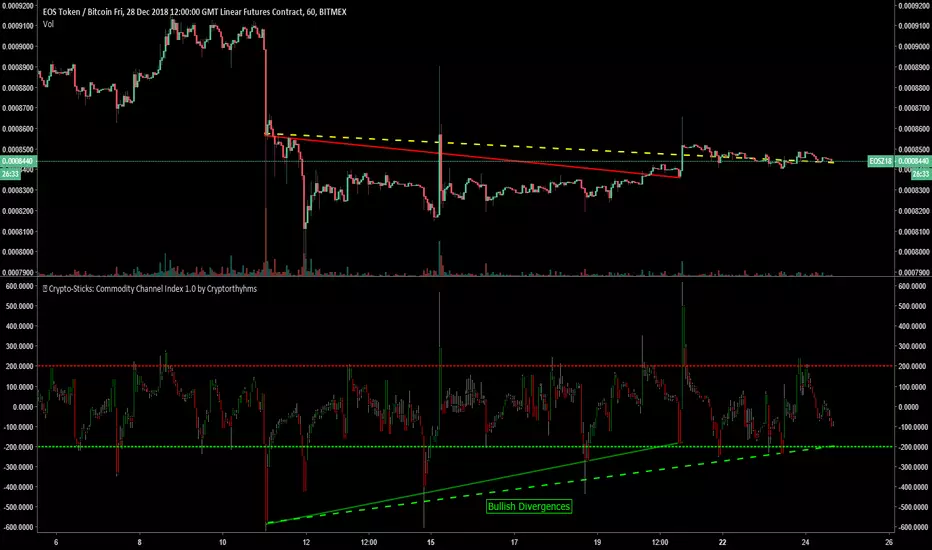
🥢 Crypto-Sticks: Commodity Channel Index 1.0 by Cryptorthyhms🥢 Crypto-Sticks™ CCI
A new series of indicators brought to you by Cryptorthyhms...giving you an alternate look at your trusted favorites!
🚀 Indicator Specific Info
I have found this indicator to show divergences as shown on the main chart. It also iuncludes the standard signaling system from CCI allowing you to define overbought and oversold zones. This indicator is freely available for anyone from the public library.
🚀 Crypto-Sticks General Info
💭This series isnt polished 100%, and I have some more options I will add in the future. But for now, I want to just release them, as I am not sure when I will have the time to put more work into them (many other big projects I am working on).
📊Its basically reinterpretations of all your favorite indicators. I calculate the values a little bit differently than normal, but the end result is creating a candlestick chart (for the indicator!). Then I added the option to plot them as Heiken Ashi candles to smooth out noise and make signaling easier. Here's how it looks as Heiken Ashi:
🔊Lastly I implemented a Volume Weighting system for them all which simply integrates volume into the formulas for these indicators. For the most part this feature is experimental and doesn't provide huge utility (yet - I have other ways I want to try it as well - just no time). Though on some of the indicators it already shows great promise. Here is Volume Weighted + Heiken Ashi:
👍Enjoying this indicator or find it useful? Please give me a like and follow! There are many more indicators to be released in this series, not to mention I post crypto analysis and other free indicators regularly.
💬Questions? Comments? Want to get access to an entire suite of proven trading indicators? Come visit us on telegram and chat, or just soak up some knowledge. We make timely posts about the market, news, and strategy everyday. Our community isnt open only to subscribers - everyone is welcome to join.
CCI MTF: Multi-timeframe CCIThis script can be quite useful to get a quick glance at momentum readings in the 3 main timeframes I use: Daily, Weekly and Monthly.
It helps, together with RgMov and the MTPC tool, to know how a market is moving and what to expect, without having to cycle through two or three timeframes constantly.
Cheers,
Ivan Labrie.

Trader Set - Woodies Super CCIThis a color coded of woodies supper CCI, everyone knows about woodies CCI, but supper CCI is something he put in together lately, like some other things from his system, the original idea of color coding CCI on different lines was not his !
I moved the chopzone to 150, imo, chopzone sitting close to sidewinder gives easier feedback to read, also, if you notice, other than the base line's color code, i have two lines that are similar to eachother, these are showing the relative positions of turbo, cci, and regression with eachother, three circles at the right side show turbo, cci, and regression's positions relative to the horizontal zones. In other words, when things get really close to eachother, no more guessing needed. one more thing that I may add to this tommorrow is to put signalling signs on the lines when they cross to help identifying the crosses and the color would code you toward possible positions in "MY" system.
Please, don't ask for access, only my students from my classes will have access to this indicator, at least for time being. If at any time in future I wish to sell, you will find the price and how to buy in the comments bellow.

Trader Set - Uni Renko MCCIThis is what Woodie calls MCCI, a band of moving averages.
The name MCCI means Moving Commodity Channel Index, although it's one of the rare woodies original indicators (shame on you woodie lol) he suggests that the relation between the bars or price with the bands are something like the movement of the CCI indicator. I can't accept that. For me, these bands have other usages that I teach to my students.
To use this, you should set your chart on Renko, Traditional with box size of 3.
Please, don't ask for access, only my students from my classes will have access to this indicator, at least for time being. If at any time in future I wish to sell, you will find the price and how to buy in the comments bellow.

CCI Highlighted [ankit4349]>> This script is purely based on Commodity Channel Index (CCI) with multiple CCI instances being used within one oscillator.
>> User can use as much as 5 CCI instances/plot within one oscillator.
> How to use :
1. When Bullish :
Whenever CCI length 14 crosses above -100(negative 100) that means bullish momentum is supported.
Best bullish/long entry would be when CCI length 14 crosses above -100(negative 100) as mentioned above and at the same time CCI length
200 is bouncing on top of +100(positive 100).
2. When Bearish :
Whenever CCI length 14 crosses below +100(positive 100) that means bearish momentum is supported .
Best bearish/short entry would be when CCI length 14 crosses below +100(positive 100) as mentioned above and at the same time CCI length
200 is bouncing at bottom of -100(negative 100) .
> Color Clarity :
a. Bullish support is highlighted GREEN and bearish support is highlighted RED within the oscillator background with respect to
Length 1 (i.e 14 by default) .
b. PURPLE is highhighted when Length 5(i.e 200 by default) is bouncing either on top of +100(for bullish) or at bottom of -100(for bearish).
c. AQUA is highlighted when Length 3(i.e 50 by default) is bouncing on top or at bottom of 0 from either side respectively.
d. Best entry in both cases i.e bullish or bearish as mentioned above('How to use') is highlighted WHITE by default.
> Tip:
Just observe the color outputs on any timeframe in a chart as it works fractally on every timeframe , it will help you understand better with
clarity.
> You are always free to experiment with the CCI lengths, change highlighted color and hide/unhide the Lengths as per your requirements in
setting/format .

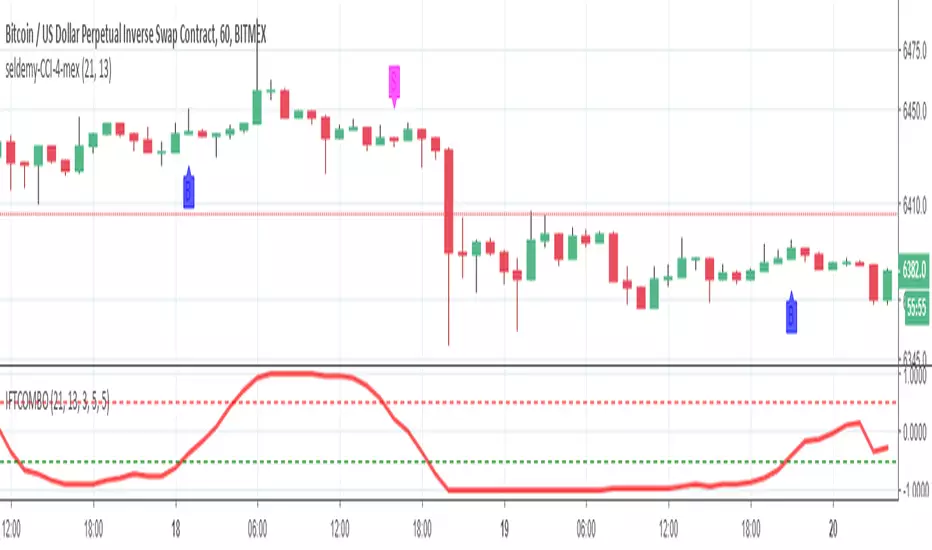
Seldemy-CCI-for-Auto4mexThis is the script I used in BITMEX for auto trading XBTUSD using great Chrome extension called Auto4mex . Default settings are good for 1h candle nowadays (September October 2018 period for Bitcoin). If more volatility comes adjusting needed. Enjoy !
yutas_CCI+RCIS+StochRSI_ver.freever .free
CCI×3
RCI×3
StochRSI cross sign × 1
It can be used as a material to judge the flow by closing CCI , RCI -2.78% and StochRSI.
Three CCIs and three RCIs can be displayed.
With the time axis change function, you can check the flow on one screen.
It is easy to grasp the flow of the whole by watching the eye with one hour's feet etc.
Let's aim at when all directions are complete.
※There will be no upcoming updates as it will be a free public version.
CCIとRCIとStochRSIのクロスで流れを判断する材料に使えます。
CCIとRCIはそれぞれ3本表示可能。
時間軸変更機能により、1画面で流れを確認出来ます。
1時間足等を使って、目を細めて見ると全体の流れを掴みやすいです。
全ての向きが揃った時を狙いましょう。
※無料公開バージョンになりますので今後の更新はない予定です。
