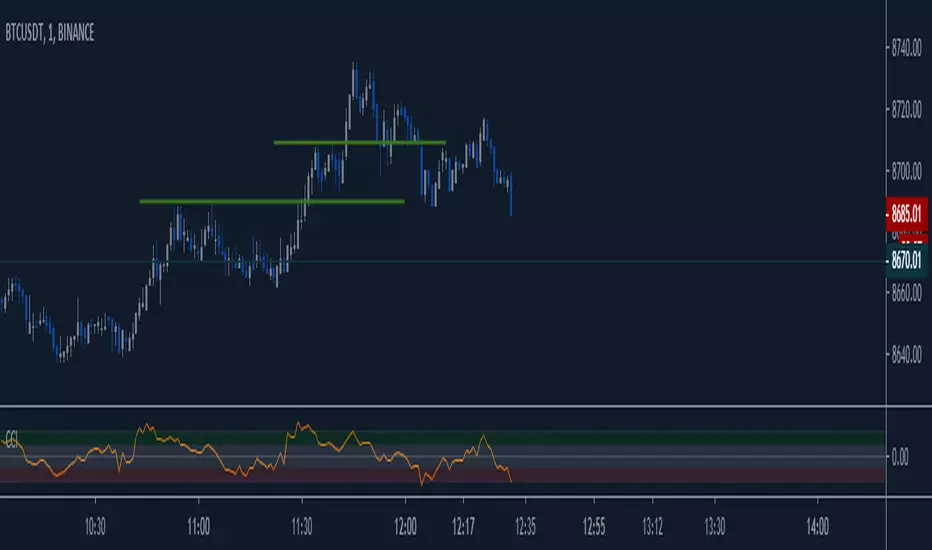
Commodity Channel Index (CCI)

Basic BIASBasic BIAS
Deviation rate (bias), also known as deviation rate, or y-value for short, is an indicator to reflect the deviation degree between the price and MA in a certain period of time by calculating the percentage difference between the market index or closing price and a moving average, so as to obtain the possibility that the price will reverse or rebound due to deviation from moving average trend in case of severe fluctuation, and that the price will move within the normal fluctuation range Form the credibility of continuing the original potential.
The deviation rate is a percentage of the deviation degree (gap rate) between the price and ma.
The departure rate curve (bias) is a curve that connects the values of each bias into a line and obtains a wave extension curve with the value of 0 as the horizontal axis.
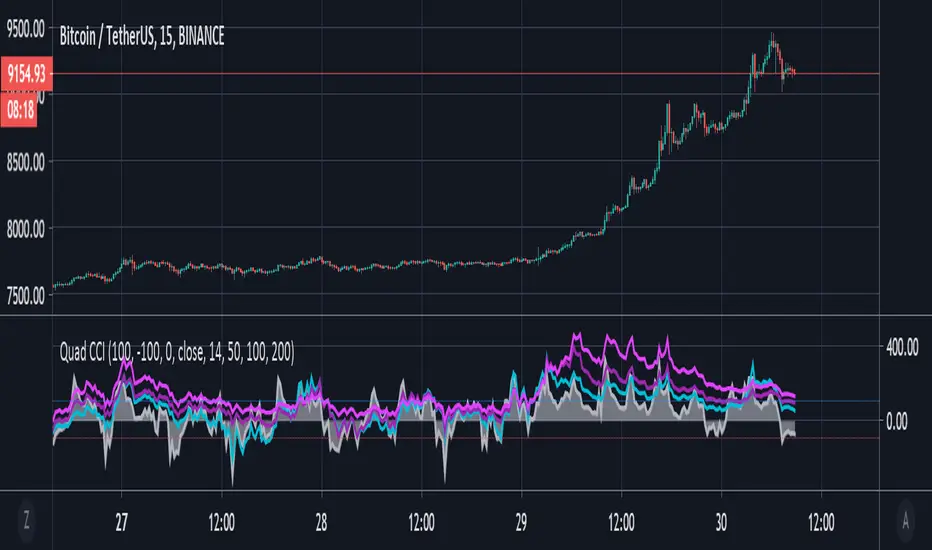
Quad CCI ContainmentThe Quad CCI is a trend identification indicator described by Mark Whistler in his book 'Volatility Illuminated'. The reason for using four separate CCI channels is so that we can:
Prevent ourselves from taking positions against momentum.
Time our trades with short-term 'wrist-rocket' thrust from the larger market momentum.
Clearly determine whether the trend is up, down, or sideways.
In his book, Whistler refers to four CCI channels as 'The Four Horsemen'. The 100 and 200 are like big burly swordsmen, which are hard to budge without significant force. The 50-period CCI is more like the guy who's fast on his feet, but still tough enough to take on the big dudes. And the 14-period is similar to the scout of the party. The fastest of the bunch, but also the first to turn-tail at any sign of danger.
Basically, this means that when we see the 100 and 200-CCI stay above the 0 line, we can infer there really isn't any reason for them to move out of their range. The 50-period CCI will sometimes venture over the 0-line, before the hefty battlers. However, the 14-period will often venture (quickly) way out into the yonder, and he will always return to tell his pals what he's found. Crossing back over the 100-line, traders can take 'rocket trend reentry' positions (usually on the median); however, we still want to keep an eye on the flighty 14-period CCI character. If he crosses back over the +100 or -100 level he was just scouting, it means the larger weighted CCI lines could soon to follow too, as the whole bunch runs from larger momentum on the way.
Traders seeking to take a position 'with the trend' can attempt to purchase pullbacks on the mean if:
Longer-term CCI (at least the 200 and 100) are above zero.
The 50-period CCI is not below -100.
The 14-period travels back up from underneath the -100 area.
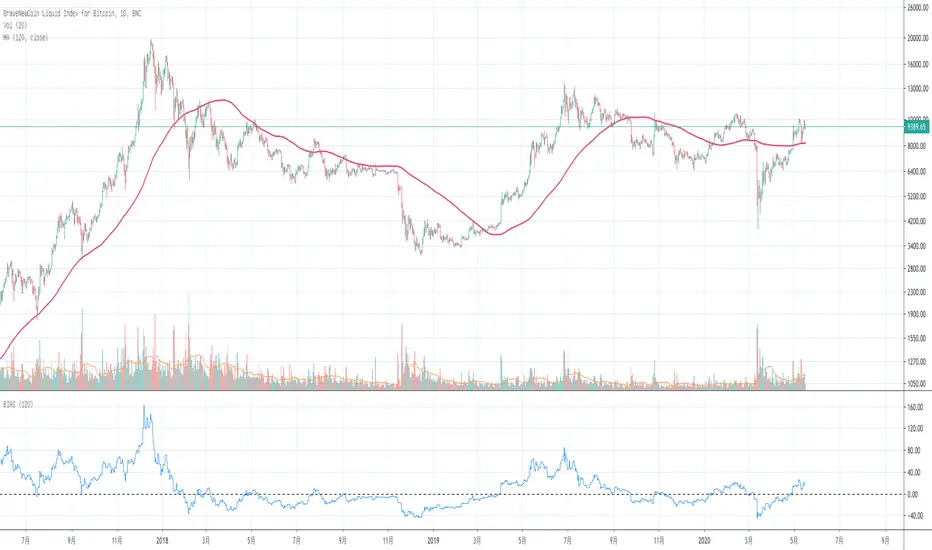
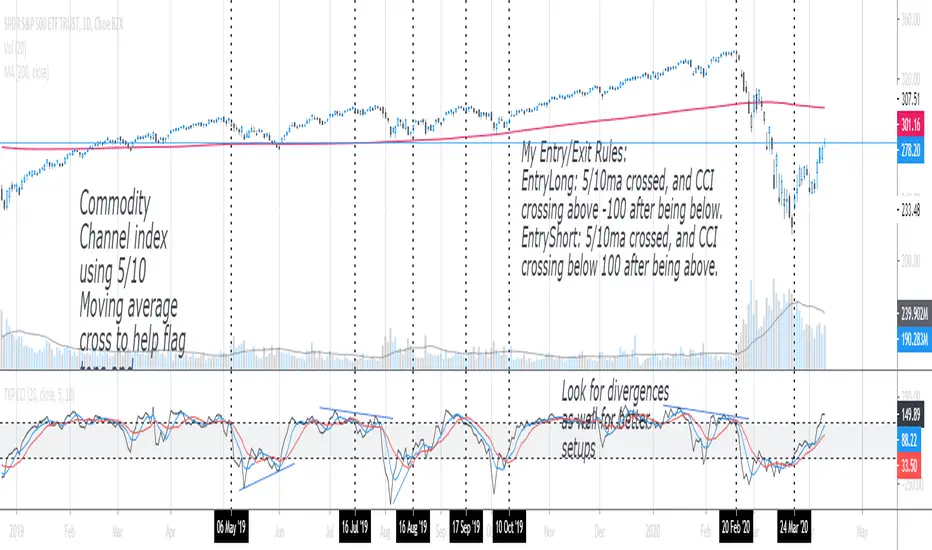
TKP Commodity Channel IndexThis indicator plots moving averages along CCI. This can help Identify trend and divergences in a smoother and less erratic way.
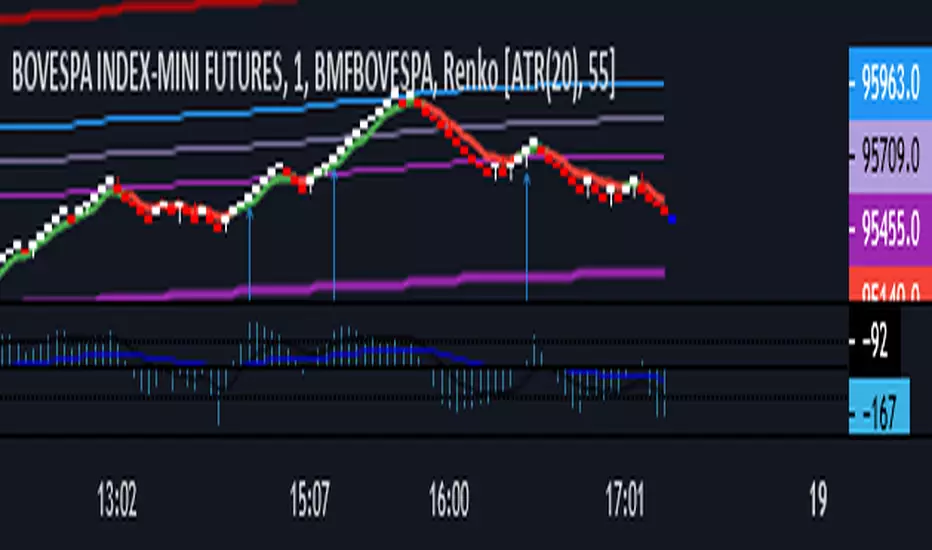
Point and Figure (PnF) CCIThis is live and non-repainting Point and Figure Chart Commodity Channel Index - CCI tool. The script has it’s own P&F engine and not using integrated function of Trading View.
Point and Figure method is over 150 years old. It consist of columns that represent filtered price movements. Time is not a factor on P&F chart but as you can see with this script P&F chart created on time chart.
P&F chart provide several advantages, some of them are filtering insignificant price movements and noise, focusing on important price movements and making support/resistance levels much easier to identify.
Commodity Channel Index – CCI was developed by Donalt Lambert. CCI can be used to identify overbought or oversold, a new trend or warn of extreme conditions. CCI measures the difference between a security's price change and its average price change. High positive readings indicate that prices are well above their average, which is a show of strength. Low negative readings indicate that prices are well below their average, which is a show of weakness.
The Formula for the Commodity Channel Index ( CCI ) Is:
CCI = (Typical Price – L-period SMA of TP) / (0.015 * Mean Deviation)
Mean Deviation = (SumOf 1->L ( |TP – MA| )) / L
L = Length
TP = Typical Price
If you are new to Point & Figure Chart then you better get some information about it before using this tool. There are very good web sites and books. Please PM me if you need help about resources.
Options in the Script
Box size is one of the most important part of Point and Figure Charting. Chart price movement sensitivity is determined by the Point and Figure scale. Large box sizes see little movement across a specific price region, small box sizes see greater price movement on P&F chart. There are four different box scaling with this tool: Traditional, Percentage, Dynamic (ATR), or User-Defined
4 different methods for Box size can be used in this tool.
User Defined: The box size is set by user. A larger box size will result in more filtered price movements and fewer reversals. A smaller box size will result in less filtered price movements and more reversals.
ATR: Box size is dynamically calculated by using ATR, default period is 20.
Percentage: uses box sizes that are a fixed percentage of the stock's price. If percentage is 1 and stock’s price is $100 then box size will be $1
Traditional: uses a predefined table of price ranges to determine what the box size should be.
Price Range Box Size
Under 0.25 0.0625
0.25 to 1.00 0.125
1.00 to 5.00 0.25
5.00 to 20.00 0.50
20.00 to 100 1.0
100 to 200 2.0
200 to 500 4.0
500 to 1000 5.0
1000 to 25000 50.0
25000 and up 500.0
Default value is “ATR”, you may use one of these scaling method that suits your trading strategy.
If ATR or Percentage is chosen then there is rounding algorithm according to mintick value of the security. For example if mintick value is 0.001 and box size (ATR/Percentage) is 0.00124 then box size becomes 0.001.
And also while using dynamic box size (ATR or Percentage), box size changes only when closing price changed.
Reversal : It is the number of boxes required to change from a column of Xs to a column of Os or from a column of Os to a column of Xs. Default value is 3 (most used). For example if you choose reversal = 2 then you get the chart similar to Renko chart.
Source: Closing price or High-Low prices can be chosen as data source for P&F charting.
Upper Band : as default, Upper band is 100
Lower Band : as default, Lower band is -100
There are alerts when P&F CCI moves above Upper Band or moves below Lower Band.

Commodity Channel Index MACD I've not seen any reprensentation of this type based on CCI chanel....
This indicator is an hybrid between CCI and MACD.
The CCI MACD line is calculated using a moving average between 2 CCI period a (FastCCI - SlowCCI) aplied on the (Fast + Slow) periods
The CCI signal line is a moving average of (CCI MACD line, on the signal line smoothing length.
The histogram is only the difference between the CCI MACD and CCI Signal line
//--------CODER--------//
R.V

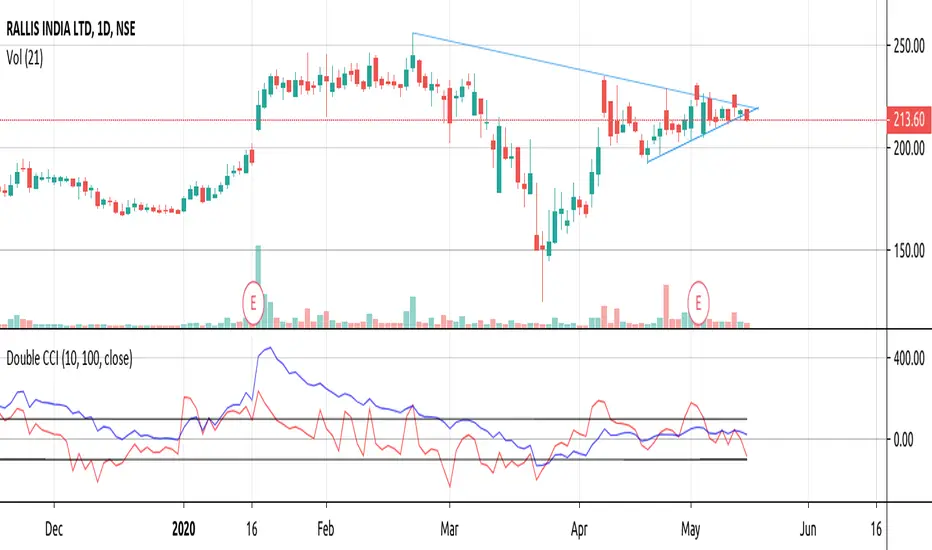
Double MA CCI"What is the Commodity Channel Index (CCI)?
Developed by Donald Lambert, the Commodity Channel Index (CCI) is a momentum-based oscillator used to help determine when an investment vehicle is reaching a condition of being overbought or oversold. It is also used to assess price trend direction and strength. This information allows traders to determine if they want to enter or exit a trade, refrain from taking a trade, or add to an existing position. In this way, the indicator can be used to provide trade signals when it acts in a certain way.
KEY TAKEAWAYS
• The CCI measures the difference between the current price and the historical average price.
• When the CCI is above zero it indicates the price is above the historic average. When CCI is below zero, the price is below the hsitoric average.
• High readings of 100 or above, for example, indicate the price is well above the historic average and the trend has been strong to the upside.
• Low readings below -100, for example, indicate the price is well below the historic average and the trend has been strong to the downside.
• Going from negative or near-zero readings to +100 can be used as a signal to watch for an emerging uptrend.
• Going from positive or near-zero readings to -100 may indicate an emerging downtrend.
• CCI is an unbounded indicator meaning it can go higher or lower indefinitely. For this reason, overbought and oversold levels are typically determined for each individual asset by looking at historical extreme CCI levels where the price reversed from." ----> 1
SOURCE
1: (SINCE IM NOT A "PRO" MEMBER I C'ANT POST THE SOUCRE URL..., webpage consulted at : 8:50 GMT -5 ; the 2020-01-18)
I- Added a 2nd MA length and changed the default values of the source type and switched the SMA to a MA.
II- In process to add analytic MACD histogram correlation and if possible, ploting a relative histogram between the CCI upper and lower band.
P.S.:
Don't set your moving averages lengths to far from each other... This could result in fewer convergence and divergence, also in fewer crossing MA's.
Have a good year 2020 !!
//----CODER----//
R.V.

BEST Supertrend CCIHello traders
Today I present you a Supertrend not based on candle close but based on a CCI (Commodity Channel Index)
How does it work?
Bull event: CCI crossing over the 0 line
Bear event: CCI crossing below the 0 line
When the event is triggered, the script will plot the Supertrend as follow
UP Trend = High + ATR * Factor
DOWN Trend = Low - ATR * Factor
This is an alternative of the classical Supertrend based on candle close being above/beyond the previous Supertrend level.
Hope you'll enjoy it and it will improve your trading making you a better trader
Dave

Commodity Channel Indexcci in trading view is based on close price but the real formula Developed by Donald Lambert is based on typical price so I modified a formula little bit , and the result now are little smoothed

CCI RiderThis is my thank you to the TradingView community, for the people who are sharing their scripts, which allowed me to learn Pine Script.
So here is my first creation, feel free to experiment, modify and use it as you wish.
It is a CCI(default value is 100, can be changed), combined with an EMA of that CCI(default 21,changeable) that then colors the background according to the strength of the signal(if selected to do so).
To generate strong signals, it also uses Bollinger Bands to prevent whipsaws in high volatility situations.
The best signals are generated when the CCI crosses the limits set by the user (default is 100/-100), and is above/belov its EMA.
Exit signals are indicated, when the CCI crosses its EMA.
Unfortunately in strong trends, this exit signal is sometimes premature, using a 3x resolution of the indicator will improve this, maybe I will implement this in a later version.
I use it mostly in 15min charts and higher, I found in shorter timeframes still a lot of whipsaws, maybe experimenting with different lengths and levels will improve this.
As the Indicator allows the user to experiment with different lenghts and levels, and the colors will change according the setting, I find it a nice tool to search for the best mixture for different securities and timeframes.
See below an example of a nice signal.
I do suggest to use it in combination with other indicators.

TSI CCI HullThis is TSI and CCI combined. The CCI is customized and is using HullMA, but the TSI is default TSI
For use with the HMAv420 indicator, to form trading strategy based on the 3 indicators.
Best as all 3 indicators used on 3 timeframes at once, ie 1m 5m 1H

Multi momentum indicatorScript contains couple momentum oscillators all in one pane
List of indicators:
RSI
Stochastic RSI
MACD
CCI
WaveTrend by LazyBear
MFI
Default active indicators are RSI and Stochastic RSI
Other indicators are disabled by default
RSI, StochRSI and MFI are modified to be bounded to range from 100 to -100. That's why overbought is 40 and 60 instead 70 and 80 while oversold -40 and -60 instead 30 and 20.
MACD and CCI as they are not bounded to 100 or 200 range, they are limited to 100 - -100 by default when activated (extras are simply hidden) but there is an option to show full indicator.
In settings there are couple more options like show crosses or show only histogram.
Default source for all indicators is close (except WaveTrend and MFI which use hlc3) and it could be changed but for all indicators.
There is an option for 2nd RSI which can be set for any timeframe and background calculated by Fibonacci levels.

EMA20 MA50 MA200 + T3-CCIEMA20 MA50 MA200 + T3-CCI
This combination of triple Moving Average and CCI is a strategy to be used in conjunction with Harmonical Patterns and Fibonacci Rations .
Heikin Ashi price can be used as the price source for the Moving Averages and the T3-CCI, instead of the real price.
Two instances of the indicator can be spawned to have both the triple MAs and the T3-CCI on the chart (L-Click on the Indicator > Move To > New Pane Below).
Alerts are available to warn of possible opportunities in the markets .
A single alert that can fire on both conditions can be set. It can also be used by other indicators, such as the Risk Management Wrapper .
Additional Technical Analysis is required to confirm the signals before opening a position.
This indicator is an update to MA50 EMA20 MA200 .

MS MONEY CCI SQUEEZEAbout
I have used this indicator to find many lucrative opportunities. This indicator takes the moving average of CCI in custom, volatility-specific conditions. CCI measures "overbought" in the red-shaded region and "Oversold" in the green-shaded region. The shaded regions do not constitute a buy/sell signal alone, the MS CCI Squeeze is best used when market conditions agree and is best used when the user has fundamental reasoning for "reversal-like" situations to align. The MS CCI Squeeze will soon have a synergistic partner called "MS RSI Squeeze" indicator that will look similar to help better measure volatility and strength trend.
About the Commodity Channel Index (CCI)
The commodity channel index (CCI) is an oscillator originally introduced by Donald Lambert in 1980. Since its introduction, the indicator has grown in popularity and is now a very common tool for traders in identifying cyclical trends not only in commodities, but also equities (stocks) and currency trading.
How to set an Alert
If the user wants to set an alert , click on one of the support/ resistance lines (black-dashed) near the zero mark. Clicking on the horizontal line above or below the zero line will populate a yellow arrow which will allow you to set alerts when wanted.
Please Read For Better Efficiency
When using this indicator, keep an eye out for harmonic patterns, both bullish and bearish head and shoulders patterns for "HIDDEN" breakout opportunities.
Please like, follow and share and I will continue building better indicators.

CCI Stochastic and a quick lesson on Scalping & Trading SystemsHello traders
Still on holidays but I don't and will never forget you <3
I realize more and more that you guys don't only want some indicators and learn about pinescript. You also want some guidance and get some mentors providing you with comprehensive and simple trading methods and tricks.
I'm against those posting many scripts a day that in the end will make you lose your money because they don't give you the methodology to use them
It might look nice on the charts but we're not here to do some painting.... but to improve our lifestyle right :)
The today indicator is based on an indicator that I used for scalping : Fxcodebase CCI Stochastic
A CCI stochastic is very reactive and allows us to take many scalps trades per day with a few pips/USD gain for each trade. I don't recommend novice traders to use it and I strongly recommend everyone reading my disclaimer below basically saying "I'm not a financial advisor, don't be dumb, stay safe"
(I also recommend the few scripts copy-pasters to read my disclaimer as well)
What's a novice trader, sir? Well... thanks for asking. A novice trader is any trader with less than 5 years of live trading experience
From a pinescript perspective, this script will be however interesting for everyone :)
How to use it?
The indicator gives 3 possible entries for Longs and Shorts:
- Arrows at Enter - Will give signals whenever the Stoch CCI will enter in the BUY/SELL zone
- Arrows at Exit - Will give signals whenever the Stoch CCI will exit the BUY/SELL zone
- Arrows at Center - Signals whenever the Stoch CCI will cross the mid-line (50)
All arrows have different colors because ... painting is cool and nice.... kidding.... it gives clearer and more readable signals on the chart (but painting sir...)
A possible trading method could be to use the 3 modes at the same time to get the maximum of opportunities.
The safer bet is to use the "Arrows at Exit" only mode but for those who want to accumulate more scalping positions, adding the "Arrows at Enter" mode is an option as well. In other words, you accumulate a few scalping positions whenever the Stoch CCI get in the BUY/SELL zone and will stop accumulating whenever it will exit the BUY/SELL zone
You can add a few extra positions whenever the Stoch CCI will cross the mid-line as it often translates in a trend continuation
Life hack
Very important note : (probably the most important gem I shared until now) The inputs set by default will have to be changed for your asset/timeframe and can't be generic for everything. You have to play with the inputs until the signals will make sense to you
The indicator/strategy with a unique configuration that you'll never check or update according to the market condition DOES NOT exit.
If you find such a tool and prove me that you're making constant gains with it over a year, please patent it and then show it to me as I'd like to study it to replicate :) But most likely this is a myth/unicorn
Who I am to say this? Well, I worked in a Bank with real traders and I have a good sense of what works and what will certainly not work
My guru said scalping crypto in 1 second timeframe was the way to get rich quick. Do you agree sir?
But in trading, this is not because you take the maximum of trades possible that your gains will increase. This is the contrary.
There is a strong and proven inverse correlation between the number of trades taken and how fast you'll burn your capital. A swing trader taking 2/3 trades a month is more likely to beat 99% of the scalpers out there trying to predict all market movements. (and I'm not even talking about how dangerous it is to scalp with leverage)
You're starting to know me a bit more right now. I prefer to tell you what you need to hear vs what you want to hear because the second option doesn't allow to stay in the game very long.
I might lose some futures clients along the way by saying that but for my own conscience and ethics, I prefer to warn about the true risks of trading and to select who you listen very carefully (the advice also works for me, if you feel what I said doesn't make sense, this is totally your right but I hope this is because I'm french and not because of the content ^^).
See you tomorrow for another indicator or idea
Love you all
Dave
____________________________________________________________
Be sure to hit the thumbs up. Building those indicators take a lot of time and likes are always rewarding for me :) (tips are accepted too)
- If you want to suggest some indicators that I can develop and share with the community, please use my personal TRELLO board
- I'm an officially approved PineEditor/LUA/MT4 approved mentor on codementor. You can request a coaching with me if you want and I'll teach you how to build kick-ass indicators and strategies
Jump on a 1 to 1 coaching with me
- You can also hire for a custom dev of your indicator/strategy/bot/chrome extension/python
Disclaimer:
Trading involves a high level of financial risk, and may not be appropriate because you may experience losses greater than your deposit. Leverage can be against you.
Do not trade with capital that you can not afford to lose. You must be aware and have a complete understanding of all the risks associated with the market and trading. We can not be held responsible for any loss you incur.
Trading also involves risks of gambling addiction.
Please notice I do not provide financial advice - my indicators, strategies, educational ideas are intended to provide only some source code for anyone interested in improving their trading
The proprietary indicators and strategies developed by Best Trading Indicator, the object of intellectual property rights are and remain the exclusive property of Best Trading Indicator, at the exclusion of images and videos and texts free of rights or provided by the Company or external legal or physical person.
No assignment of intellectual property rights is carried out through these Terms and Conditions.
Any total or partial reproduction, modification or use of these properties for any reason whatsoever is strictly prohibited without the express written authorization of the Company.

PriceDivergence (ps4)This script implements price divergence module using signals from several factors like:
RSI, RSI Stochastic, MACD, Volume MA, Accumulation/Distribution, Fisher Transform and CCI


Combo Strategy 123 Reversal & CCI This is combo strategies for get a cumulative signal.
First strategy
This System was created from the Book "How I Tripled My Money In The
Futures Market" by Ulf Jensen, Page 183. This is reverse type of strategies.
The strategy buys at market, if close price is higher than the previous close
during 2 days and the meaning of 9-days Stochastic Slow Oscillator is lower than 50.
The strategy sells at market, if close price is lower than the previous close price
during 2 days and the meaning of 9-days Stochastic Fast Oscillator is higher than 50.
Second strategy
The Commodity Channel Index (CCI) is best used with markets that display cyclical or
seasonal characteristics, and is formulated to detect the beginning and ending of these
cycles by incorporating a moving average together with a divisor that reflects both possible
and actual trading ranges. The final index measures the deviation from normal, which indicates
major changes in market trend.
To put it simply, the Commodity Channel Index (CCI) value shows how the instrument is trading
relative to its mean (average) price. When the CCI value is high, it means that the prices are
high compared to the average price; when the CCI value is down, it means that the prices are low
compared to the average price. The CCI value usually does not fall outside the -300 to 300 range
and, in fact, is usually in the -100 to 100 range.
WARNING:
- For purpose educate only
- This script to change bars colors.

Woodies CCI + CZ + SW indicatorsBased on
Changes:
- red bars removed and replaced by silver ones
- yellow bar (start of new trend) had been added
- more parameters can be set in settings dialogue (SW constants as well)