Range Breakout Statistics [Honestcowboy]
⯁ Overview
The Range Breakout Statistics uses a very simple system to detect ranges/consolidating markets. The principle is simple, it looks for areas where the slope of a moving average is flat compared to past values. If the moving average is flat for X amount of bars that's a range and it will draw a box.
The statistics part of the script is a bit more complicated. The aim of this script is to expand analysis of trading signals in a different way than a regular backtest. It also highlights the polyline tool, one of my favorite drawing tools on the tradingview platform.
⯁ Statistics Methods
The script has 2 different modes of analyzing a trading signals strength/robustness. It will do that for 2 signals native to the script.
Upper breakout: first price breakout at top of box, before max bars (100 bars by default)
Lower breakout: first price breakout at bottom of box, before max bars
The analysis methods themselves are straightforward and it should be possible for tradingview community to expand this type of analysis to other trading signals. This script is a demo for this analysis, yet some might still find the native signals helpful in their trading, that's why the script includes alerts for the 2 native signals. I've also added a setting to disable any data gathering, which makes script run faster if you want to automate it.
For both of the analysis methods it uses the same data, just with different calculations and drawing methods. The data set is all past price action reactions to the signals saved in a matrix. Below a chart for explaining this visually.
⯁ Method 1: Averages Projection
The idea behind this is that just showing all price action that happened after signal does not give actionable insights. It's more a spaghetti jumble mess of price action lines. So instead the script averages the data out using 3 different approaches, all selectable in the settings menu.
Geometric Average: useful as it accurately reflects compound returns over time, smoothing out the impact of large gains or losses. Accounts for volatility drift.
Arithmetic Average: a standard average calculation, can be misleading in trading due to volatility drift. It is the most basic form of averaging so I included it.
Median: useful as any big volatility huge moves after a signal does not really impact the mean as it's just the middle value of all values.
These averages are the 2 lines you will find in the middle of the projection. Having a clear difference between a lower break average and upper break average price reaction can signal significance of the trading signal instead of pure chaos.
Outside of this I also included calculations for the maximum and minimum values in the dataset. This is useful for seeing price reactions range to the signal, showing extreme losses or wins are possible. For this range I also included 2 matrices of highs and lows data. This makes it possible to draw a band between the range based on closing price and the one using high/low data.
Below is a visualisation of how the averages data is shown on chart.
⯁ Method 2: Equity Simulation
This method will feel closer to home for traders as it more closely resembles a backtest. It does not include any commissions however and also is just a visualisation of price reaction to a signal. This method will simulate what would happen if you would buy at the breakout point and hold the trade for X amount of bars. With 0 being sell at same bar close. To test robustness I've given the option to visualise Equity simulation not just for 1 simulation but a bunch of simulations.
On default settings it will draw the simulations for 0 bars holding all the way to 10 bars holding. The idea behind it is to check how stable the effect is, to have further confirmation of the significance of the signal. If price simulation line moves up on average for 0 bars all the way to 10 bars holding time that means the signal is steady.
Below is a visualisation of the Equity Simulation.
⯁ Signal filtering
For the boxes themselves where breakouts come from I've included a simple filter based on the size of the box in ATR or %. This will filter out all the boxes that are larger top to bottom than the ATR or % value you setup.
⯁ Coloring of Script
The script includes 5 color themes, each carefully created using color themes from the pantone color institute. There are no color settings or other visual settings in the script, the script themes are simple and always have colors that work well together. Equity simulation uses a gradient based on lightness to color the different lines so it's easier to differentiate them while still upper breaks having a different color than lower breaks.
This script is not created to be used in conjunction with other scripts, it will force you into a background color that matches the theme. It's purpose is a research tool for systematic trading, to analyse signals in more depth.
Metaverse color theme:
⯁ Conclusion
I hope this script will help traders get a deeper understanding of how different assets react to their assets. It should be possible to convert this script into other signals if you know how to code on the platform. It is my intention to make more publications that include this type of analysis. It is especially useful when dealing with signals that do not happen often enough, so a regular backtest is not enough to test their significance.
Consolidation-breakout

Range Finder [UAlgo]🔶 Description:
The "Range Finder " indicator aims at identifying and visualizing price ranges within a specified number of candles. By utilizing the Average True Range (ATR) indicator and Simple Moving Average (SMA), it detects potential breakout conditions and tracks consecutive candles that remain within the breakout range. This indicator offers flexibility by allowing users to customize settings such as range length, method for determining range breaks (based on either candle close or wick), and visualization options for displaying range breaks on the chart.
🔶 Key Features
Identifying Ranges: The Range Finder automatically adapts to the market by continuously evaluating the Average True Range (ATR) and its Simple Moving Average (SMA). This helps in dynamically adjusting the range based on market volatility.
Range Length: Users can specify the number of candles to be used for constructing the range via the "Range Length" input setting. This allows for customization based on trading strategies and preferences.
Range Break Method: The indicator offers the flexibility to choose between two methods for identifying range breaks. Users can select between "Close" or "Wick" based on their preference for using the closing price or the highs and lows (including wicks) of candles for defining the breakout.
Show Range Breaks: This option enables visual representation of range breaks on the chart. When activated, labels with the letter "B" will appear at the breakout point, colored according to the breakout direction (upward breakouts in the chosen up range color and downward breakouts in the chosen down range color).
Range Color Customization: The indicator provides the ability to personalize the visual appearance of the range by selecting preferred colors for ranges indicating potential upward and downward breakouts.
🔶 Disclaimer
It's important to understand that the Range Finder indicator is intended for informational purposes only and should not be solely relied upon for making trading decisions. Trading financial instruments involves inherent risks, and past performance is not necessarily indicative of future results.

TrendCylinder (Expo)█ Overview
The TrendCylinder is a dynamic trading indicator designed to capture trends and volatility in an asset's price. It provides a visualization of the current trend direction and upper and lower bands that adapt to volatility changes. By using this indicator, traders can identify potential breakouts or support and resistance levels. While also gauging the volatility to generate trading ranges. The indicator is a comprehensive tool for traders navigating various market conditions by providing a sophisticated blend of trend-following and volatility-based metrics.
█ How It Works
Trend Line: The trend line is constructed using the closing prices with the influence of volatility metrics. The trend line reacts to sudden price changes based on the trend factor and step settings.
Upper & Lower Bands: These bands are not static; they are dynamically adjusted with the calculated standard deviation and Average True Range (ATR) metrics to offer a more flexible, real-world representation of potential price movements, offering an idea of the market's likely trading range.
█ How to Use
Identifying Trends
The trend line can be used to identify the current market trend. If the price is above the trend line, it indicates a bullish trend. Conversely, if the price is below the trend line, it indicates a bearish trend.
Dynamic Support and Resistance
The upper and lower bands (including the trend line) dynamically change with market volatility, acting as moving targets of support and resistance. This helps set up stop-loss or take-profit levels with a higher degree of accuracy.
Breakout vs. Reversion Strategies
Price movements beyond the bands could signify strong trends, making it ideal for breakout strategies.
Fakeouts
If the price touches one of the bands and reverses direction, it could be a fakeout. Traders may choose to trade against the breakout in such scenarios.
█ Settings
Volatility Period: Defines the look-back period for calculating volatility. Higher values adapt the bands more slowly, whereas lower values adapt them more quickly.
Trend Factor: Adjusts the sensitivity of the trend line. Higher values produce a smoother line, while lower values make it more reactive to price changes.
Trend Step: Controls the pace at which the trend line adjusts to sudden price movements. Higher values lead to a slower adjustment and a smoother line, while lower values result in quicker adjustments.
-----------------
Disclaimer
The information contained in my Scripts/Indicators/Ideas/Algos/Systems does not constitute financial advice or a solicitation to buy or sell any securities of any type. I will not accept liability for any loss or damage, including without limitation any loss of profit, which may arise directly or indirectly from the use of or reliance on such information.
All investments involve risk, and the past performance of a security, industry, sector, market, financial product, trading strategy, backtest, or individual's trading does not guarantee future results or returns. Investors are fully responsible for any investment decisions they make. Such decisions should be based solely on an evaluation of their financial circumstances, investment objectives, risk tolerance, and liquidity needs.
My Scripts/Indicators/Ideas/Algos/Systems are only for educational purposes!

Consolidation Spotter Multi Time FrameThis tool is designed for traders looking to spot areas of consolidation on their charts across various time frames. It highlights these consolidation areas using visually appealing boxes, making it easier to identify potential breakout or breakdown zones.
How To Use:
Spotting Consolidation: When you see a box form on your chart, this represents a consolidation zone. Within this zone, the price is moving sideways without a strong upward or downward trend.
Anticipating Breakouts & Breakdowns: Watch the price as it approaches the edges of the box. A movement outside the box can signal a potential breakout (if above the box) or a breakdown (if below the box). This is where momentum shifts can happen.
Momentum Confirmation: Once the price clearly moves out of the box, it indicates a momentum shift. If the price moves upwards out of the box, this can be seen as bullish momentum. Conversely, if the price moves downwards out of the box, this can be seen as bearish momentum.
To use the tool effectively, adjust the settings to suit your trading style, choose your preferred visual theme, and watch as the script highlights key consolidation areas on your chart.
Tip: To visualize fractals, consider using multiple instances of the "Consolidation Spotter" indicator, each set to a different timeframe. This approach allows you to observe consolidations nested within larger consolidations, offering deeper insights into market structures. 😉

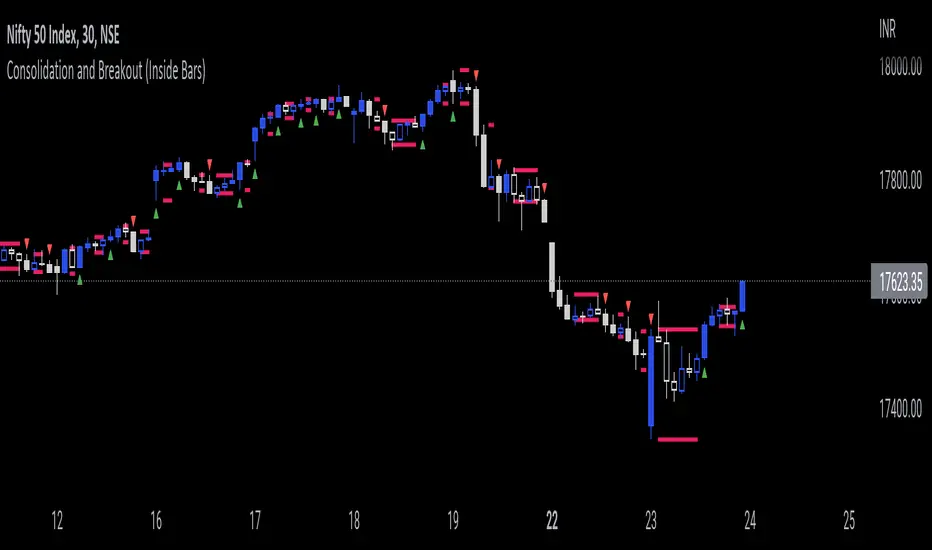
Consolidation and Breakout (Inside Bars)Consolidation indicates moments of market indecision when there is no shift in price. It is neither positive nor negative. Usually, after a price burst or strong trend movement that market falls back into a phase when traders are cautious about possible overbought or oversold positions. During this period, market reconciles before another breakout or trend emerges. Once you have identified consolidation, the next step is to keep an eye on a possible breakout.
This indicator would be useful for Breakout traders.
A candle's high and low is marked and if consequent candle fails to close above or below the marked candle, it's considered as an inside bar.
This can help breakout traders in tackling fakeouts since the wick above or below the initial candle are neglected and only the candle close above or below the range are considered as breakout.
MM Chop FilterBased On the "Chop and explode Indicator by fhenry0331
We Updated to Pine 5
- Added break out alerts and Signals
-Customize thresholds
How To use
when the line is blue confirmed Buy
Line is Red confirmed Sell
ALWAYS use in confirmation with your strategy and Trade with the trend.
Match with the on chart version for best results

Three Week Tight Pattern IndicatorThree Week Tight Pattern is a consolidation indicator which give extra buy point on strong fundamental stocks. You can read about it from IBD here: www.investors.com

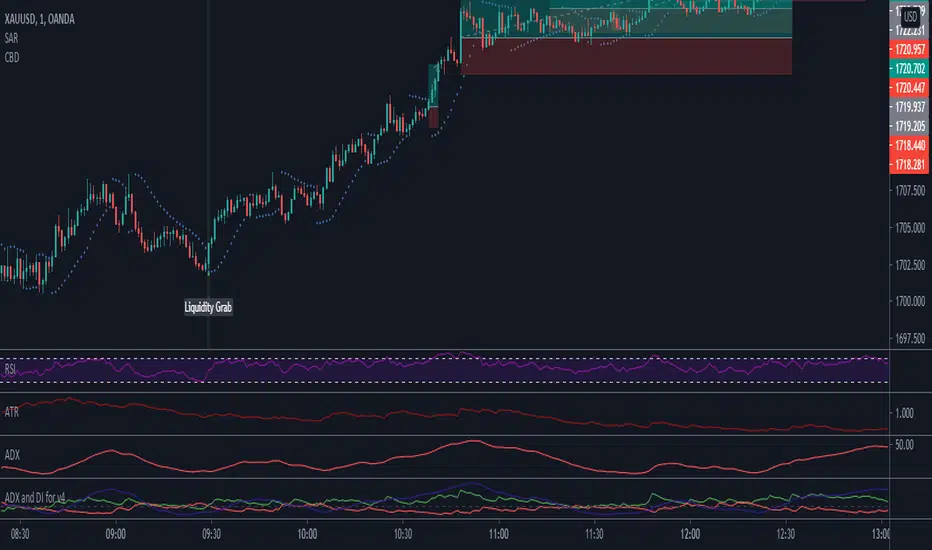
Combo Breaker DetectionA method I'm playing with to detect liquidity grabs and breaks from consolidation.
Consolidation Ranges [kingthies] Consolidation Range Analysis
Published by Eric Thies, January 2021
█ Indicator Summary
This tool calculates, analyzes and plots the visualization of a relative range over a given period of time
By adding to charts, users are enabled to see the impulsive nature of market cycles, along with their efforts to consolidate thereafter
The default period is 30, and should be adjusted to users preference
The default input is the current close price, on the chosen timeframe of the chart
█ Script Source
//
//@version=4
//© kingthies || This source code is subject to the terms of the Mozilla Public License 2.0 at mozilla.org
study("Consolidation Ranges ", shorttitle="CR ", overlay=true)
// !<------ User Inputs ----->
src = input(close, title='Range Input (Default set to Close'), lengthEMA=input(30,title='Length'),zoneToggle = input(true, title="Toggle Zone Highlights"), iCol = color.new(#FFFFFF, 100),
// !<---- Declarations & Calculations ---- >
trndUp = float(na),trndDwn = float(na), mid = float(na), e = ema(src, lengthEMA)
trndUp := src < nz(trndUp ) and src > trndDwn ? nz(trndUp ) : high, trndDwn := src < nz(trndUp ) and src > trndDwn ? nz(trndDwn ) : low, mid := avg(trndUp, trndDwn)
// !< ---- Plotting ----->
highRange = plot(trndUp == nz(trndUp ) ? trndUp : na, color=color.white, linewidth=2, style=plot.style_linebr, title="Top of Period Range")
lowRange = plot(trndDwn == nz(trndDwn ) ? trndDwn : na, color=color.white, linewidth=2, style=plot.style_linebr, title="Bottom of Period Range")
xzone = plot(zoneToggle ? src > e ? trndDwn : trndUp : na, color=iCol, style=plot.style_circles, linewidth=0, editable=false)
fill(highRange, xzone, color=color.lime,transp=70), fill(xzone, lowRange, color=color.red,transp=70)
//

Consolidation Zones - LiveHello Traders!
This is the script that finds Consolidation Zones in Realtime.
How it works?
- The script finds highest/lowest bars by using "Loopback Period"
- Then it calculates direction
- By using the direction and highest/lowest bar info it calculates consolidation zones in realtime
- If the length of consolidation area is equal/greater than user-defined min length then this area is shown as consolidation zone
- Then Consolidation Zone extends automatically if there is no breakout
if you increase the Loopback Length then you get bigger consolidation zones:
You have option to "Paint Consolidation Area" or not:
Enjoy!

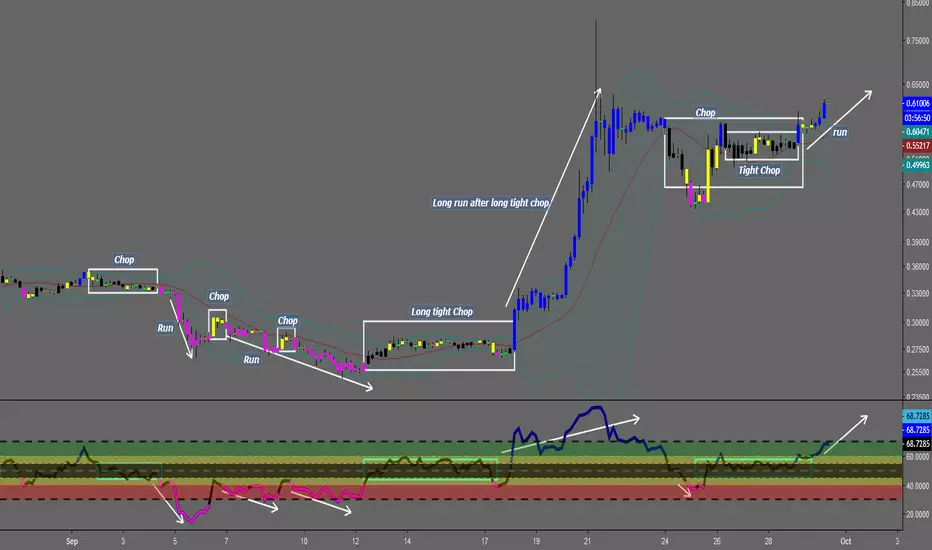
Chop and explodeThe purpose of this script is to decipher chop zones from runs/movement/explosion
The chop is RSI movement between 40 and 60
tight chop is RSI movement between 45 and 55. There should be an explosion after RSI breaks through 60 (long) or 40 (short). Tight chop bars are colored black, a series of black bars is tight consolidation and should explode imminently. The longer the chop the longer the explosion will go for. tighter the better.
Loose chop (whip saw/yellow bars) will range between 40 and 60.
the move begins with blue bars for long and purple bars for short.
Couple it with your trading system to help stay out of chop and enter when there is movement. Use with "Simple Trender."
Best of luck in all you do. Get money.