Correlative volume sum CTEHello colleagues, How much importance do you give to the volume traded in the candles to support your investments? And if it is important, you analyze the volume of the candle in the assets or correlated pairs to be certain if it is a volume of only that broker or of several?
I would like to share and collaborate with a tool that can help to see the expanded volume, appending the accumulation of the volume traded from up to 3 brokers or exchanges.
I hope this tool is helpful and allows you to make your investments with greater security.
Many times we focus and analyze a single graph, discarding very relevant details present in the correlative graphs, such as the volume between them.
A good way to complement your strategy is to wait for a volume reaction in the historical volume candlestick zones.
I am happy to be part of this community and I hope that my presence in it will be of help, greetings to all.
Correlation

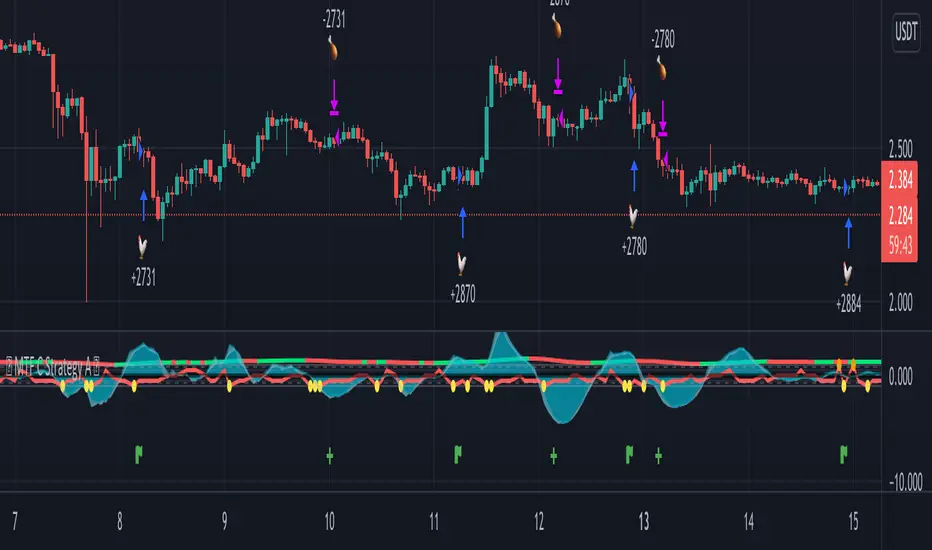
MTF C Strategy A
The Pearson coefficient is a type of correlation coefficient that represents the relationship between two variables that are measured on the same interval or ratio scale. It's a measure of the strength of the association between two continuous variables.
This script allows you to choose one or more sources as a curve, if several sources are chosen, their average is taken into account in an EMA or SMA of your choice. It is possible to have the average of all the curves and to add one or more other curves for an influence on the calculated average.
Then, on the basis of this curve a correlation is calculated from 8 time ranges which give 4 curves, it is on this basis that the conditions of entries in the trade and / or exits are based with the possibility of adding an RSI condition.
For some entries, it is possible to try the symmetrically opposite condition, ie the one that is used in shorts.
To make entry short work, you must activate an exit short option.
However, exit conditions are more flexible than entry conditions because they allow the inverse entry condition used and / or to use statistical indices such as CCI / RSI / ROC / BB as exit condition independently or combined way.
It should be noted that if a condition among those chosen is executed substantially first, it will predominate over the others (same for long / short entries).
In addition, it is possible to choose a stop loss as an exit condition, however, it is not possible to combine the other exit conditions with the stoploss at the same time. Credits to adolgov for the base of the stoploss script part.
You can combine several curves, just as it is possible to combine several types of trade entries / exits.
The strategy uses 100% of equity, it has not been configured in such a way that there is an order pyramid and the closings are done on a total equity basis.
You can configure a daily session interval, a limit of the number of daily trades, a limit of drawdown.
You can add comments for each execution of an opening / closing order respectively to the direction (long or short).
Each step of the configuration has a tip, a button that must be hovered over in order to have the information relating to the configuration.
QuantAnna: Nifty VIX CorrelationNSE:NIFTY
Simple correlation indicator which oscillates around zero
Shows default correlation with NSE:IndiaVix
You can use it to check correlation with any other trading symbol or indices by simply selecting it in the settings.

Crypto swing correlation RSI and SMAThis is a crypto swing strategy, designed for long term periods and correlated pairs with crypto market total(or other coins used as correlation, however I recommend total of crypto or btc)
Its components are:
RSI with a very length
Correlation candles
SMA 9
Rules for entry:
For long : RSI is above 51 level and going higher and close of the candle is above the SMA
For short :RSI is below 49 and going lower and close of the candle is below the SMA
Rules for exit:
We exit when we encountered an opposite condition than the entry one, or based on take profit/stop loss levels.
If you have any questions let me know !

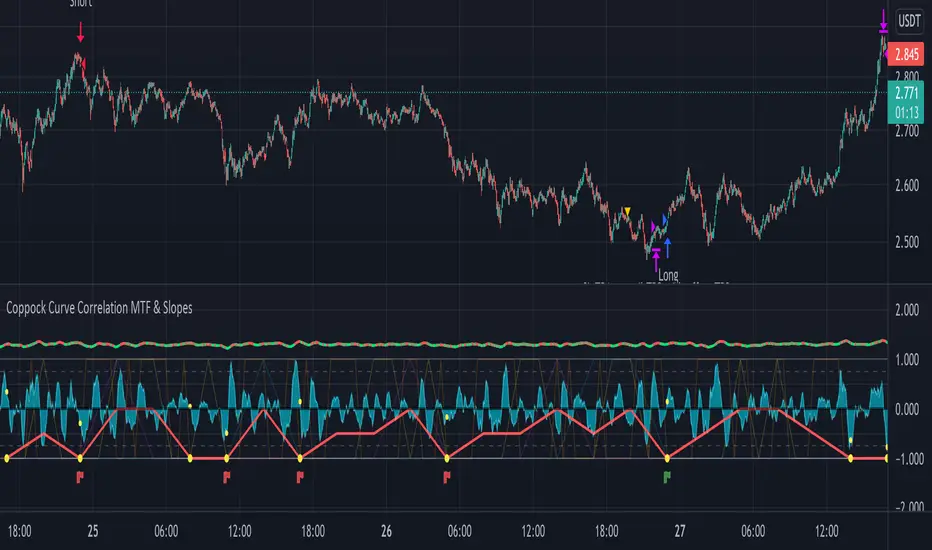
Coppock Curve Correlation MTF & Slopes - Long Strategy- This strategy is based on the Coppock Curve Correlation MTF & Slopes tool
- Condition for entry is very simple :
-> If the correlation of 8 timeframes expressed by 4 curves reaches 1 or -1
-> and the Coppock curve and the Coppock Slope (on 3 periodes back) are rising => then entry.
(You can also visually look at : orange/yellow dot on the slope wave and green flag).
- There's the possibility to trail stop loss and multiple take profit levels.
- Back testing period setting.
- I've added the possibility to extend the lookback period of the correlation for the curves.
- Results could be interesting with a well managed trailing stop loss / take profit and trading on higher time frames.
Market spot - ADA/USDT
Timeframe = 3min
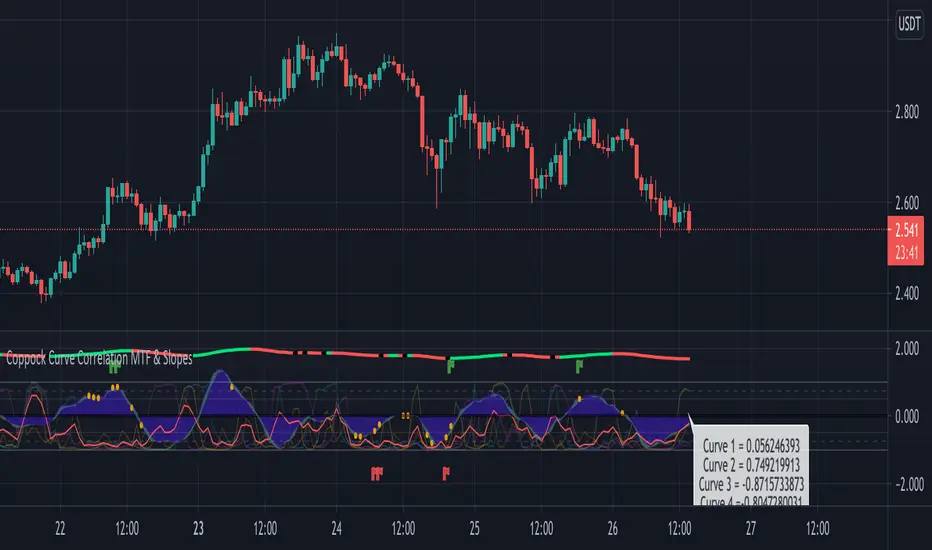
Coppock Curve Correlation between MTF & SlopesMy first tool !
1. The waves shows the slope of the curve. The front one = 3 periods, back one = 2 periods, difference = white area.
2. The moving lines shows the curve correlation between 2x 2 time frames (adjustable on the settings) on 2 periods lookback.
2.1 Theres few regions of high correlation, lines are at (absolute values) 0.5, 0.75, 1
3. On the top there's the Coppock curve -> if falling since 1 period = red, else green.
4. Diamonds shows : if correlation is in the strong correlation area and slope is falling or rising : red or green diamond.
This tool could be interesting to have an idea if there's strong correlation between timeframes instead of watching 4-5 different timeframes !
RSI CCI Correlating Oscillator (RCCO) by empowerTRCCO is pronounced "ree-koh" or "rico".
The RCCO is simply the plot of the values of both the RSI and CCI added together.
The RCCO makes some adjustments though, so that both the RSI and the CCI will fit correctly on the same scale - and so that these adjustments for scale allow reversals to be detected at crossings.
When the CCI crosses from underneath to up above the RSI, this is usually a bullish reversal. Alternatively, when the CCI crosses from above to back under the RSI, that usually signals a bearish trend. Look for the widest swings you can find to ensure good momentum. The larger the volume, the clearer and more decisive the trends. Low volume will lead to ranging and lazy momentum. High volume will create clear and forceful trends. The lowest negative RCCO in a timeframe, and then add some high volume... and you have yourself a good setup for a successful trade.
Because the RSI and CCI are adjusted, you may not recognize their values from having used the respective indicators on their own. The RSI and CCI values are less important. What matters with this indicator are the crossings and the RCCO value. The RCCO value should be negative, preferably, a deeply negative value. Look at the historical chart for the target per your selected timeframe and decide what values work for you.
I hope you enjoy the RCCO and that it can help you become a little más RICO!

BTC Sentiment analysis RSI 2xEMAThis is a CRYPTO correlation strategy, which is using BTC sentiment with BITFINEX long and short ratios.
WIth them we are making from one side 2 RSI, one for long and another for short. And from another side, we are going to make multiple EMA's, using the ratios for long and short.
Rules for entry
For this scenario I created a long only strategy.
The long entry condition is : we have a crossover of the rsi long ratio with rsi short ratio and long ratio from BITFINEX is above the long EMA and short ratio from BITFINEX is below short EMA.
We exit when we get the opposite condition, in this case we have a crossunder of the rsi long ratio with rsi short ratio and long ratio from BITFINEX is below the long EMA and short ratio from BITFINEX is above short EMA.
If you have any questions, let me know !

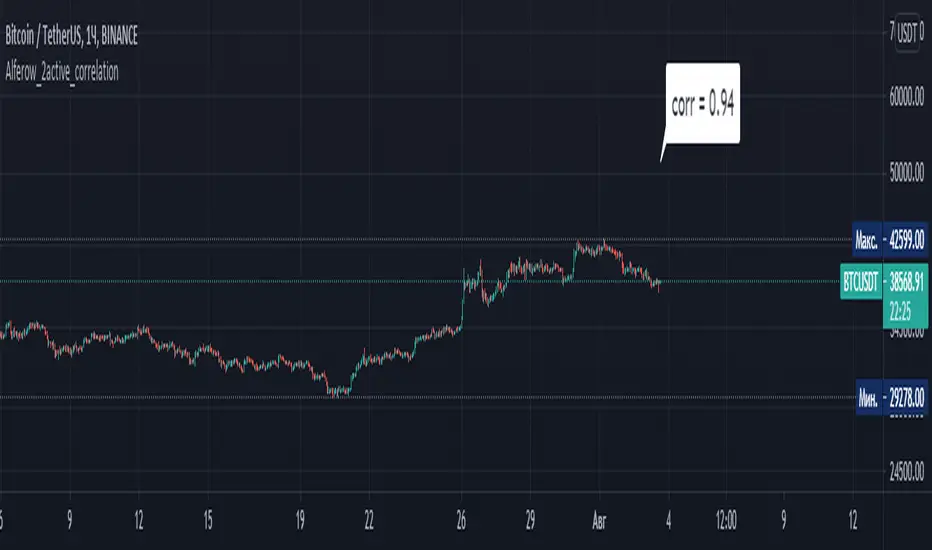
Alferow_2active_correlationAn indicator showing the coefficient of linear correlation between two assets for the selected period. As the initial data, the following are set: the indicator of the candle, according to which the calculation is made (maximum, minimum, closing or opening); the period for analysis; two assets between which the correlation is considered. The output is a label with the value of the correlation coefficient.
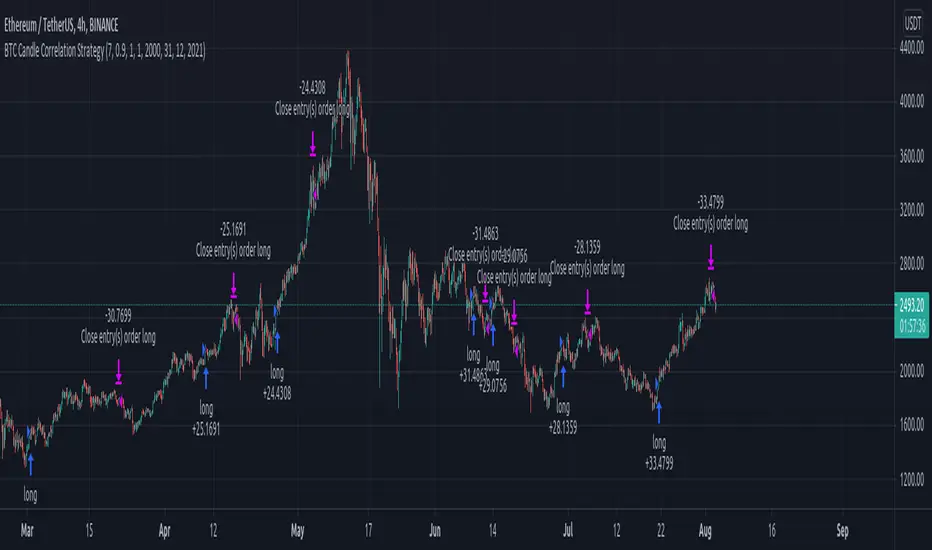
BTC Candle Correlation Strategy This is a special strategy adapted for crypto market, which instead of using the current chart candles, we use inside calculation a candle from different charts.
For best usage I recommend a big timeframe like 1-4h+.
In this case we take the high, low, open and close candles from different brokers for BTC, and with it we form up the candle that we are going to use for the logic of entry.
At the same time we are going to create an upper and lower bands using a moving average and the difference between high and low.
So in a way to put it, if BTC triggers a sell or buy order, we input instead these orders on the current chart, like in this example with ETH.
Rules for entry
For long : if we have a crossover of the btc source value with the upper band .
For short: if we have a crossunder of the btc source vale with the lower band.
For exit, we do it when we receive a different signal than the initial one.
This strategy does not have any other risk management inside, so use it with caution.
If you have any other questions, let me know !
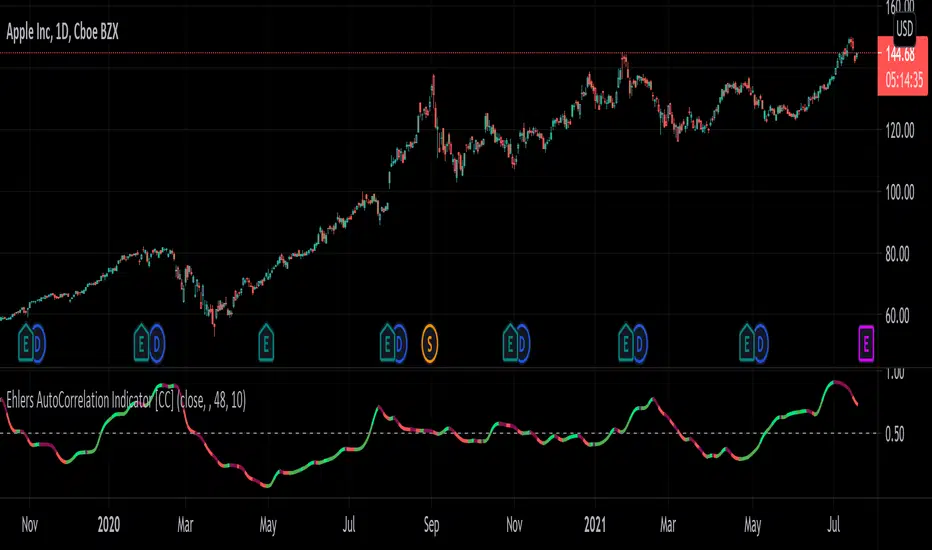
Ehlers AutoCorrelation Indicator [CC]The AutoCorrelation Indicator was created by John Ehlers (Cycle Analytics pgs 94-98) and this can be viewed as both a momentum indicator and a trend indicator. This was his basis for several other indicators that he created which I will be publishing soon but essentially as this indicator goes up then the stock is in an uptrend and also has upward momentum. You will notice that this indicator starts to go down even during an uptrend showing that the underlying trend is going to have an upcoming reversal. He also warns that the halfway mark is a possible reversal point so keep an eye out for that.
Generally speaking a good signal is to enter a long position when the indicator is under the midline and is starting to go up (or when the line is green) and to exit the position when the indicator goes over the midline. I have included strong buy and sell signals in addition to normal ones so darker colors mean strong signals and lighter colors mean normal signals.
Let me know if there are any other indicators you would like me to publish!
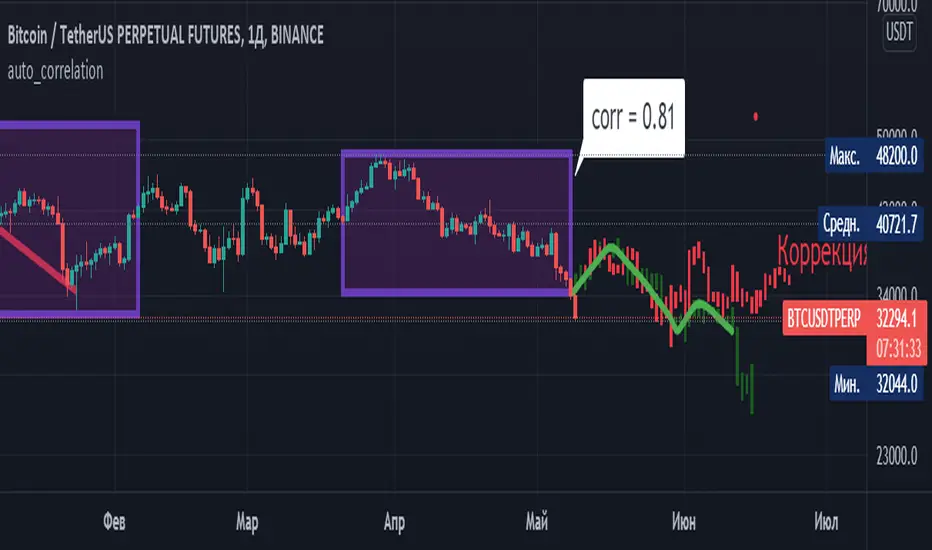
Auto_Corr_DailyThis indicator shows the Pearson correlation coefficient between different periods of one financial instrument. Two dates are set, which are the starting points of two series, between which the correlation coefficient is calculated. The correlation period is taken from the difference of the current date from the second reference point. The indicator is designed to analyze the correlation only on the 1D timeframe.
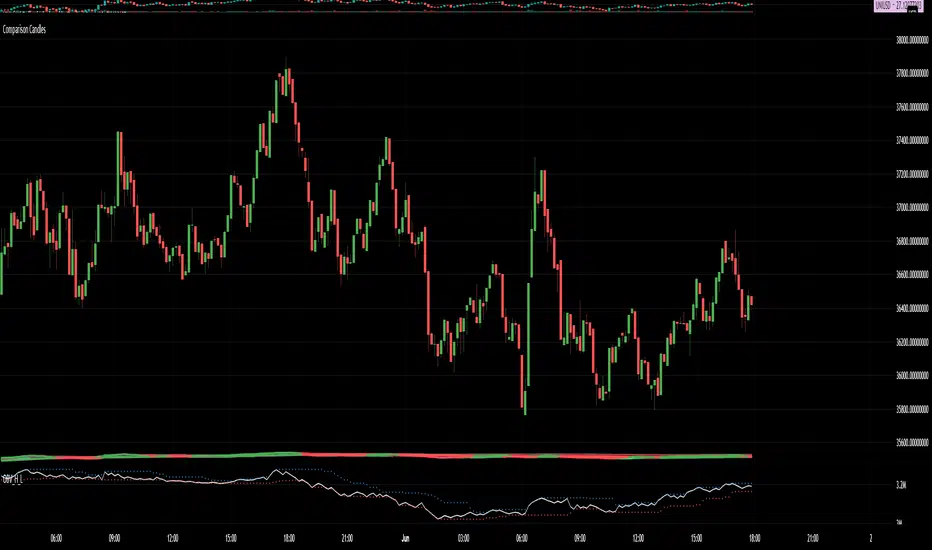
Comparison CandlesPretty simple. Pick a security and it plots candlesticks to compare it to the current chart.
So if looking at CAKEBTC and comparing to UNIBTC, you get CAKEUNI.
Beats the hell out of plotting multiple plots and trying to compare them. No longer is your scale based on where your zoom starts.
Also allows you to draw oscillators from the plots.
Shown is my Uber RSI plotted on the comparison candles close on CAKEUNI (binance both).
No longer struggle to chart against messed up uniswap charts because your exchange of choice isn't listed on tradingview.
No longer struggle to chart ethereum pairs that don't exist on any of the exchanges supported officially by Tradingview charting.
"You just win."

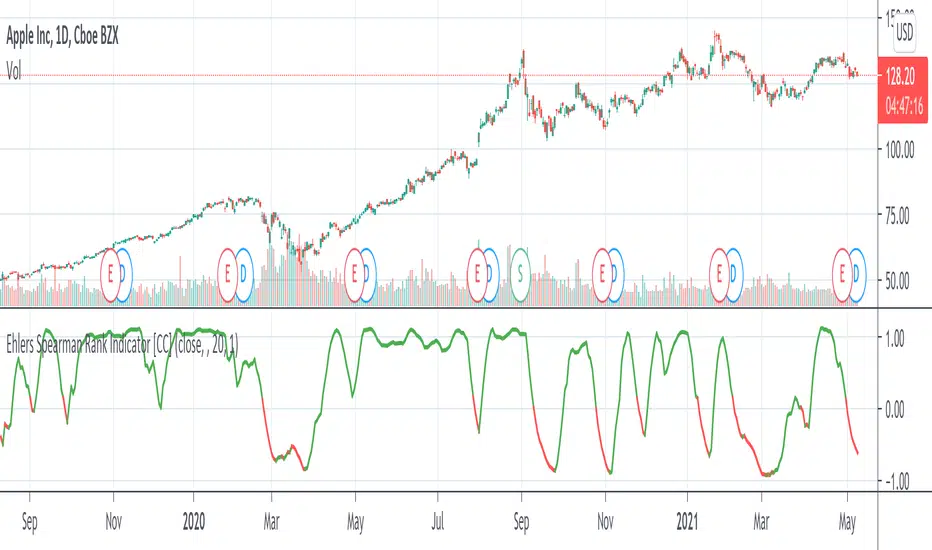
Ehlers Spearman Rank Indicator [CC]The Spearman Rank Indicator was created by John Ehlers (Stocks and Commodities July 2020 pg 6) and this works well as a trend confirmation indicator. This is obviously his take on the Spearman Ranking Correlation and make sure to let me know what you think! Buy when the line turns green and sell when it turns red.
Let me know if there are any other indicators you want me to publish!
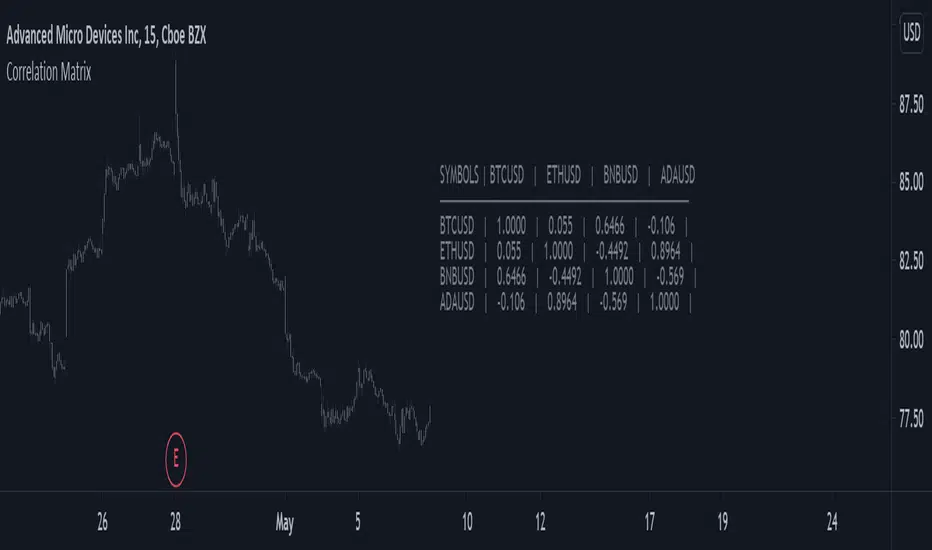
Correlation MatrixReturns a 4x4 correlation matrix between various user-selected symbols. Users can change the window of the correlation with the setting length .
Correlation matrices can be useful to see the linear relationship between various symbols, this is an important tool for diversification.
Correlation overlayThe script is intended to indicate when the correlation between VIX and VVIX gets below 0, on the selecteted security chart. It makes sense to plot it on indicies. This aims to present how the chart of a security looked like when the divergance between VIX and VVIX happened.

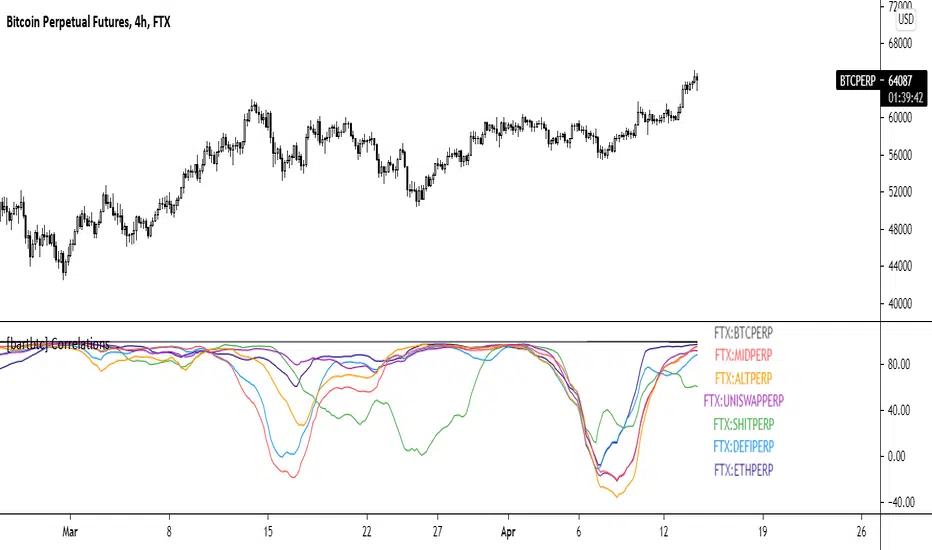
Correlations [bartbtc] - This script tracks the rolling correlation between a basket of different assets over the last 50 bars on the current timeframe.
- By default, it tracks the correlation of FTX basket indexes with BTC (you can customise by changing the the assets in settings)
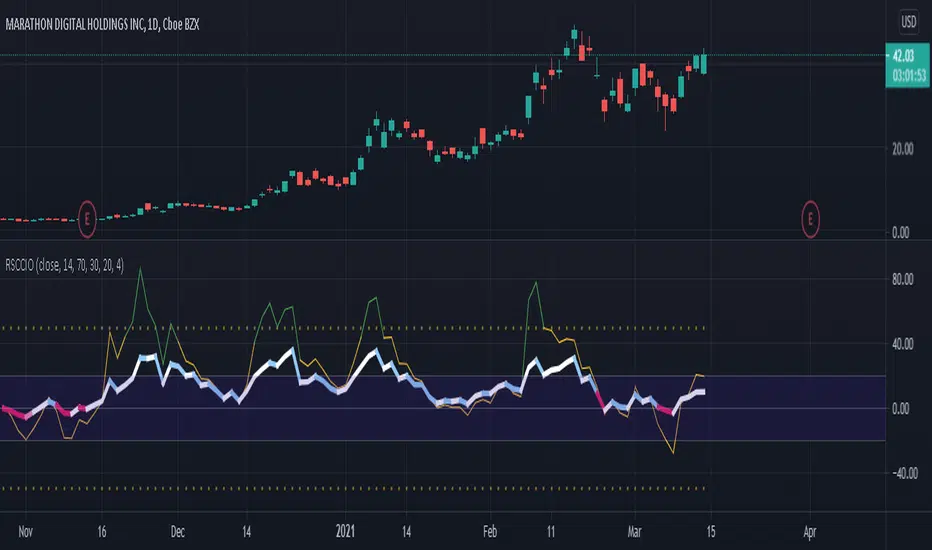
[SK] RSI/CCI Correlating OscillatorThe combination of RSI and CCI can be a powerful tool to efficiently signal the strength of the trend and upcoming reversals.
The magic comes when you're able to correlate both indicators correctly, this is the power I give you with the RSCCIO.
I've added additional features to each indicator that make signals more clear and easier to identify.
On the RSI
Directional color coding similar to what you can find on a MACD. This helps to identify the general trend ( above or below midline ) and the of the movement within.
For precise correlation the RSI is adjusted to a midline of 0. You can still enter the overbought/oversold levels as you'd expect on a regular RSI and it will be automatically adjusted.
On the CCI
Extreme strength / weakness color coding when the value exceeds the range makes signals more clear.
For precise correlation with the RSI, we need to scale down the value of the CCI with the Sensitivity Input. The default value works overall but feel free to play around to adjust the scale of the CCI movement.
---
RSI Relative Strength Index
The RSI is a momentum indicator that measures the magnitude of recent price changes. An asset is usually considered overbought when the RSI is above 70% and oversold when it is below 30%.
CCI Commodity Channel Index
The CCI was originally developed to spot trend changes. Use the CCI on the longer-term chart to establish the dominant trend and on the shorter-term chart to isolate pullbacks and generate trade signals.
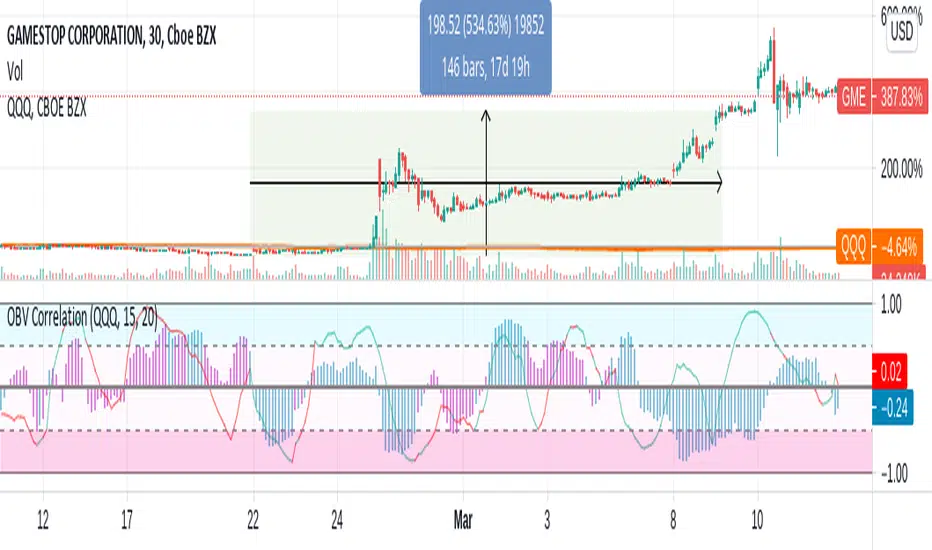
OBV Correlation [Fournier-Eaton]This is the On Balance Volume Correlation (And Price Correlation) Indicator. Directions of each has been encoded with color.
This Indicator is one of a series of scripts which I hope will aid in volume analysis.
The primary component is the histogram plot which represents the correlation between the direction of obv of your current equity and your chosen reference equity.
I have included the direction of OBV for your currently plotted equity encoded as color. (Thus you know that if the plot is negative and blue, that the correlation is negative but the OBV for your current equity is increasing.)
Furthermore, I included a supplementary price correlation line for the given equities. This line has had price direction encoded as color for quick reference.
Thus as a quick example: if you see a blue negative histogram and an accompanying red positive line you know that: 1. obv is increasing and anti-correlated with your reference equity and the price is decreasing and positively correlated with your reference equity. A lot of information encoded in one plot.
If you find this at all useful, I'd love to hear from you.
Bradford Fournier-Eaton, PhD
MOVE/VXTLT CorrelationMany know of the VIX for equity trading. Yet, many are unaware that there is the same kind of volatility measure for trading bonds, called the MOVE Index.
"The Merrill Lynch Option Volatility Estimate (MOVE) Index is a yield curve weighted index of the normalized implied volatility on 1-month Treasury options which are weighted on the 2, 5, 10, and 30 year contracts."
With this script one can see the the correlation and divergences between bonds and its volatility measure to make educated decisions in trading or hedging.
The idea of this script comes from NicTheMajestic.

Volume Correlation Indicator [Fournier-Eaton]This script combines two correlation indicators into one:
Volume Oscillator Correlation
Price Correlation
Rationale : This script is predicated on the following premise: we rely often on price correlation. However, we overlook volume-volume correlation too often. The volumetric correlative decoupling of an equity and index or equity - equity can yield important information (and produce it as early or earlier than price-correlation).
Mechanism :
The primary component of this chart is the Volume Correlation Indicator (as red histogram). This is the correlation between the Volume Oscillator of current chart's symbol and the VO of your chosen comparison.
Secondarily, the standard price correlation is also charted for added information in line format.
Example : In the chart attached to this publication, note the following cases:
Case 1: The price correlation with QQQ was increasing as earnings approached. However, the volume correlation with QQQ was clearly decoupled as earnings approached.
Case 2: Contrastingly, other dips in price correlation can be found were volume correlations were behaving in tandem.
Note1: This is the first in a series of volume correlation indicators. Please let me know if you find this useful.

Correlation MeterThis script calculates the covariance and correlation coefficient between two markets using arrays.
Lookback: How many bars to perform the calculation on.
Source: Price source to calculate the correlation on.
Reference Market: The reference market to compare to the current market.
It's a simple indicator, but very useful for determining how correlated your preferred markets to trade are.
A correlation reading of +1.0 means the markets are perfectly positively correlated, a reading of -1.0 means they are perfectly negatively correlated.
If you're not sure what correlation & covariance are then Google the terms with "Investopedia" added to the end - they have some great definitions and examples.
For traders this can be useful for deciding how much risk to spread across two markets that have a high correlation, or how to hedge existing positions by trading a negatively correlated market.
For investors this can be useful for building a truly diversified portfolio.
If a market has a high positive correlation, the black line will stay above zero most of the time. If a market has a high negative correlation, the black line will stay below zero most of the time.
A market with no or little correlation will bounce between the two or hover around zero most of the time.
The example market above is comparing Apple's weekly price action to the S&P500's over the past 20 weeks. It has a high positive correlation as the black line is above zero most of the time.
Good luck with your trading!
