FX COT (TT314)Part of FX Dashboard, based on @lord_fed document:
www.lordfed.co.uk
CFTC Commitment of Traders - large speculators view by default.
COT

Objective COTAutomated COT-based forex sentiment tool using CFTC data to highlight buy/sell zones via commercial hedgers' net positions. Spots extremes in pairs like EURUSD.
Features:
- Auto base/quote code detection.
- Custom thresholds (e.g., BUY: Base ≥55%, Quote ≤45%).
- 5-week % change filter for Commercials/Small Traders.
- Separate long/short colors for base/quote.
- Weekly confirmation, debug table, alerts.
- Futures/options selection.
Perfect for sentiment trading on daily/weekly charts. Backtest; not advice. Free!
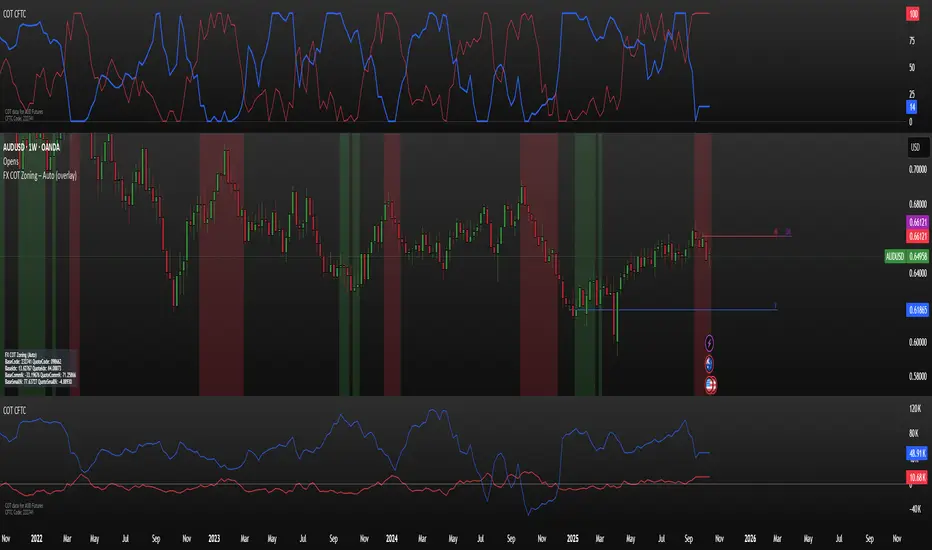
CoT Bias Tracker [DOSALGO]Unlock a powerful new dimension in your market analysis with the CoT Bias Tracker . This advanced tool goes beyond price charts to reveal the positioning of the market's largest players, allowing you to track the "smart money" and make more informed trading decisions.
By harnessing the weekly Commitment of Traders (CoT) report, this indicator automatically fetches, processes, and displays the net positioning of Commercials (Hedgers), Non-Commercials (Large Speculators), and Retail traders. Its standout feature is the unique dual-asset analysis for Forex pairs, which automatically breaks down a pair like EURUSD into its Base (EUR) and Quote (USD) components, giving you a crystal-clear view of the capital flows driving the market.
Stop guessing the trend and start tracking the institutional bias that truly matters.
Key Features
📈 Complete CoT Data Analysis: Automatically fetches and displays the latest weekly net positions for three key market participants: Commercials, Non-Commercials, and Retail Traders.
🌍 Unique Forex Pair Analysis: The only tool you'll need for Forex. It intelligently separates pairs (e.g., AUDJPY) into their Base (AUD) and Quote (JPY) currencies and displays a full CoT analysis for each, revealing which currency is truly in demand.
📊 Advanced Bias Dashboard: A comprehensive and fully customizable dashboard provides an at-a-glance summary of the market's sentiment, including current positions, weekly changes, and both short-term and long-term bias readings.
🧠 Conviction Analysis: This indicator goes deeper than just net positions. By analyzing the relationship between positioning changes and Open Interest, it gauges the conviction behind a move, distinguishing between a "Strong Long" (new money entering) and a "Weak Long" (short covering).
🚀 POIV Metric: Includes the Position x Open Interest Volume (POIV) metric, an advanced tool for measuring the cumulative force behind positioning changes over time.
📉 Historical Data Plotting: Visualize the net positioning data and its moving average directly on your chart's indicator pane. This is perfect for identifying historical extremes, divergences, and long-term trends in positioning.
⚙️ Automatic Symbol Recognition: The indicator intelligently detects the asset on your chart—from Forex pairs to indices like the S&P 500 and commodities like Gold—and automatically fetches the correct CoT data.
🎨 Full Customization: Tailor the entire tool to your workspace. Control the dashboard's position, size, and colors. Toggle the visibility of any data row or plot to focus only on what matters to you.
The Dashboard Explained
The dashboard gives you a complete, multi-faceted view of the market's positioning.
Participant Groups:
Commercials: Often considered the "smart money." They use futures to hedge their business operations and typically fade trends, buying into lows and selling into highs.
Non-Commercials: Large speculators like hedge funds and institutions. They are typically trend-followers, and their positioning is a powerful indicator of the current dominant trend.
Retail Traders: Small, non-reportable speculators. They are often seen as a contrarian indicator.
Net Positions & Change: See the raw net long or short positions from the current and previous week's report, along with the net change to understand the weekly capital flow.
S-Term Bias (Short-Term): Based on the weekly net change, this tells you who was buying and who was selling since the last report.
L-Term Bias (Long-Term): Compares the current net position to its moving average to define the dominant positioning trend. (Note: This reading is most effective on the Weekly chart timeframe.)
Conviction (via Open Interest): Found in the "Open Interest" row under the L-Term Bias column, this powerful metric tells you how positions are changing:
Strong Long: New buyers are entering the market with conviction.
Weak Long: Existing shorts are covering their positions.
Strong Short: New sellers are entering the market with conviction.
Weak Short: Existing longs are closing their positions.
Use Cases & Strategy
Trend Confirmation: Use the positioning of Non-Commercials to confirm the strength and direction of a trend you've identified with technical analysis.
Reversal Signals: Look for extreme net positioning levels or divergences between Commercial and Non-Commercial sentiment, which can often precede major market reversals.
Forex Strength Analysis: When trading a pair like GBPJPY, use the dashboard to see if Non-Commercials are strongly bullish on GBP while being bearish on JPY. This "double confirmation" can highlight high-probability trade setups.
Important Notes
Understanding CoT Data: The Commitment of Traders report is released by the CFTC every Friday afternoon (~3:30 PM ET). Crucially, it reflects the positions that were held on the preceding Tuesday. It is a tool for gauging medium- to long-term sentiment, not for intraday signals.
Disclaimer: This tool is for analytical and educational purposes only and should not be considered financial advice. All forms of trading involve risk. Always conduct your own research and apply robust risk management.

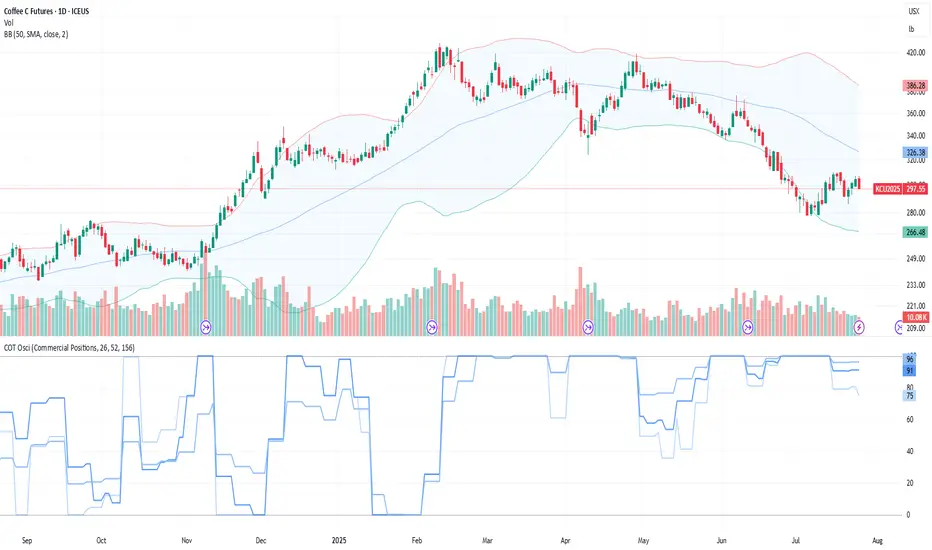
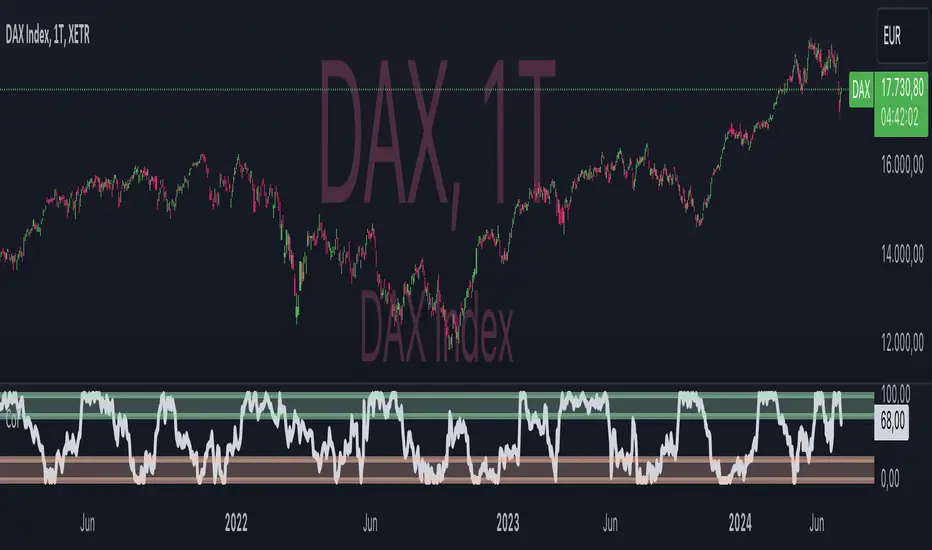
COT Comm OsciDescription
The COT Comm Osci is a sentiment oscillator based on net positions from the weekly Commitments of Traders (COT) report.
It transforms net positions of Commercials, Noncommercials, or Nonreportables into a 0–100 index.
A value of 100 = highest net position within the selected timeframe.
A value of 0 = lowest net position.
You can define three historical intervals (e.g. 26/ 52 / 156 weeks).
Tip
To improve your analysis, it's recommended to add a separate COT indicator that visualizes raw Long/Short or net positions directly. This helps interpret the oscillator in context.
This script is based on “Commercial Index–Buschi” by MagicEins and has been extended with new features and error handling.
Features
Select between Commercial, Noncommercial, or Nonreportable trader groups
Proper handling of HG Futures (Copper)
Displays a warning if the root code is invalid (unsupported market symbol)
Briese CoT Movement IndexThis Briese CoT (Commitments of Traders) Movement Index histogram indicator was built based on the formula by Stephen Briese in his book "The Commitments of Traders Bible":
"...difference between the COT Index and its reading of one or several weeks prior. I use six." —Chapter 7, page 75.
The code is a bit of a remix of the "ICT Commitment of Traders°" indicator by toodegrees and is meant for use in a new pane below a Weekly Chart .
The upper and lower thresholds are +40/-40. Some context: "A ± 40 point surge in the COT Index within a six-week period frequently marks the end of a counter-trend price reaction"
40 Point CoT Surge Rules (Commercials) from page 76
"During a correction from a prevailing uptrend, a +40 point movement in the CoT Index within a six-week period often marks the end of a corrective pullback, and the resumption of the major uptrend."
"During a reaction in a prevailing downtrend, a -40 point movement in the CoT Index within a six-week period frequently marks the end of a price reaction, and the resumption of the established downtrend."
"The failure of a ± point CoT Movement Index signal to restart the prevailing trend is a tip-off to a major trend change"
I'd recommend reading Briese's book for examples on how to properly interpret this indictor.
This indicator can be used in conjunction with another one I've published called the "Williams x Briese Hybrid CoT Index" which can be found on my scripts page.

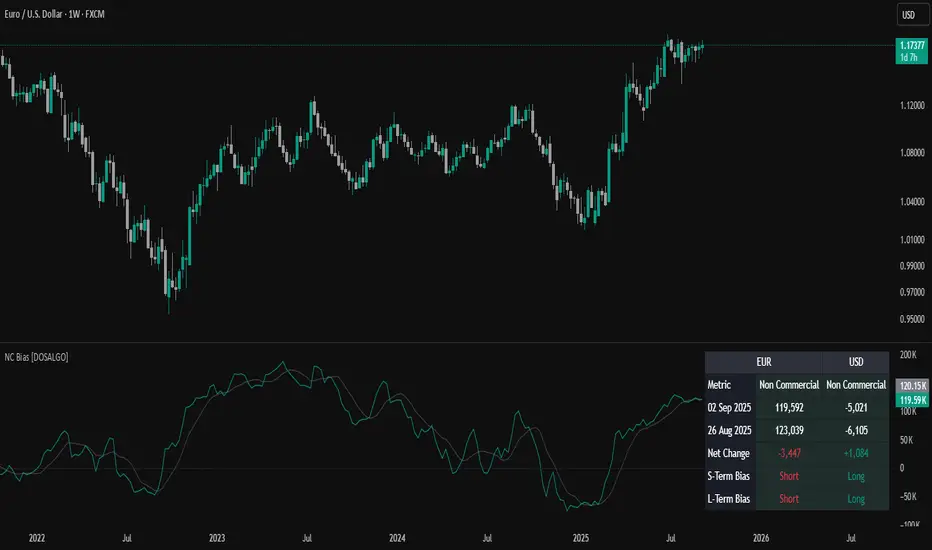
Non-Commercial Bias TrackerNon-Commercial Bias Tracker
Overview
The Non-Commercial Bias Tracker is a sophisticated sentiment analysis tool designed to provide traders with a clear view of the positioning of institutional speculators in the futures market. By analyzing the weekly Commitment of Traders (COT) report, this indicator helps you understand the underlying bias of large market participants for a wide range of assets, including forex, commodities, and indices.
The primary goal of this tool is to identify the prevailing trend in market sentiment and alert you to significant shifts in that trend, allowing you to align your strategy with the flow of institutional money.
Key Features
Dual Asset Analysis: Automatically detects the two assets in a trading pair (e.g., EUR and USD in EURUSD) or a single asset (e.g., GOLD) and displays their sentiment data side-by-side.
Comprehensive Data Table: A clean, customizable dashboard shows you the most critical sentiment metrics at a glance, including the current Net Position, the Change %, and the Overall Bias.
Visual Sentiment Plot: The indicator plots the primary sentiment metric and its signal line, giving you a visual representation of momentum and trend.
Clear Bias-Shift Signals: Green and red circles appear directly on the plot to highlight the exact moment the underlying sentiment momentum shifts, providing clear and timely signals.
How to Use the Indicator
Important Note: The Commitment of Traders data is released weekly. For the most accurate and meaningful signals, it is strongly recommended to use this indicator on the Weekly (W) chart timeframe.
1. The Data Table
The table in the corner of your screen is your main dashboard. Here’s what each row means:
Net Position: Shows the net difference between long (bullish) and short (bearish) contracts held by non-commercial traders. A positive number indicates a net long position; a negative number indicates a net short position.
Change %: This is the primary metric used for analysis, representing the net sentiment as a percentage.
Overall Bias: This is the final output of the indicator's analysis. It provides a clear "Long" or "Short" signal based on the current sentiment momentum. This cell is color-coded for quick interpretation (Green for Long, Red for Short).
2. The Chart Plots
Blue Line: Represents the current sentiment metric ("Change %" or "Net Position %").
Orange Line: Represents the signal line, or the average sentiment over a specific period.
Crossover Signals:
A Green Circle appears when the blue line crosses above the orange line, signaling a shift to a Long Bias.
A Red Circle appears when the blue line crosses below the orange line, signaling a shift to a Short Bias.
Settings & Customization
You can tailor the indicator to your specific needs via the Settings menu:
Data Source: Choose between "Futures Only" or the combined "Futures and Options" data.
Metric Type: Select whether to analyze the market using "Change %" (for momentum) or "Net Position %" (for conviction).
Bias Signal Line Length: Adjust the sensitivity of the crossover signals. A shorter length is faster, while a longer length provides smoother, more confirmed signals.
Style Settings: Customize the position of the data table and the color of the text to match your chart theme.
Disclaimer: This indicator is a tool for analysis and should not be considered as direct financial advice. All trading involves risk. Always use proper risk management and conduct your own due diligence before making any trading decisions.
COT Commitment of Traders IndexOVERVIEW
Commitment of Traders (COT) Indicator is a trading tool which designed to visualise net positions/commitment of traders that is reported weekly basis to the commissions.
CONCEPTS
The Indicator help you understand the position of long or short trades by market participants relative to their historical positioning. The change in position will help you in analysing the medium-to-long term market trend.
The commercial traders represents producers or consumers of the commodity that usually positions as hedgers in the market, protecting their asset over market fluctuation risk. The non-commercial traders represents fund or money managers that the goal is speculate and take profit from the market fluctuations. Non-reportable represents small or retail traders.
Understand the relative of those all traders will give better insight of how to positions ourselves in the market.
DETAILS & EXAMPLE OF HOW TO USE
An example of Gold Future chart (GC1!) to demonstrate the indicator in real market scenario.
Blue graph indicate the Commercial Index, showing on the extreme low under 20 level. Commercial traders as a hedgers indicate the turning point over an asset in extreme value. This showing the potential change in market direction the upside.
On the same time, Orange graph indicate the Non-Commercial Index, showing an extreme high level above 80. Non-Commercial traders will most of the time trade with the trend. This showing the potential continuation of market direction to the upside.
Base on those information, combine with other technical strategy on the same timeframe or even lower timeframe. For example using Supply & Demand to find the entry.
The result is a massive push to the upside in the long term direction.
FEATURES
3 Index in 1 indicator
Customisable historical period and threshold
LIMITATIONS
The Indicator is best applied on weekly, due to the weekly release of COT data.
Not intended as a stand-alone signal, but should be as part of long-term strategy analysis.
Should be combined with other lower-timeframe technical tools like supply and demand.

COT-Index-NocTradingCOT Index Indicator
The COT Index Indicator is a powerful tool designed to visualize the Commitment of Traders (COT) data and offer insights into market sentiment. The COT Index is a measurement of the relative positioning of commercial traders versus non-commercial and retail traders in the futures market. It is widely used to identify potential market reversals by observing the extremes in trader positioning.
Customizable Timeframe: The indicator allows you to choose a custom time interval (in months) to visualize the COT data, making it flexible to fit different trading styles and strategies.
How to Use:
Visualize Market Sentiment: A COT Index near extremes (close to 0 or 100) can indicate potential turning points in the market, as it reflects extreme positioning of different market participant groups.
Adjust the Time Interval: The ability to adjust the time interval (in months) gives traders the flexibility to analyze the market over different periods, which can be useful in detecting longer-term trends or short-term shifts in sentiment.
Combine with Other Indicators: To enhance your analysis, combine the COT Index with your technical analysis.
This tool can serve as an invaluable addition to your trading strategy, providing a deeper understanding of the market dynamics and the positioning of major market participants.

COT3 - Flip Strength Index - Invincible3This indicator uses the TradingView COT library to visualize institutional positioning and potential sentiment or trend shifts. It compares the long% vs short% of commercial and non-commercial traders for both Pair A and Pair B, helping traders identify trend strength, market overextension, and early reversal signals.
🔷 COT RSI
The COT RSI normalizes the net positioning difference between non-commercial and commercial traders over (N=13, 26, and 52)-week periods. It ranges from 0 to 100, highlighting when sentiment is at bullish or bearish extremes.
COT RSI (N)= ((NC - C)−min)/(max-min) x100
🟡 COT Index
The COT Index tracks where the current non-commercial net position lies within its 1-year and 3-year historical range. It reflects institutional accumulation or distribution phases.
Strength represents the magnitude of that positioning bias, visualized through normalized RSI-style metrics.
COT Index (N)= (NC net)/(max-min) x100
🔁 Flip Detection
Flip refers to the crossovers between long% and short%, indicating a change in directional bias among trader groups. When long positions exceed shorts (or vice versa), it signals a possible market flip in sentiment or trend.
For example, Pair B commercial flip is calculated as:
Long% = (Long/Open Interest)×100
Short% = (Short/Open Interest)×100
Flip = Long%−Short%
A bullish flip occurs when long% overtakes short%, and vice versa for a bearish flip. These flips often precede price trend changes or confirm sentiment breakouts.
Flip captures how far current positioning deviates from historical norms — highlighting periods of institutional overconfidence or exhaustion, often leading to significant market turns.
This combination offers a multi-layered edge for identifying when smart money is flipping direction, and whether that flip has strong conviction or is likely to fade.
..........................................................................................................................................................

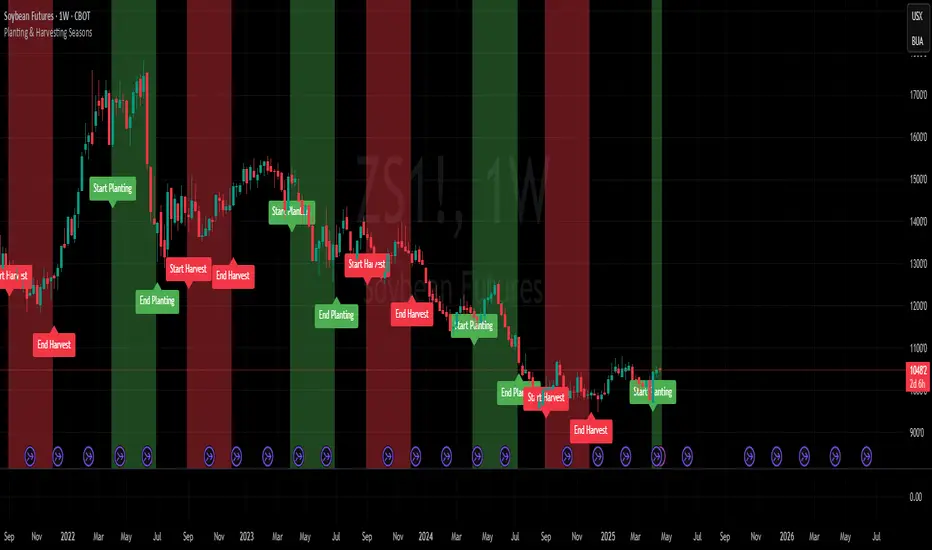
Planting & Harvesting SeasonsHello all,
as a commodity trader, I use a lot of seasonal patterns in my analysis. Some time ago, I came up with the idea to develop a simple script that visually overlays the typical planting and harvesting periods for key agricultural futures directly on the chart.
This script automatically detects the underlying commodity based on the symbol (e.g. ZC, ZW, ZS, CT) and displays color-coded zones for each seasonal window. These zones are based on historical crop calendars and help identify when planting or harvesting typically takes place. The goal is to better align technical setups with fundamental seasonal factors.
This is a basic version and meant as a visual aid — not a trading signal in itself.
Hope you enjoy it and any feedback is highly appreciated!
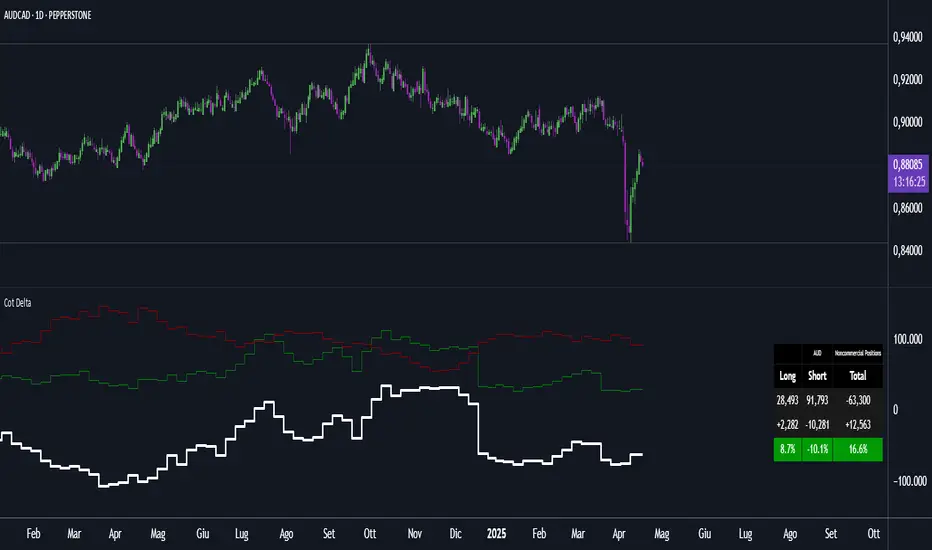
Cot DeltaCOT Delta by Jacopo
Designed to visualize and analyze data related to the Commitment of Traders (COT) report, which is published by the Commodity Futures Trading Commission (CFTC) in the United States. Its primary purpose is to display the long and short positions of traders on futures contracts, divided by categories like Commercial, Noncommercial, and Nonreportable.
Main Features:
Selection Mode: The user can choose from several modes to display COT data, such as "Auto", "Root", "Base currency", or "Currency". This determines which currency will be shown on the chart.
Contract Type: It is possible to select whether to display data for Futures, Options, or both (Futures + Options).
COT Category: The user can choose one of the trader categories like Commercial Positions, Noncommercial Positions, or Nonreportable Positions to analyze positions based on the type of market participant.
Data Visualization: The chart shows long, short, and net positions (long - short) with separate lines, using different colors for each type of position:
Long positions in green.
Short positions in red.
Net difference (long - short) in white.
Data Table: A table is displayed to present the data clearly, with the following columns:
Long: Long positions.
Short: Short positions.
Total: The net sum of positions (long - short).
Changes: The difference between current and previous data (delta) in both absolute and percentage terms.
Variation Visualization: The table also shows the variations from the previous period (both in absolute and percentage terms), with conditional background colors to highlight positive or negative changes.
Optional CFTC Code: The user can input a custom CFTC code to analyze specific data, if necessary.
In Summary:
This indicator provides a clear and precise visualization of trader positions (long and short) on futures and options contracts, making it easier to analyze market dynamics related to commercial and non-commercial traders. The combination of a chart and table allows for real-time tracking of position changes.
XLimitless - Commitments of Traders (COT)XLimitless - Commitment of Traders (COT)
Unlock unparalleled market insights with the
XLimitless - COT Indicator, designed to give traders a competitive edge by visualizing the weekly Commitment of Traders (COT) data in an interactive and customizable table.
This advanced tool provides a comprehensive breakdown of market participants' positions, including Commercials, Non-Commercials (Large Speculators), and Non-Reportables (Small Speculators).
Key Features:
Customizable Data Display:
Choose from Commercial , Non-Commercial , or Non-Reportable positions.
Set the number of weeks to display (up to 52) for a tailored view.
Heatmap highlighting for quick identification of historical extremes.
Detailed Metrics:
Weekly Long, Short, and Net Positions data.
Open Interest and weekly changes for granular analysis.
Max/Min rows to spot historical highs and lows at a glance.
Interactive Table Positioning:
Flexible table placement options (e.g., Top Right, Bottom Left) to suit your chart layout.
Dynamic date adjustments with time-zone support for accurate alignment.
Enhanced Visual Feedback:
Heatmap-based color gradients for easy trend and extreme position identification.
Integrated tooltips for intuitive data understanding.
Global Asset Coverage:
Supports major asset classes, including Currencies, Commodities, Indices, and more.
Auto-detects base and quote currencies, ensuring accurate data mapping.
Historical Lookback Settings:
Analyze trends over 6 months to 5 years with configurable lookback periods.
Market Participants:
Commercial: Users & Producers
Non Commercial: Bank, Institutions & Large Traders
Non Reportable: Small Traders, Retail
--
Disclaimer:
By using or publishing the XLimitless - Commitment of Traders (COT) indicator, you warrant that:
The information displayed and interpreted through this tool complies with applicable laws and regulations.
The indicator does not constitute investment advice or financial recommendations.
The content generated is not intended solely for qualified or professional investors.
Always ensure compliance with TradingView’s policies and applicable legal standards. Use this indicator responsibly and at your own discretion.

FXN1 COT Net Positions + OscillatorThe FXN1 COT Net Positions Oscillator is a versatile tool designed for traders to analyze Commitment of Traders (COT) data with both raw net positions and oscillator-style visualization. This script allows users to visualize the net positions of Commercials, Large Speculators, and Retailers Small Speculators to identify potential market turning points or trends based on the positioning of different market participants.
Key Features:
1. Customizable Time Frame:
The script allows users to select the number of months (6 months, 12 months, 18 months, or 24 months) for calculating the COT net positions. This flexibility helps in analyzing longer or shorter-term trends in the market.
2. Oscillator and Raw Net Positions View:
- Users can choose to view the net positions as a normalized oscillator (scaled between 0 and 100) or as raw net positions. The oscillator view helps to identify overbought and oversold conditions, while the raw view provides direct insights into the net positioning of each group.
- The oscillator is created using a stochastic-like normalization, where the net position is plotted relative to its high/low over the selected time period.
3. Toggle Between Oscillator and Raw Data:
- A simple input toggle allows users to switch between the oscillator and raw net positions view with ease.
- In oscillator mode, overbought and oversold levels are displayed to help identify potential reversal points in the market.
4. Clear Visualization:
- Commercials Net: Shown in blue, representing the positions of commercial traders (hedgers).
- Large Speculators Net: Shown in red, indicating the positions of large institutional traders (fund managers).
- Retailers Small Speculators Net: Shown in yellow, representing the positions of small retail traders.
- Overbought and oversold levels in oscillator mode are customizable, allowing for more flexible trading signals.
5. Overbought and Oversold Levels:
- In oscillator mode, the script includes customizable overbought and oversold levels, making it easier to spot extreme conditions that may signal a market reversal.
- These levels are hidden when the raw net position view is active, offering a clean and clear visualization.
6. Works Across Multiple Markets:
The script is designed to work with a wide variety of futures markets, adapting to different symbols with automatic COT data adjustments based on the root symbol.
How It Works:
COT Data Sources: The script pulls commercial, large speculator, and small speculator data from the Legacy COT report.
Net Positions: It calculates the net long positions by subtracting the short positions from the long positions for each group.
Oscillator Mode: The net positions are normalized to oscillate between 0 and 100, where 100 represents the most extreme net long position and 0 represents the most extreme net short position over the selected time period.
Raw Mode: The net positions are plotted directly, providing the actual number of net positions held by each group without normalization.
Use Cases:
Trend Identification: Analyze the positioning of commercial traders (hedgers) vs. large speculators (fund managers) and retail traders to identify potential trend reversals or continuations.
Reversal Signals: In oscillator mode, overbought and oversold conditions can provide potential signals for market reversals.
Sentiment Analysis: Gauge market sentiment by comparing the positions of different market participants and using the insights to build contrarian strategies or confirm trend-following strategies.
Parameters:
Number of Months: Choose between 6, 12, 18, and 24 months for the calculation period.
Overbought Level: Customizable level to define when the market may be considered overbought in oscillator mode (default: 80).
Oversold Level: Customizable level to define when the market may be considered oversold in oscillator mode (default: 20).
Show Net Positions as Oscillator: Toggle to switch between raw net positions and oscillator view.
This script is a powerful tool for traders who want to incorporate COT data into their analysis in a more flexible and customizable way. Whether you're a swing trader looking for reversal points or a trend follower analyzing market sentiment, the FXN1 COT Net Positions Oscillator provides deep insights into the behavior of different market participants.

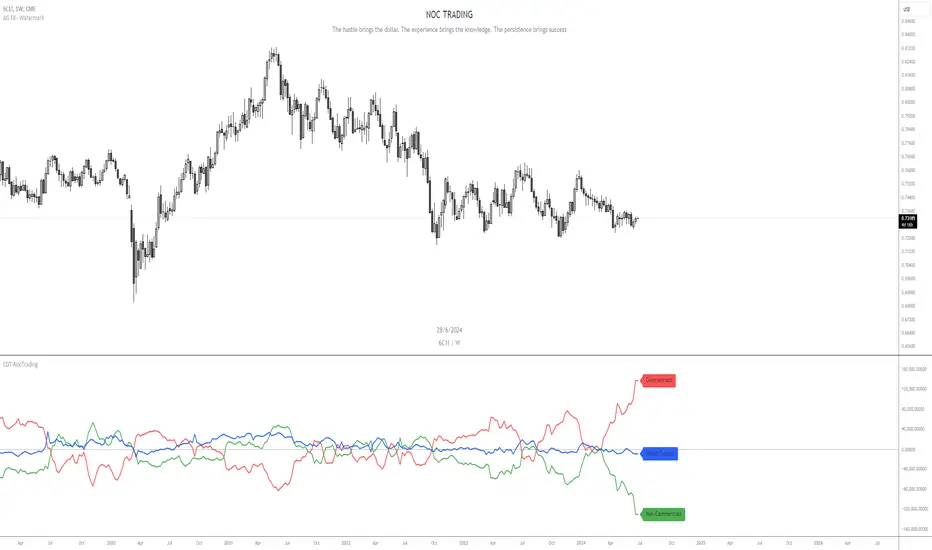
COT-NocTradingIndicator Description:
Commitments of Traders (COT) Data Indicator
The Commitments of Traders (COT) Data Indicator on TradingView provides insights into market sentiment based on the weekly CFTC (Commodity Futures Trading Commission) reports. It plots three key lines derived from this data, offering valuable information for traders seeking to understand positioning trends among large speculators, commercial hedgers, and small traders.
Lines Plotted:
Commercials: Reflects positions held by commercial entities engaged in the production or sale of the underlying commodity. Their positions often act as a hedge against physical market exposure.
Non Commercials: Represents positions held by large speculators, typically hedge funds and large financial institutions, who often take more significant positions based on their market outlook.
Retail Traders: Shows positions held by small traders, including individual retail traders and smaller institutional players, providing insights into the broader retail sentiment.
Labeling:
Each line is accompanied by a label to clearly identify its corresponding group, enhancing clarity and ease of interpretation for traders analyzing the indicator.
Usage:
Trend Confirmation: Monitor the positioning of commercial and non commercial relative to retail traders to confirm trends and potential reversals.
Sentiment Analysis: Assess shifts in market sentiment based on changes in positioning across different trader categories.
Trading Signals: Use crossovers, divergences, and extreme positioning relative to historical data to generate potential trading signals.
This indicator is valuable for traders looking to incorporate institutional positioning data into their trading strategies, offering a deeper understanding of market dynamics beyond price action alone.
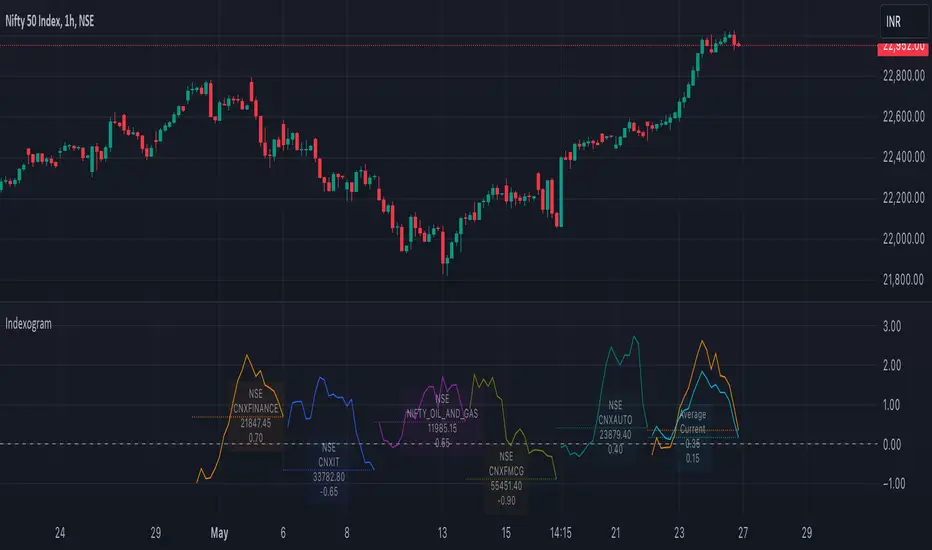
IndexogramIndexogram is a platform designed to help traders analyze the Commitment of Traders (COT) report data. It specifically focuses on the Rate Of Change (ROC) of the COT data, visualized using a unique polyline plotting technique.
Commitments of Traders % Rate Of Change (%ROC):
The COT %ROC indicates the momentum of trader positions over a specified period. This measure is crucial for understanding shifts in market sentiment and potential future price movements.
Unique Polyline Plotting Technique:
Unlike traditional line or bar charts, the polyline plotting technique used in Indexogram offers a more nuanced and detailed view of the %ROC data.
Multiple Ticker Monitoring:
Indexogram allows the setup of up to five different tickers. Traders can assign different weightages to these tickers, enabling a customized and weighted view of their %ROC data. This feature is beneficial for tracking a diversified portfolio or comparing different assets.
Average ROI Plot:
An additional feature is the Average ROI plot, which provides the average return on investment (ROI) of the five selected tickers. This plot helps traders quickly assess the overall performance of their monitored assets.
Strategy for Traders
Diversified Monitoring:
By setting up five different tickers with varying weightages, traders can diversify their monitoring efforts across different assets or markets. This diversification helps in reducing risk and identifying opportunities in different sectors or asset classes.
Weightage Customization:
Assign weightages based on market conditions or personal trading strategy. For example, if a trader believes that commodities are likely to outperform equities in the near term, they can assign a higher weightage to commodities-related tickers.
Analyzing %ROC Trends:
Use the polyline plots to identify significant %ROC trends. A rising %ROC might indicate increasing momentum and a potential buying opportunity, while a falling %ROC could signal decreasing momentum and a potential selling opportunity.
Average ROI Analysis:
Use the Average ROI plot to gauge the overall performance of the selected assets. If the average ROI is positive and trending upwards, it indicates a generally favorable market condition for the monitored assets.
Tactical Adjustments:
Regularly review and adjust the selected tickers and their weightages based on changing market conditions, news, and personal insights. This flexibility allows traders to adapt their strategy in response to new information.
Important Notes:
Indexogram is a tool to identify potential tradings, not a guaranteed predictor of future price movements.
CoT artificial by Oster and Freundl (CoF)Overview:
CoF , short for "CoT artificial by Oster and Freundl", presents a novel approach to market analysis, inspired by the traditional Commitments of Traders (CoT) Index . Based on the artificial CoT calculation according to Freundl and Oster (explained below), this indicator provides traders with a versatile tool applicable across various markets, including individual stocks. Unlike its predecessor, CoF offers flexibility in its application, accommodating traders with different investment horizons, whether they operate on weekly, daily, hourly, or even minute candlesticks. By adjusting the period length in the settings, users can fine-tune the sensitivity of CoF to capture buy or sell signals, albeit with differing signal qualities. Additionally, CoF is equipped with alert functionalities, enhancing its usability for traders seeking timely market insights.
Sophisticated Calculation Methodology:
CoF derives its insights from a sophisticated calculation methodology, leveraging price range and price movement metrics to assess market dynamics. The indicator computes the ratio between the moving averages of price movement and price range over a specified period. This ratio, once normalized and scaled to a 0-100 range , provides traders with a quantifiable measure of market sentiment. Notably, CoF's calculation method, while nuanced, ensures accessibility and usability for traders seeking actionable insights without delving into complex mathematical formulations.
Interpretation:
CoF-Index, represented on the chart, offers traders insights into market sentiment dynamics . Values below the sell threshold indicate potential selling pressure, triggering sell alerts to alert traders to potential downturns. Conversely, values exceeding the buy threshold signal buying opportunities, prompting buy alerts for traders to capitalize on potential market upswings. By aligning these interpretations with the trader's investment strategy, CoF aids in decision-making processes, offering nuanced perspectives on market movements.
Dynamic Color Coding for Visual Clarity:
To enhance user experience and facilitate quick decision-making, CoF incorporates dynamic color coding . Market conditions favoring selling are denoted by red hues, while those conducive to buying are highlighted in green. Neutral conditions, indicative of balanced market sentiment, are represented in neutral colors. This intuitive visual feedback enables traders to swiftly identify market opportunities and risks, empowering them to make informed trading decisions.
Customizable Parameters for Tailored Analysis:
Acknowledging the diverse trading preferences and strategies of its users, CoF offers customizable parameters . Traders can adjust the period length to fine-tune the indicator's sensitivity to their desired level, balancing the frequency and quality of signals according to their trading objectives. Additionally, CoF's alert functionalities allow traders to set personalized thresholds, aligning with their risk tolerance and market outlook.
Conclusion:
In conclusion, CoF emerges as a valuable addition to the trader's toolkit, offering a versatile and accessible approach to market analysis. Built upon a foundation of sophisticated calculation methodologies, CoF provides traders with actionable insights into market sentiment across various timeframes and asset classes . Its intuitive visualizations, coupled with customizable parameters and alert functionalities, empower traders to navigate dynamic market conditions with confidence. Importantly, the CoF index offers traders the flexibility to employ a synthetically calculated method, inspired by the classic CoT-Index, regardless of market or investment horizon . Whether you're a seasoned investor or a novice trader, CoF equips you with the tools needed to stay ahead in today's competitive markets.
Commitments of Traders Report [Advanced]This indicator displays the Commitment of Traders (COT) report data in a clear, table format similar to an Excel spreadsheet, with additional functionalities to analyze open interest and position changes. The COT report, published weekly by the Commodity Futures Trading Commission (CFTC), provides valuable insights into market sentiment by revealing the positioning of various trader categories.
Display:
Release Date: When the data was released.
Open Interest: Shows the total number of open contracts for the underlying instrument held by selected trader category.
Net Contracts: Shows the difference between long and short positions for selected trader category.
Long/Short OI: Displays the long and short positions held by selected trader category.
Change in Long/Short OI: Displays the change in long and short positions since the previous reporting period. This can highlight buying or selling pressure.
Long & Short Percentage: Displays the percentage of total long and short positions held by each category.
Trader Categories (Configurable)
Commercials: Hedgers who use futures contracts to manage risk associated with their underlying business (e.g., producers, consumers).
Non-Commercials (Large Speculators): Speculative traders with large positions who aim to profit from price movements (e.g., hedge funds, investment banks).
Non-Reportable (Small Speculators/Retail Traders): Smaller traders with positions below the CFTC reporting thresholds.
CFTC Code: If the indicator fails to retrieve data, you can manually enter the CFTC code for the specific instrument. The code for instrument can be found on CFTC's website.
Using the Indicator Effectively
Market Sentiment Gauge: Analyze the positioning of each trader category to gauge overall market sentiment.
High net longs by commercials might indicate a bullish outlook, while high net shorts could suggest bearish sentiment.
Changes in open interest and long/short positions can provide additional insights into buying and selling pressure.
Trend Confirmation: Don't rely solely on COT data for trade signals. Use it alongside price action and other technical indicators for confirmation.
Identify Potential Turning Points: Extreme readings in COT data, combined with significant changes in open interest or positioning, might precede trend reversals, but exercise caution and combine with other analysis tools.
Disclaimer
Remember, the COT report is just one piece of the puzzle. It should not be used for making isolated trading decisions. Consider incorporating it into a comprehensive trading strategy that factors in other technical and fundamental analysis.
Credit
A big shoutout to Nick from Transparent FX ! His expertise and thoughtful analysis have been a major inspiration in developing this COT Report indicator. To know more about this indicator and how to use it, be sure to check out his work.

TASC 2023.10 COT Commercials Indicator█ OVERVIEW
This script implements the COT Commercials Indicator introduced by Alfred François Tagher in an article featured in TASC's October 2023 edition of Traders' Tips . The indicator is designed for use in futures markets and represents a fast stochastic (%K) calculated based on the commercial open interest values of an asset derived from the weekly Commitments Of Traders (COT) report .
█ CONCEPTS
The COT report, issued by the Commodity Futures Trading Commission (CFTC) , presents a breakdown of reportable open interest positions held by various trader groups—commercial, noncommercial, and nonreportable (small traders). Open interest reflects the total number of derivative contracts entered by market participants but not yet settled. Consequently, it can serve as a measure of market activity and liquidity.
The indicator showcased here aims to analyze changes in the reported net values of open interest for commercial traders/hedgers (often referred to as 'smart money', as they deal directly in underlying commodities). The net values are positive when the commercial traders have more long positions than short ones and negative when they hold more short positions than long ones. Positive net values indicate that commercial traders hold more long positions than short ones, while negative values indicate the opposite. Thus, overbought and oversold conditions of the COT Commercials Indicator potentially suggest collective bullish and bearish sentiments, respectively.
█ CALCULATIONS
The calculations involve these steps:
1. Net open interest values are extracted from COT data using the LibraryCOT library provided by TradingView.
2. A fast stochastic indicator (%K) is then applied to normalize these net values.
The script also provides an option of calculating and plotting the indicator curve for noncommercial (speculators) open interest.

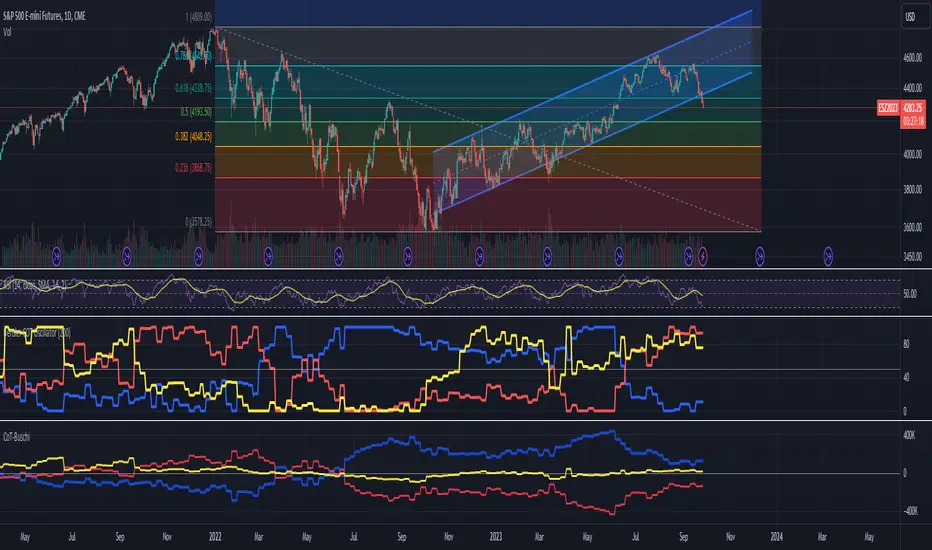
Bensler COT OscillatorI tried to replicate the indicator I think Jason Shapiro from Crowded Market Report has kind of alluded to on his interviews and YouTube channel. I think I made the default colors on my indicator match Shapiro's. It's best if used in parallel with the indicator CoT-Buschi which is a nice COT indicator that I based my oscillator off of. That way you can see the effect of the oscillator and decide if you like how the time period affects the output. I am a total noob so just in case you think I know what I'm talking about or doing, I don't.
Open Interest Chart [LuxAlgo]The Open Interest Chart displays Commitments of Traders %change of futures open interest , with a unique circular plotting technique, inspired from this publication Periodic Ellipses .
🔶 USAGE
Open interest represents the total number of contracts that have been entered by market participants but have not yet been offset or delivered. This can be a direct indicator of market activity/liquidity, with higher open interest indicating a more active market.
Increasing open interest is highlighted in green on the circular plot, indicating money coming into the market, while decreasing open interests highlighted in red indicates money coming out of the market.
You can set up to 6 different Futures Open interest tickers for a quick follow up:
🔶 DETAILS
Circles are drawn, using plot() , with the functions createOuterCircle() (for the largest circle) and createInnerCircle() (for inner circles).
Following snippet will reload the chart, so the circles will remain at the right side of the chart:
if ta.change(chart.left_visible_bar_time ) or
ta.change(chart.right_visible_bar_time)
n := bar_index
Here is a snippet which will draw a 39-bars wide circle that will keep updating its position to the right.
//@version=5
indicator("")
n = bar_index
barsTillEnd = last_bar_index - n
if ta.change(chart.left_visible_bar_time ) or
ta.change(chart.right_visible_bar_time)
n := bar_index
createOuterCircle(radius) =>
var int end = na
var int start = na
var basis = 0.
barsFromNearestEdgeCircle = 0.
barsTillEndFromCircleStart = radius
startCylce = barsTillEnd % barsTillEndFromCircleStart == 0 // start circle
bars = ta.barssince(startCylce)
barsFromNearestEdgeCircle := barsTillEndFromCircleStart -1
basis := math.min(startCylce ? -1 : basis + 1 / barsFromNearestEdgeCircle * 2, 1) // 0 -> 1
shape = math.sqrt(1 - basis * basis)
rad = radius / 2
isOK = barsTillEnd <= barsTillEndFromCircleStart and barsTillEnd > 0
hi = isOK ? (rad + shape * radius) - rad : na
lo = isOK ? (rad - shape * radius) - rad : na
start := barsTillEnd == barsTillEndFromCircleStart ? n -1 : start
end := barsTillEnd == 0 ? start + radius : end
= createOuterCircle(40)
plot(h), plot(l)
🔶 LIMITATIONS
Due to the inability to draw between bars, from time to time, drawings can be slightly off.
Bar-replay can be demanding, since it has to reload on every bar progression. We don't recommend using this script on bar-replay. If you do, please choose the lowest speed and from time to time pause bar-replay for a second. You'll see the script gets reloaded.
🔶 SETTINGS
🔹 TICKERS
Toggle :
• Enabled -> uses the first column with a pre-filled list of Futures Open Interest tickers/symbols
• Disabled -> uses the empty field where you can enter your own ticker/symbol
Pre-filled list : the first column is filled with a list, so you can choose your open interest easily, otherwise you would see COT:088691_F_OI aka Gold Futures Open Interest for example.
If applicable, you will see 3 different COT data:
• COT: Legacy Commitments of Traders report data
• COT2: Disaggregated Commitments of Traders report data
• COT3: Traders in Financial Futures report data
Empty field : When needed, you can pick another ticker/symbol in the empty field at the right and disable the toggle.
Timeframe : Commitments of Traders (COT) data is tallied by the Commodity Futures Trading Commission (CFTC) and is published weekly. Therefore data won't change every day.
Default set TF is Daily
🔹 STYLE
From middle:
• Enabled (default): Drawings start from the middle circle -> towards outer circle is + %change , towards middle of the circle is - %change
• Disabled: Drawings start from the middle POINT of the circle, towards outer circle is + OR -
-> in both options, + %change will be coloured green , - %change will be coloured red .
-> 0 %change will be coloured blue , and when no data is available, this will be coloured gray .
Size circle : options tiny, small, normal, large, huge.
Angle : Only applicable if "From middle" is disabled!
-> sets the angle of the spike:
Show Ticker : Name of ticker, as seen in table, will be added to labels.
Text - fill
• Sets colour for +/- %change
Table
• Sets 2 text colours, size and position
Circles
• Sets the colour of circles, style can be changed in the Style section.
You can make it as crazy as you want:

ICT Commitment of Traders° by toodegreesDescription:
The Commitment of Traders (COT) is a valuable raw data report released weekly by the Commodity Futures Trading Commission (CFTC). This report offers insights into the current long and short positions of three key market entities:
Commercial Traders ( usually represented in red )
Large Traders ( typically depicted in green )
Small Speculator Traders ( commonly shown in blue )
The concept of utilizing the COT data as a strategic trading tool was first introduced by Larry Williams, who emphasized the importance of monitoring Commercial Speculators – large corporate producers or consumers of commodities.
The Inner Circle Trader (ICT) prompts us to delve deeper into this data. While we can easily determine their Net Position (also referred to as the Main Program) by subtracting Commercial Short Positions from the Commercial Long Positions, this calculation doesn't reveal their ongoing Hedge Program .
Merely following the Main Program won't provide a trading edge. Aligning with the Hedge Program can be an invaluable weapon in your trading arsenal.
The Commercial Speculators' Hedge Program can be unveiled by examining the highest and lowest reading of their Net Position over a chosen time period and setting a new "zero line" between these extremes. This process generates a novel "COT Graph" providing a detailed understanding of the Commercial Speculators' current market activity.
When the Hedge Program, Seasonality, and Open Interest are cross-referenced with Institutional Orderflow, a trader can construct a very clear medium-to-long-term market narrative.
Features:
Access COT Data for the Commercial Speculators via Tradingview's reliable data source
Automate calculations and display the 3-month, 6-month, 12-month, 2-year, and 3-year Hedge Program
Define your own Custom Time Range for the Hedge Program
Display the Main Program and all Hedge Programs in an easy-to-understand table format
Additionally, by following the included instructions, you can augment your table with COT data from multiple markets. This extra information can help monitor correlated markets and develop a more robust market narrative:

COT-index rangeA graph showing the commercials (part of COT-data) positioning in relation to its own range, X periods back. I usually choose the look-back period to equal approximately one year. This will be around 52 on a weekly chart and 250 on a daily chart.
In my opinion a high data-point for the commercials is bullish and vice versa. But instead of only looking att absolute values I now look more at how the commercials are positioned compared to the previous 12 och 6 months.
Example:
a) if COT-index range = 0.8, then the commercials are in the 80th percentile for this specific look-back period, i.e. the commercials has only been more bullish 20% of the time and more bearish 80% of the time.
b) a) if COT-index range = 0.5, then the commercials are in the 50th percentile for this specific look-back period, i.e. the commercials has been more bullish 50% of the time and more bearish 50% of the time.
c) if COT-index range = 0.2, then the commercials are in the 20th percentile for this specific look-back period, i.e. the commercials has been more bullish 80% of the time and more bearish 20% of the time.
In other words, a high reading is bullish and a low reading is bearish.

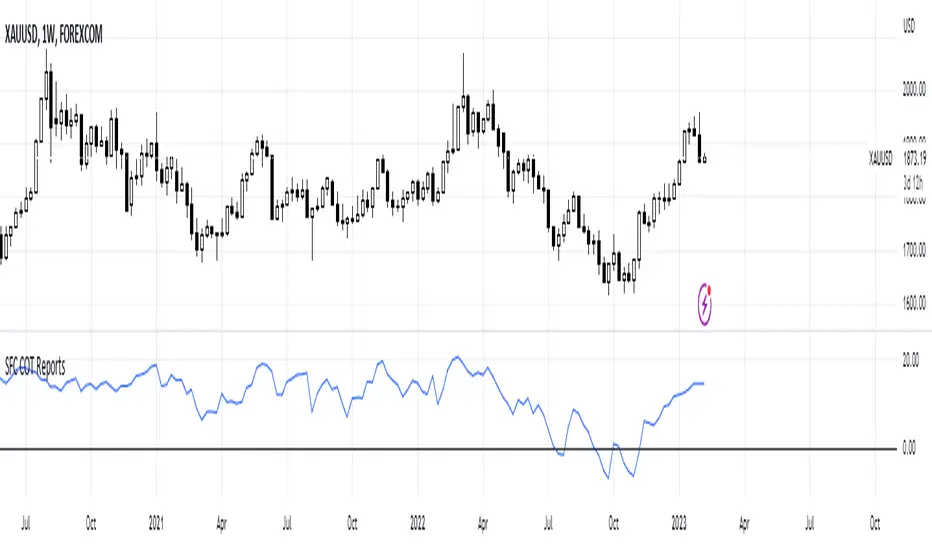
SFC True COT ReportsThe Commodity Futures Trading Commission (Commission or CFTC) publishes the Commitments of Traders ( COT ) reports to help the public understand market dynamics. Specifically, the COT reports provide a breakdown of each Tuesday’s open interest for futures and options on futures markets in which 20 or more traders hold positions equal to or above the reporting levels established by the CFTC.
This indicator can display three similar, but also very different calculations:
- Net positions of the leveraged/managed Money
- COT Index
- COT True Index
Net Positions
The COT report is not a timing instrument. It shows us markets in which the trend remains stable OR where there could be a change in trend. But it does not give us clear information as to *WHEN* an entry into the market should take place.
Net positions are showing if the professional traders have bullish or bearish bias.
COT Index
After calculating the net positions, we are already one step further, but have not yet reached our goal. The net position itself does not tell us anything about how the commercials have actually positioned themselves. If we only know that the commercials are 15,782 contracts short this week, that does not help us much.
We need an indicator that lets us evaluate this figure. And we get it by relating the current position to the positions over a certain period. So, an index is calculated, that allows us to evaluate the current position as a percentage.
COT True Index
COT Index can give us very good idea how bullish or bearish are the professional traders, but it is limit to 0% and 100%. In this case an additional calculation is needed in order to remove this limitation and show us the true bias.
How to use the true index:
1) If the curve is below zero line means that the traders officially changed the bias from bullish to bearish . Before that we can consider that they are still bullish and price is retracing or consolidation, and vice versa
2) We can also measure the strength of the bias. For example if the curve is below zero line, but only few precent, we may consider that the bias is changing but it is still weak bearish bias.
3) We can use the chart to see where are the peaks and troughs. They are using as support and resistance and we can expect a general chance at these levels.
Supported pairs:
'XAUUSD' , 'XAGUSD' , 'COPPER' , 'PLATINUM' 'PALLADIUM';
'AUDUSD' ,'USDCAD' , 'GBPUSD' , 'EURUSD' , 'USDJPY' , 'DXY';
'US30USD' ,'SPX500USD' , 'NAS100USD';
'US02Y' , 'US05Y' , 'US10Y'
'BTCUSD'
Note: The curve of the US Yields is inverted, because actually shows the Bond market and not the Yields. This is not a problem, because Yields have perfect negative correlations with Bonds.
The indicator works only on weekly time frame.