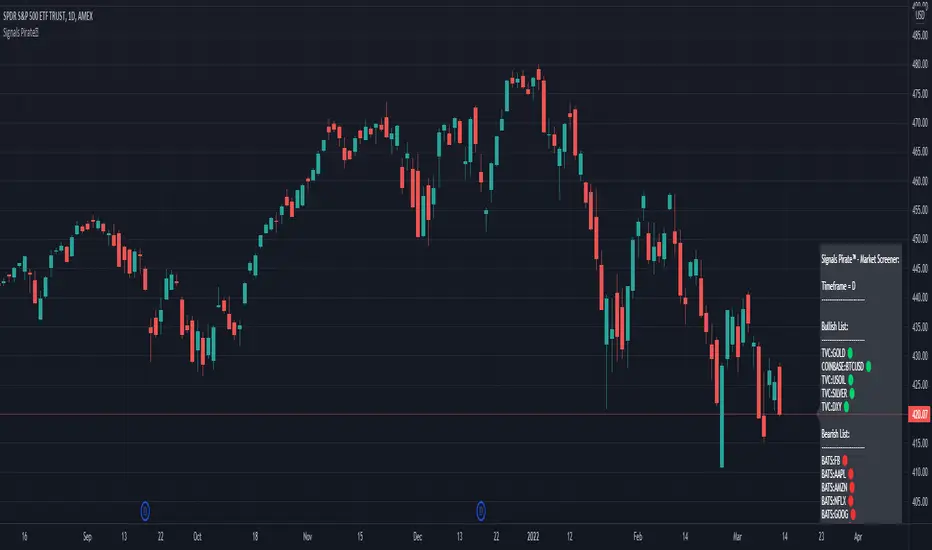
Signals Pirate™ Market ScreenerSignalsPirate™ Market Screener provides users with the ability to quickly and easily check the current trend of up to 40 different assets on any timeframe! With a simple ‘Bullish’ or ‘Bearish’ trend easily defined using accurate and reliable calculations, this tool could massively cut down the amount of time your TA takes!
The main Input options are 'Reactivity' and 'Depth', which allow for a dynamic trend following strategy that works on all time frames and assets. Using these values the strategy will print the bundles main ‘Buy’ and ‘Sell’ signals to try and identify the trend early and accurately. Their main functions are to dynamically calculate volatility and current trend direction – but we’ve gone more in-depth below!
Reactivity:
Reactivity controls how quickly the Algo reacts to changes in trend. This part of the bundle takes into account the Average True Range (ATR) to gauge current market volatility and direction of the trend. Lowering the reactivity value will generate quicker reaction times of the algorithm as it will lower the threshold of volatility required for a signal to be generated. Therefore, it’ll show trades more frequently.
Depth:
Depth controls the position of the signals according to the trend swing. Calculated using a variation of the Average Direction Index (ADX) to measure the changes in prices over a given period, when running parallel to the Reactivity volatility filter the trend can be identified quickly and accurately on any given time frame or asset. Higher Depth will allow for less frequent and slower entries. In contrast, lower Depth will give more frequent and earlier entries.
The default settings are the best settings we’ve found so far but you can change them to build your own unique trading strategy. We’d recommend experimenting with these values to find the best results for the asset you are trading, and your own personal trading and investing style.
Direction for use:
1. Use on any asset class and time frame and add the tickers of any asset you want included in the screener.
2. Fine tune the Reactivity (volatility) and Depth (trend sensitivity).
3. Consider longing assets that appear in the ‘Bullish List’ after candle close, and consider shorting assets that appear in the ‘Bearish List’ after candle close.
4. Exit positions once an asset has switched from one list to the other.
As mentioned previously, this Market Sceener uses a trend base system that dynamically operates to function with superior accuracy regardless of what you’re trading. But with the level of customisation available, this can easily be fine tuned to accommodate scalping, reversal trading, or even long term investing.
We hope you love this Screener, and it takes your trading and investing to the next level. Please let us know if you have any questions or queries regarding the logic behind the bundle, or if you have any suggestions for improvements etc. We love your feedback and are constantly striving to continuously improve!
Kripto
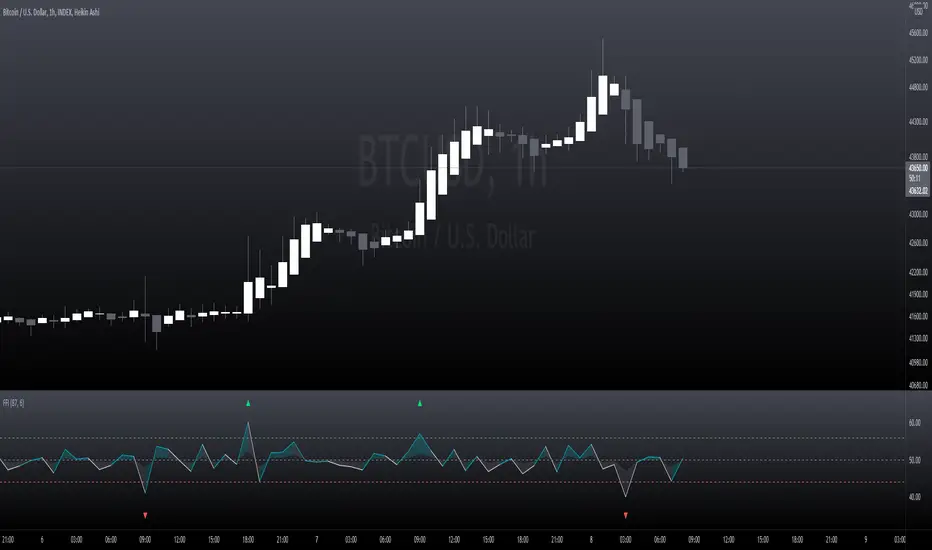
Momentum CloudThis is a modified Ichimoku Cloud:
-The default Lookback-Length and Displacement settings have been modified to operate optimally on 24/7 markets - which is popular among Crypto analysts.
-The Lagging Span, Base Line, and Conversion Line have been removed - leaving just the bare cloud.
-Additionally, the Cloud's color will shift blue when it is compressed. (More specifically - when Leading Span A retreats to Leading Span B, the color changes.)
This allows the user to easily identify when the Cloud is "thinning", either to the upside, or the downside.
Being that the "spread" or "width" of an Ichimoku Cloud generally gauges it's efficacy as potential Support or Resistance, this tool is particularly useful for highlighting when momentum is weakening.
*This script will be updated in the future to allow the user to view the Momentum Cloud of alternate time-frames! (e.g, Viewing the 1D Momentum Cloud on the 1H timeframe)

customConfluenceSimplifiedThis indicator is intended to automatically search for confluence on a variety of indicators and conditions, highly customizable parameters, including Take profits, stop losses and classic indicator adjustments.
Best results in BTCUSDT 15m and 1H, but feel free to optimize it on any pair and timeframe. I don't recommend using it in non crypto assets.
Alerts are fully customizable too. You can put any alert() (buy/sell) to any pair.
I intended to maximize quality of signals over quantity. But anyway you can customize a lot of parameters to make it more frequent.
DM me for access.
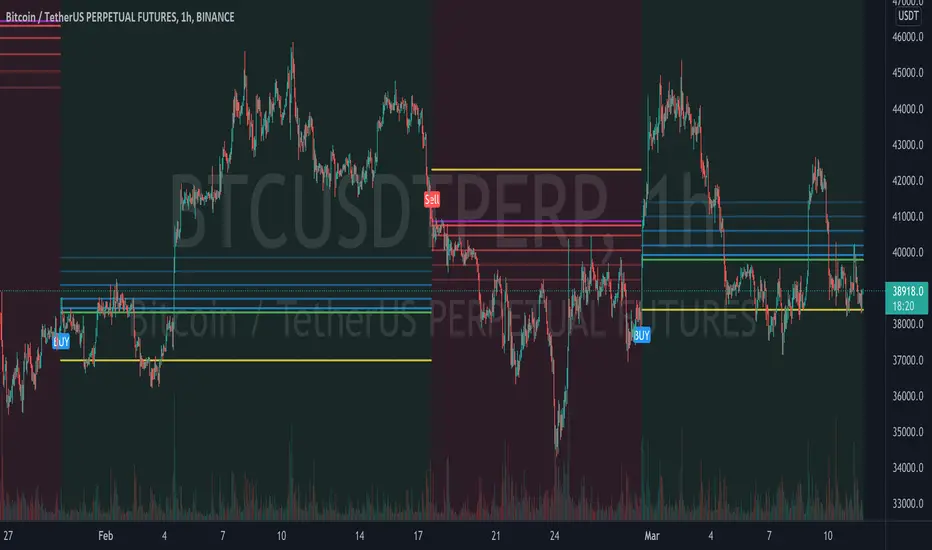
Signals Pirate™ Buy Sell SignalsSignalsPirate™ Algo Premium includes standard Buy and Sell signals on the chart, All-in-One Premium Market Dashboard with current trades, and a wide variety of customizability to help you create your own, unique trading strategies.
The main Input options are 'Reactivity' and 'Depth', which allow for a dynamic trend following strategy that works on all time frames and assets. Using these values the strategy will print the bundles main ‘Buy’ and ‘Sell’ signals to try and identify the trend early and accurately. Their main functions are to dynamically calculate volatility and current trend direction – but we’ve gone more in-depth below!
Reactivity:
Reactivity controls how quickly the Algo reacts to changes in trend. This part of the bundle takes into account the Average True Range (ATR) to gauge current market volatility and direction of the trend. Lowering the reactivity value will generate quicker reaction times of the algorithm as it will lower the threshold of volatility required for a signal to be generated. Therefore, it’ll show trades more frequently.
Depth:
Depth controls the position of the signals according to the trend swing. Calculated using a variation of the Average Direction Index (ADX) to measure the changes in prices over a given period, when running parallel to the Reactivity volatility filter the trend can be identified quickly and accurately on any given time frame or asset. Higher Depth will allow for less frequent and slower entries. In contrast, lower Depth will give more frequent and earlier entries.
The default settings are the best settings we’ve found so far but you can change them to build your own unique trading strategy. We’d recommend experimenting with these values to find the best results for the asset you are trading, and your own personal trading and investing style.
Direction for use:
1. Use on any asset class and time frame.
2. Fine tune the Reactivity (volatility) and Depth (trend sensitivity).
3. Enter Long on ‘Buy’ signal after candle close, enter Short on ‘Sell’ signal after candle close.
4. Exit position on opposite entry signal, for example if you’re currently in a Long position and a ‘Sell’ signal is printed, close your Long position at the candle close, even if you do not plan on shorting and vice versa.
As mentioned previously, this is a trend base system that dynamically operates to function with superior accuracy regardless of what you’re trading. But with the level of customisation available, this can easily be fine tuned to accommodate scalping, reversal trading, or even long term investing.
The Dashboard shows the most relevant and real-time information within a simple panel on the chart. It includes three sections. The first section shows Volatility, Volume, Current Sentiment. The second section shows Trends from a 1-minute timeframe to a Month. The third section shows current trade with Variable TP 1, TP 2, TP 3 (calculated using a combination of S/R levels and ATR values), and Maximum Profit for the current trade that could have been entered using this bundle.
We hope you love this all in one package, and it takes your trading and investing to the next level. Please let us know if you have any questions or queries regarding the logic behind the bundle, or if you have any suggestions for improvements etc. We love your feedback and are constantly striving to continuously improve!

Premium on BTC in Russia (%)
Indicator shows the relative "premium" or "discount" of buying BTC with Ruble vs the USD on Binance.
Figures are shown in %.
Positive figures indicate a "premium" vs USD, negative indicates a "discount".
Indicator is calculated on the close of the 4h candles of each input.

AnyChartI changed few lines of code from TradingView's original Open Interest indicator to make this one. I wanted to compare other charts to while entering my trade like looking at BTC when trading in alts. It has option to view any chart. Add other things to improve your analysis.

Market Hedge RatioRatio of crypto (total, Bitcoin, or Ethereum market cap) to major stable coins.
A low ratio suggests a lot of people are sitting in cash (sidelined if crypto rallies).
A high ratio suggests possible demand saturation.

TrendsThe Trends indicator is created for trend trading and (Bitsgap) crypto bots of crypto assets over longer time periods.
Works best for 4h, Daily and Weekly candles (even Monthly), but unsuitable for hourly candles and day trading.
This indicator shows you if a crypto pair is in a Bear, Bull or Sideways market.
The idea is to simplify decision making when to sell or buy, or what pairs to use with trading bots.
Stick to the rule of not having bots in a Bear trend!
- Blue = Bull trend
- Red = Bear trend
- Green = Sideways trend - which can be profitable with trading bots

Fiat Flow IndexFiat Flow Index by Lysergik
This indicator compares the change in stable-coin market caps and total crypto market cap and then using those comparisons creates an index from 0 to 100.
When the index spikes and tags the upper or lower threshold levels, it is assumed that a significant inflow or outflow (respectively) of fiat in the crypto space has occurred.
Note: The data of this indicator is independent of price action. It looks only at total market cap and stablecoin market caps to derive its data points.
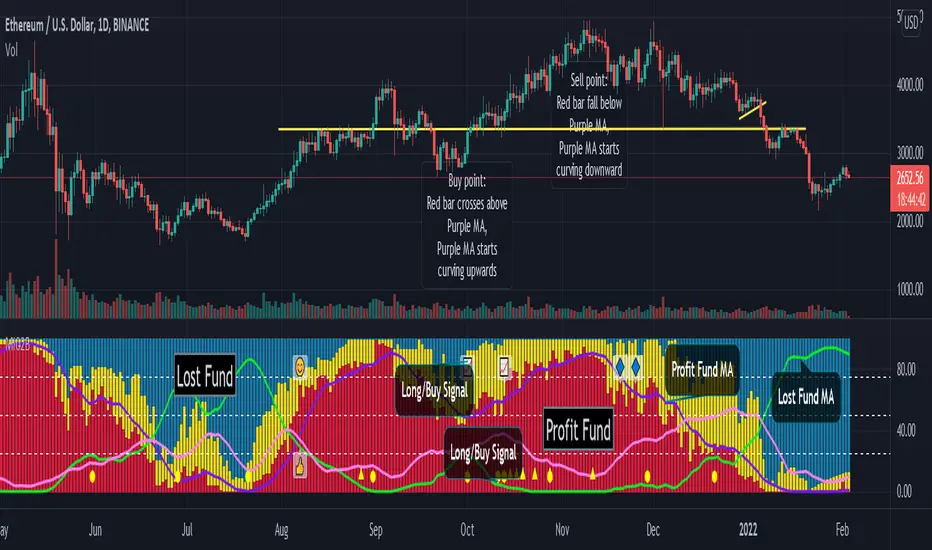
Smart Money Flow Pro (Dual Mode: MCD & MCDX) MI02bSmart Money Flow Pro (MI02b) indicator shows Buyer / Seller activities by calculating series of Price & Volume data, over a certain period of time.
It analyses Institutional fund possible behavior from the pool of data derived from price volume movement every trading day.
RED bar represents percentage of stock holders are currently in profit.
Purple line is RED bar's moving average.
Green bar represents percentage of stock holders are currently in loss.
Lime Green line is Green bar's moving average.
Yellow bar represents percentage of daily traders (buy & sell at the same day).
Pink line is Yellow bar's moving average.
RED bar > 50% shows institution fund has in control, uptrend is likely easier to continue.
BLUE bar > 50% shows retailer fund is stucked inside, downtrend is likely easier to continue.
Crossing of moving average lines indicates changing of trend (reversal sign):
1) Purple line up-crossed Green line - UPTREND
2) Green line up-crossed Purple line - DOWNTREND
Smart Money Flow Pro includes 6 Long/Buy signals (🔺, ⭕️, 👍, 😊, 📈, 🔷)
Each signals comes with individual alert setting.
Disclaimer:
This script indicator is solely for the purpose of education / opinion sharing only, and should not be construed as investment advice or recommendations to buy or sell any security.
Get your trade advise from a legit broker, you are responsible on your own trade.
Thank you.
Pattern Recognition Pullback StrategyThis script has been designed for use in botting Crypto spot / futures.
The intended use is send signals to a 3commas bot setup for the exchange. The bot uses candle measuring percentile nearest rank filters and range
breakouts to decide if the market is trending. When the market is trending it will look for pullbacks below a moving average and buy in the trend direction on a pullback discount.
With this script you will not be able to send tradingview signals, that is because it is a payed service and for security reasons I am the only one with access to making signals from this script. I will be uploading a second script which is the profit calculator. This way you can toy around to find your preferred settings for the bot and see the results it could have made.
I provided a user manual:
drive.google.com

Binance Open InterestIntro
A free and open source indicator that shows you open interest for Binance USDT and coin margin perpetual swap contracts, plotted as candlesticks.
Open interest means the total number of outstanding derivatives contracts, or in plain and simple English: the total amount of positions that traders have opened and still remain open.
Instructions
I've included data for a variety of cryptocurrencies that are quite popular right now.
However, since it's open source you can of course add any coin you want.
It's important to know that coin margin contracts have their open interest denominated in USD.
So if, for example, the ETH/USD perp shows a value of 470 million, that means 470 mil USD.
Tether margin contracts on the other hand are denominated in the coin itself.
So if, for example, the SOL/USDT perp shows a value of 1 million, that means 1 mil SOL worth of open contracts.
This is how the exchange created and denominated the contracts and I kept it this way to keep the data clean.
You could multiply that 1 mil SOL by the SOL price and it would show you the total open interest in USD terms of course, but that would make the candles look a bit funky.
If you look at the code you can see that for the coin margin contracts I've multiplied BTC open interest by a 100 and for altcoins I multiplied it by 10.
This is because of the Binance contract specifications, they use a multiplier of a 100 for bitcoin and altcoins have a multiplier of 10.
If you google "Binance Trading Rules of coin-margined Contracts" you'll find this info.
Some coins only have a USDT margin perp and not a coin margin perp.
YFI for example doesn't have a coin margin perp, but it is included in the list.
So if you select YFI and choose "coin margin" the indicator won't show anything.
The indicator still works, just select a different contract and you'll see open interest data appear again.
Access
It's free so just favourite it and you'll be able to add it to your chart and use it.
And it's also open source so you could just copy the code and make your own version of it.
Cheers.

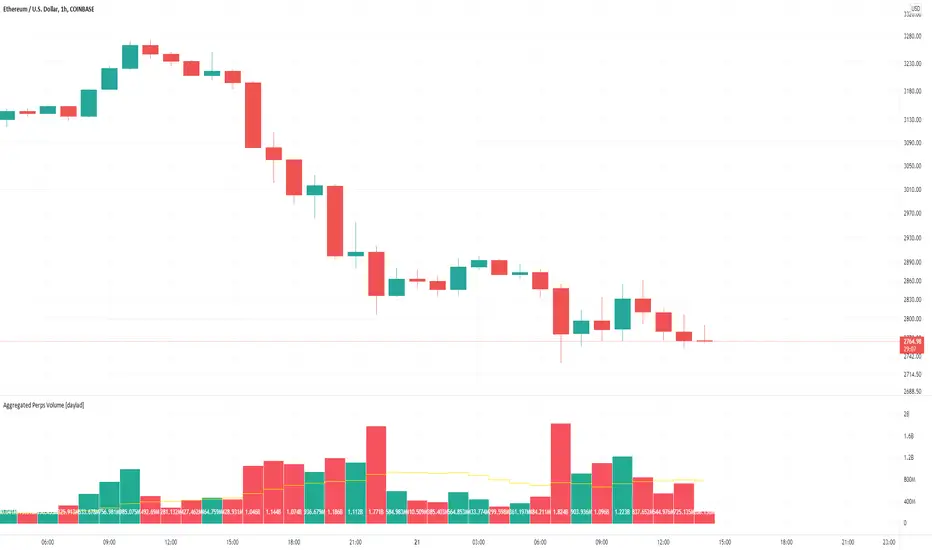
Aggregated Perps Volume [daylad]Same thing as my aggregated spot volume indicator, but for crypto perpetual futures contracts ().
Works with any crypto chart! No need to manually update symbols, this indicator will detect if there is a matching symbol and add it automatically!
The price labels display the total volume per bar in USD.
Pulls data for the following pairs (when available):
BINANCE: + base_symbol + PERP
BINANCE: + base_symbol + BUSDPERP
BINANCE: + base_symbol + USDTPERP
OKEX: + base_symbol + USDTPERP
OKEX: + base_symbol + PERP
FTX: + base_symbol + PERP
PHEMEX: + base_symbol + USD
BYBIT: + base_symbol + USD
BYBIT: + base_symbol + USDT
DERIBIT: + base_symbol + PERP
HUOBI: + base_symbol + PERP
BTSE: + base_symbol + PFC
EXAMPLE -- If you're looking at the COINBASE:SOLUSD chart the indicator will automatically aggregate the volume from BINANCE:SOLPERP, FTX:SOLPERP...etc... BYBIT:SOLUSDT...etc... BTSE:SOLPFC. If an exchange does not have a corresponding pair, then that pair returns 0 and does not add to the total.
If you have any questions feel free to ask. Happy trading!
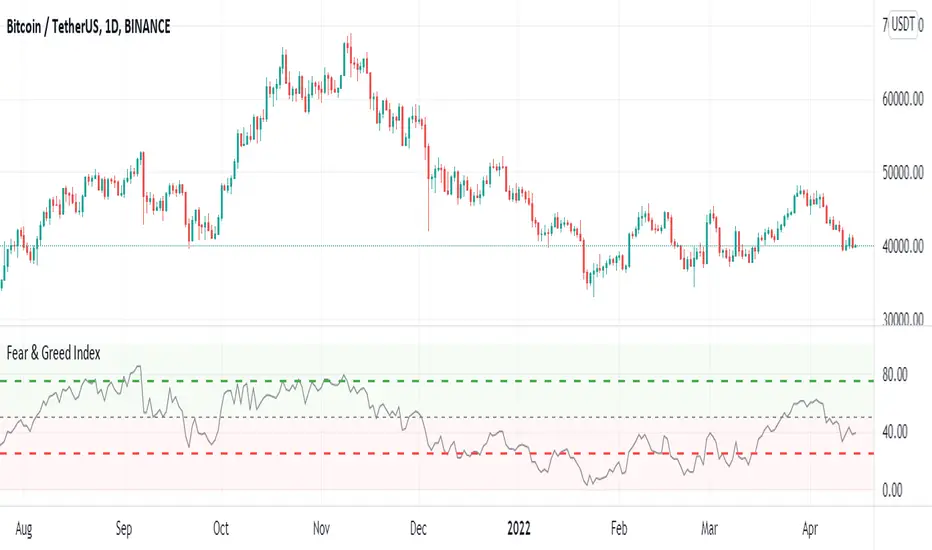
Crypto Fear & Greed IndexCrypto Fear & Greed Index
Crypto Fear & Greed Index is a metric to gauge sentiment levels in the crypto market.
The index starts from 0 to 100, with 0 meaning “Extreme Fear” (a potential bottom signal as investors are overly worried), and 100 meaning “Extreme Greed” (a potential top signal as investors are overly bullish).
Why Measure Fear and Greed?
In most markets, participants tend to be emotional with their behavior. Market participants often get overly greedy and FOMO when prices are on a euphoric rise, whilst they also tend to be overly fearful when prices are down and irrationally selling their positions at a loss.
Using the Crypto Fear and Greed Index
The Crypto Fear and Greed Index is commonly used to time entry into the market. As such, the Index is seen as less of an investment research tool and more of a market-timing tool. As stated by Warren Buffet, “Be fearful when others are greedy, and greedy when others are fearful.”
Calculation of the Crypto Fear and Greed Index
The Crypto Fear and Greed Index is based on three different factors – each factor is gauged from 0 to 100 and equally weighted to generate the index value.
The three factors are:
1. Stable coin flows
If there is a market sell-off and investors are expecting the value of their crypto investment to decline, they may rotate into stable coins as a safe haven.
As such, we look at the general trend of stable coins volume and activity to measure if the market is greedy or fearful.
2. Market Momentum
The performance of the top 18 coins relative to its 30-day average. A greater relative performance indicates greed and vice versa.
3. Top 18 Coins Price Strength
The number of coins of the top 18 coins hitting 90-days highs relative to those hitting 90-days lows. A greater number of coins hitting 90-days highs versus 90-days lows indicates greed and vice versa.
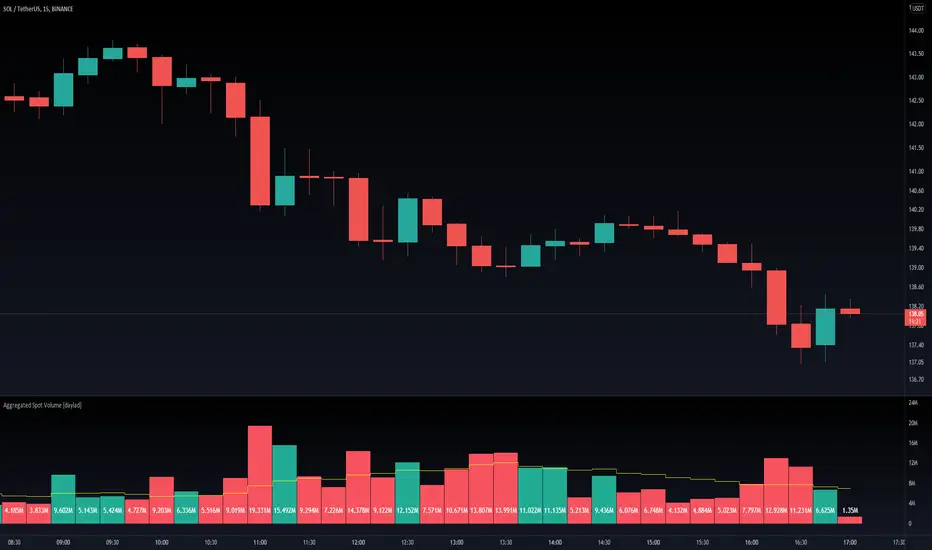
Aggregated Spot Volume [daylad]Works with any crypto chart! Automatically pulls and aggregates trading volume for the top stop pairs.
No need to manually update symbols, this indicator will detect if there is a matching symbol and add it.
Pulls data for the following pairs (when available):
COINBASE: + symbol + USD
COINBASE: + symbol + USDT
COINBASE: + symbol + EUR
BINANCE: + symbol + USDT
BINANCE: + symbol + BUSD
BINANCEUS: + symbol + USD
OKEX: + symbol + USDT
OKEX: + symbol + USDK
FTX: + symbol + USD
HUOBI: + symbol + USDT
BITFINEX: + symbol + USD
KRAKEN: + symbol + USD
KUCOIN: + symbol + USDT
CURRENCYCOM: + symbol + USD
POLONIEX: + symbol + USDT
UPBIT: + symbol + KRW
BITHUMB: + symbol + KRW
EXAMPLE -- If you are looking at the BINANCE:ADAUSDT chart, the indicator will automatically aggregate the volume from COINBASE:ADAUSD, COINBASE:ADAUSDT...etc... BINANCE:ADAUSDT...etc... BITHUMB:ADAKRW. If an exchange does not have a specific pair, then that pair returns 0 (does not add to the total).
If you have any questions feel free to ask. Happy trading!
Session Levels - Ultimate Range IndicatorSession Levels - Ultimate Range Indicator
Primarily developed for trading the E-MINI Futures Markets like NQ or ES from the CME Group,
but also more than suitable for Crypto or other instruments.
This indicator highlights the chosen session, which can be Globex, Asian, London and New York.
It plots the important levels and also renders the Opening Range as it forms (a.k.a. Initial Balance).
After the 1st hour Opening Range is finished, it can plot the Standard Deviations / Projections.
See below for a complete feature list.
All Opening Ranges on chart and for the New York session the Range Projections are turned on:
s3.tradingview.com
How to use (example):
If you are trading the Nasdaq Futures (NQ!)
Enable the Globex Overnight session. Basically in the Futures Market, the Globex session is everything outside of US trading hours of Stocks. This draws the important overnight levels, like the Low, 25%, 50%, 75% and the High.
Enable the New York Session with Levels and Opening Range. Generally, 70% of the time the 1st hour will put a Low or High of the day.
If the price is trading above the Globex Low, most likely the Low of the Day is formed and the price target for the day will be 1.5x Standard Deviation and 2x Standard Deviation.
[*} Deviation of the Initial Balance depends on the volume ad overall market structure.
** This is not financial advice or any guarantee **
Features:
Show each Session Highlighted on Intraday chart in it's own color (each session can be turned off and has customizable times and color)
Show Line Levels of each session: Low, 25%, 50%, 75% and the High (customizable color)
Show the Opening Range (Initial Balance) of the Asian, London and New York session. Note: NY has more options.
Opening Range is displayed as a box with level lines (customizable color)
Levels are drawn to the end of the NY Cash session (customizable time)
Show IB Standard Deviations 0.5 - 3.0. Calculated from the Opening Range (Initial Balance)
Option to display Higher Timeframe levels: Previous Day Open/Close and Previous Week Open/Close
All level lines and OR boxes size dynamically as the session progresses
Built in Alerts for when price hits key levels. e.g. Alert when price crosses the NY Opening Range High. Or an Alert when the first STDEV is hit.
Option to toggle display of drawings for Today's trading session only, or Show all recent session levels. This keeps the chart clean or not.
Extras:
The NY Opening Range also has a 50% level line
The NY Opening Bar can be highlighted separately
The Level Lines can have small labels turned on/off. Values are only shown on mouse over to keep a clean chart
Keep in mind:
1) This indicator works on all instruments, but on instruments with limited market hours, your chart setting
has to be set to "Extended Hours" otherwise. For example TSLA on NASDAQ.
2) The Exchange Time Zone for the CME Group is Chicago UTC-6. So the session times you configure in the settings menu are based on that timezone too.
3) Globex opens at 5pm CST and closes when the US session starts 8:30CST.
4) When enabling the Alerts in the Indicator settings, be sure to also create an alarm for this indicator using the Alarm function of Tradingview.

BTC Futures BasisShows various basis percentages in a table and plots historical basis. Also has an alert function for backwardation events. Useful for tracking bullish/bearish sentiment in BTC futures markets.
*Currently displays March and June futures for the following exchanges: Bitmex, Binance, Deribit, Okex, and FTX
Also displays CME Continuous Next Contract. All of the symbols are customizable.
-----------
Market-wide backwardation usually occurs during a heavy sell-off (such as a liquidation cascade).
**For getting alerts of backwardation events, I recommend creating an alert on the 1 minute chart with the condition "Any alert() function call". Alert level is customizable as well.
-----------
*NOTE!! : Futures contracts expire (obviously), so the contract symbols will need to be updated periodically. I will try to keep them updated going into the future.
**NOTE2!! : The alert() function does not track the CME contract. This is to avoid false triggers.

CRC.i Bollinger Bands ®This script is yet another variant of the famous Bollinger Bands® TA tool used to track price volatility as it deviates from the mean of a security using standard deviations (positive &negative). Built for my own personal preferences. But perhaps you might like it, too.
Includes
+ Chart Lines: price, upper and lower bands
+ User Options: SMA length, stdev value
+ Heads up Display (HUD) with TARGET's and other related stats
Bugs? Comments? Requests? Ping me @calmrat

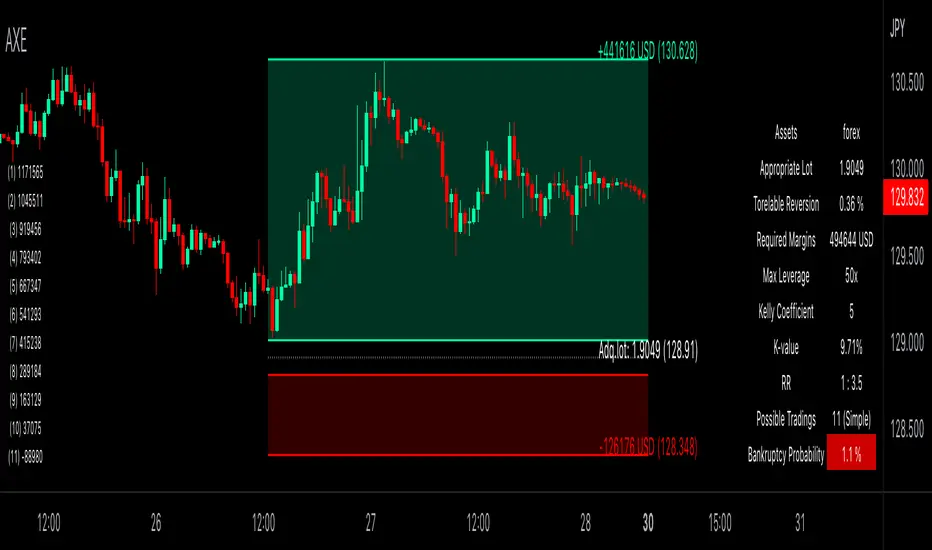
Auxiliary Equity Configurator (AXE)Auxiliary Equity Configurator (AXE) is a whole new level money management auxiliary that calculates statistically preferable lot based on the Account balance, Winning rate, Risk reward ratio, and Kelly multiplier configured a priori in the input panel.
On the chart, RR visualization bands, Expected balance history matrix in the worst successive trading loss (for displaying how many times you can trade with a given lot at simple/compound interest), and Info-table for the calculation details are shown.
Regarding RR visualization bands, whenever the Tolerable drawback input changes, the proper lot is calculated based on the given data. You can easily access how many lots you should possess and the take-profit/stop-loss price to set. A tolerable drawback can be placed in the quoted currency rate of the displayed chart, except the forex and part of CFD symbols (Gold, Silver, Platinum, WTI oil, Brent oil, Natural gas, and more in the future!) that is valued in Pips. Parameters are configurable in suit with the broker you are using. Also, RR visualization bands are brilliantly interactive, thanks to pine v5 interactive scripts.
The currency for Account balance and Tolerable drawback is automatically converted to USD for internal calculation; therefore, no mess-ups around thinking currency value conversion whatsoever! The design for each tool is highly customizable, too.
Unleash yourself from consuming the colossal amount of time thinking of money management with AXE!
Trend Volatility Tops and Bottoms
Big Picture:
Overall what this script try's to capture is bounces off of moving trend lines.
What you will see when using this script
one Green line, one red line, two gray lines and circles in colors blue, green, red, and purple.
RED AND GREEN LINES:
There are two trend lines, an upper and a lower line that are 1 to 2 standard deviations from the linear regression line formed by the closing price for a look back period. The green is the distance from the close price and the lower line. The red is the list from the close and the upper line. (you don't see the lower and upper lines, but yo do see the green and red lines)
The goal is too easily see when price is approaching those support and resistance levels.
GRAY LINES:
GRAY lines are a form of volatility metric. GRAYS represent the distance from the RED and GREEN lines talked about above. low volatility mean the two GRAY lines will be close and times of high volatility will be father apart.
COLORED CIRCLES:
the color circles represent possible bounce zones, when price is high or low for for a given time period.
PURPLE is caution that there could be a possible price drop
RED is a critical zone for rejection and price drop
BLUE is caution that there could be a possible price increase
GREEN is a critical zone for bounce and price increase
how its used
feel free to play around and Try new things but, how its intended to be used is on 4hr time Frame looking for longer term trends on assets that tend to be less volatile on average.
settings
some settings:
buy deviation, this will say how many standard deviations do you want the lower bounce line to be from the linear regression line
sell deviation, this will say how many standard deviations do you want the upper bounce line to be from the linear regression line
dist to zero buy: how close dose the price has to be to put out a possible bounce.
Recap
-red and purple = possible upcoming price drop... red is more critical than purple
-green and blue = possible upcoming price increase... green is more critical than blue
-use on less volatile assents and on 4hr timeframe
good luck!

Support and ResistanceThis is a multi-timeframe indicator that lets you draw support and resistance lines based on the timeframe you choose. This means you can place daily support and resistance levels on lower timeframes such as the 1 minute timeframe. The cool thing about this indicator is that it uses the atr value, which is different from traditional support and resistance indicators that look at pivot points or zig zags to figure out where support and resistance lines should be placed. This one looks at pivot points to figure out where the atr should be first, then places lines in the upward and downward direction based on the atr value.
This means that you are able to see all future levels of support and resistance even if the price has never been at that level
Features:
1. MTF (Multi-timeframe) plotting. Allows you to plot resistance and support lines based on the daily timeframe you select. This means you can see major daily support and resistance levels on minor timeframes such as the 1 minute. These levels tend to act as stronger support and resistance levels compared to micro timeframe levels
2. Tells you future price levels. Since this indicator uses ATR indicator it shows you all future support and resistance levels where a ticker has never been
Inputs:
1. Timeframe: Select the timeframe you wish the indicator to be used on. My personal preference is the daily timeframe
2. Pivot Period: Changes the lines based on the pivot period you choose, I personally like the 5 pivot period
3. Lookback Period: How many bars should be taken into account, to determine ATR value and other calculations. Personally like the 150 bar lookback period, but if your trading extremely volatile tickers I suggest changing it to 50.
4. Line Closeness: This determines how far apart the lines are from each other. If it it set to 1 it means it will place each line 1 ATR value apart from each other. Lower the number closer the lines are to each other and vice versa
5. Number of lines plotted: This will change how many lines are plotted onto your chart. Default is 150, but if you want a lower amount 50 works as well
6. Show label: This just adds the number at which each line appears at
Errors:
1. Sometimes the lines won't show up, this is because there is not enough history for the indicator to take in. The standard amount of bars needed is 150, you can change it to 50 which sometimes works better for more violatile tickers.

Crypto Market Sentiment B [Morty]The Crypto Market Sentiment B indicator uses perpetual contracts premium to show the fear & greed mood of the Crypto market.
When the market is showing greed at relative highs, it is often a good selling point.
Markets in a panic mood with stable coins flowing back into cryptocurrencies are often bottom reversal points.
Berish divergence of the indicator may signal a major negative price move.
Crypto Market Sentiment Indicator A and Indicator B can be used together.
Here is the link of Indicator A.

Crypto Market Sentiment A [Morty]The Crypto Market Sentiment A indicator shows stablecoin flows of the Crypto market.
It can be used to look at the general trend of stablecoins activity.
When the market is showing greed at relative highs, it is often a good selling point. There will be a market sell-off and investors are expecting the value of their crypto investment to decline, they may rotate into stablecoins as a safe haven, whilst giving them the quick flexibility of deploying capital back into the crypto market easily.
Markets in a panic mood with stable coins flowing back into cryptocurrencies are often bottom reversal points.
Crypto Market Sentiment Indicator A and Indicator B can be used together.
Here is the link of Indicator B.
