BTC Profitable Wallets StrategyBTC Profitable Wallets Strategy - plots the percentage of profitable BTC wallets and places long orders when the profitable wallet share crosses above 50%, historically a very accurate point to catch the next Bull Run early.
The only setting is a smoothing option using the Moving Average method and length of your choice.
On Chain Data is queried from IntoTheBlock.
This is a 'HODL' strategy, with no exit given. If you'd like to see the historical performance check the Open Profit or place a sell order at the current date.
Kripto

Ultra Moving Average Rating Trend StrategyThis is a technical analysis strategy based initially on the rating strategy, but fully adapted and converted to moving average rating.
In this case we are using: Ichimoku, SMA, EMA, ALMA, SMMA, LSMA, VWMA, DEMA, HMA, KAMA FRAMA, VIDYA, JMA, TEMA, ZLEMA, TRIMA and T3 moving averages.
With all of them together I am making an index.
Rules for entry and exit:
If % percentage of all the moving averages is telling to go long , we go long or exit short. And viceversa for short.
If there are any questions, please let me know !

RSI with Slow and Fast MA Crossing Strategy (by Coinrule)This strategy utilises 3 different conditions that have to be met to buy and 1 condition to sell. This strategy works best on the ETH/USDT pair on the 4-hour timescale.
In order for the strategy to enter the trade, it must meet all of the conditions listed below:
ENTRY
RSI increases by 5
RSI is lower than 70
MA9 crosses above MA50
To exit a trade, the below condition must be met:
EXIT
MA50 crosses above MA9
This strategy works well on LINK/USDT on the 1-day timeframe, MIOTA/USDT on the 2-hour timeframe, BTC/USDT on the 4-hour timeframe, and BEST/USDT on the 1-day timeframe (and 4h).
Back-tested from 1 January 2020.
The strategy assumes each order is using 30% of the available coins to make the results more realistic and to simulate you only ran this strategy on 30% of your holdings. A trading fee of 0.1% is also taken into account and is aligned to the base fee applied on Binance.

BTC Hashrate ribbonsBTC Hash Rate ribbons / Hash Rate cross
This strategy goes long when BTCs Hash Rate 30 day moving average crosses above the 60 day moving average, signifying that miner capitulation is over and recovery has started.
When the opposite signal is given, which signifies the beginning of miner capitulation, the strategy goes short (or flat, depending on configuration). This is generally considered the most popular Hash Rate related strategy.
The strategy is based on this medium article: medium.com
Thanks to the recent integration of IntoTheBlock data into Tradingview, we can now effortlessly show Hash Rate data on our chart,
keep in mind however, that IntoTheBlock doesn't provide Hash Rate data on timeframes below daily, so this strategy is based used on the daily, weekly or even monthly time frames.
Hash Rate definition:
The Bitcoin hash rate is the number of times per second that computers on the Bitcoin network are hashing data to verify transactions and perform the encryption that secures the network. The hash rate is an indicator of how healthy the Bitcoin network is at any given time, and is driven primarily by difficulty mining and the number of miners. Generally, a high hash rate is considered a good thing.
More precisely, the Bitcoin hash rate is the number of times per second that computers on the Bitcoin network are hashing data to verify transactions and perform the encryption that secures the network.

Ichimoku Cloud and Bollinger Bands (by Coinrule)The Ichimoku Cloud is a collection of technical indicators that show support and resistance levels, as well as momentum and trend direction. It does this by taking multiple averages and plotting them on a chart. It also uses these figures to compute a “cloud” that attempts to forecast where the price may find support or resistance in the future.
The Ichimoku Cloud was developed by Goichi Hosoda, a Japanese journalist, and published in the late 1960s. It provides more data points than the standard candlestick chart. While it seems complicated at first glance, those familiar with how to read the charts often find it easy to understand with well-defined trading signals.
The Ichimoku Cloud is composed of five lines or calculations, two of which comprise a cloud where the difference between the two lines is shaded in.
The lines include a nine-period average, a 26-period average, an average of those two averages, a 52-period average, and a lagging closing price line.
The cloud is a key part of the indicator. When the price is below the cloud, the trend is down. When the price is above the cloud, the trend is up.
The above trend signals are strengthened if the cloud is moving in the same direction as the price. For example, during an uptrend, the top of the cloud is moving up, or during a downtrend, the bottom of the cloud is moving down.
The Bollinger Bands are among the most famous and widely used indicators. A Bollinger Band is a technical analysis tool defined by a set of trendlines plotted two standard deviations (positively and negatively) away from a simple moving average ( SMA ) of a security's price, but which can be adjusted to user preferences. They can suggest when an asset is oversold or overbought in the short term, thus providing the best time for buying and selling it.
This strategy combines the Ichimoku Cloud with Bollinger Bands to better enter trades.
Long orders are placed when these basic signals are triggered.
Long Position:
Tenkan-Sen is above the Kijun-Sen
Chikou-Span is above the close of 26 bars ago
Close is above the Kumo Cloud
The closing price is greater than the upper standard deviation of the Bollinger Bands
Short Position:
Tenkan-Sen is below the Kijun-Sen
Chikou-Span is below the close of 26 bars ago
Close is below the Kumo Cloud
The upper standard deviation of the Bollinger Band is greater than the closing price
The script is backtested from 1 January 2022 and provides good returns.
The strategy assumes each order is using 30% of the available coins to make the results more realistic and to simulate you only ran this strategy on 30% of your holdings. A trading fee of 0.1% is also taken into account and is aligned to the base fee applied on Binance.
This script also works well on BTC 30m/1h, ETH 2h, MATIC 2h/30m, AVAX 1h/2h, SOL 45m timeframes

[Crypto] Supertrend - ADX - Reversal Candle* Commission: 0.06% = Binance future fee.
1. ADX INDICATOR: 1h & 4h timeframe have a strong strength for open trade.
- ADX smoothing: 14.
- DI length: 14.
- ADX STRONG > 25.
2. SUPERTREND INDICATOR:
- Long trend when closes candle is above the green line.
- Short trend when closes candle is below the red line.
3. REVERSAL CANDLES DETECT:
- Cancels the Short trend if occurs 5 bullish reversal candles.
- Cancels the Long trend if occurs 5 bearish reversal candles.
- Cancels the Short trend if occurs bullish Engulfing reversal candles.
- Cancels the Long trend if occurs bearish Engulfing reversal candles.
4. OPEN POSITION RULE:
- BUY/LONG: reject to Supertrend at current timeframe.
- SELL/SHORT: reject to Supertrend at current timeframe.
5. Autotrade with Money management: requires Pro, Pro +, Premium Tradingview & Webhook service.
6. Winrate of 129 coin pairs of Binance future
7. DEEP BACKTEST:
- BITCOIN ALL TIME HISTORY INDEX
- ETHEREUM ALL TIME HISTORY INDEX
- LITECOIN BINANCE FUTURE
- BINANCE COIN BINANCE FUTURE
- XRP BINANCE FUTURE

Bitfinex Shorts StratOverview
This strat applies the data from BITFINEX:USDSHORTS to the RSI indicator in order to provide SHORT/LONG entries as the number of contracts goes up and down. Although Bitfinex has lost relevance over the years its generally considered an exchange dominated by smart money rather than retail. I'd like to see if any insights can be gained by following their trading behaviour.
How to use
Select the underlying security you wish to trade and load the indicator. Select the appropriate short security by searching in the Bitfinex Short Symbol. RSI settings apply to short symbol not the actual asset. Strategy shorts the underlying asset when shorts rise and longs when they drop. The shorts symbol will follow the value of the loaded chart. Works best on 4 hour chart.
Why use shorts only rather than both long/shorts?
Bitfinex longs seem to be on a long-term uptrend accounting for 25x the number of shorts. Might be enormous confidence on part of the whales, but more likely reflects selling spot and buying perp. Given the size disparity and price action I don't think longs info is adding much.
Problems with script:
a) We don't really know the intentions of short players (e.g. speculation or hedging spot)
b) The script uses a decline in shorts as a long signal
c) RSI is a blunt tool there are probably better options for calculating high/lows in shorts
d) Shorts are accumulated both at highs and also when BTC price is already heavily trending down. This suggests some are speculative (at the highs) or protective/hedging during a decline
Takeaways:
Based on this strat Bitfinex whales are more wrong than right.
Results don't carry across well into altcoins using the accompanying short symbol. However, what is interesting is that applying the BITFINEX:BTCUSDSHORTS to altcoin charts does work pretty well.
Strat needs some refinement to control for entries under different circumstances.
Probably not a great idea to use this as a strategy in isolation, but highlights how Bitfinex whale behaviour is a good gauge to follow.

Ichimoku Cloud with ADX (By Coinrule)The Ichimoku Cloud is a collection of technical indicators that show support and resistance levels, as well as momentum and trend direction. It does this by taking multiple averages and plotting them on a chart. It also uses these figures to compute a “cloud” that attempts to forecast where the price may find support or resistance in the future.
The Ichimoku Cloud was developed by Goichi Hosoda, a Japanese journalist, and published in the late 1960s. It provides more data points than the standard candlestick chart. While it seems complicated at first glance, those familiar with how to read the charts often find it easy to understand with well-defined trading signals.
The Ichimoku Cloud is composed of five lines or calculations, two of which comprise a cloud where the difference between the two lines is shaded in.
The lines include a nine-period average, a 26-period average, an average of those two averages, a 52-period average, and a lagging closing price line.
The cloud is a key part of the indicator. When the price is below the cloud, the trend is down. When the price is above the cloud, the trend is up.
The above trend signals are strengthened if the cloud is moving in the same direction as the price. For example, during an uptrend, the top of the cloud is moving up, or during a downtrend, the bottom of the cloud is moving down.
DMI is simple to interpret. When +DI > - DI, it means the price is trending up. On the other hand, when -DI > +DI , the trend is weak or moving on the downside. The ADX does not give an indication about the direction but about the strength of the trend.
Typically values of ADX above 25 mean that the trend is steeply moving up or down, based on the -DI and +D positioning. This script aims to capture swings in the DMI, and thus, in the trend of the asset, using a contrarian approach.
Trading on high values of ADX , the strategy tries to spot extremely oversold and overbought conditions. Values of ADX above 45 may suggest that the trend has overextended and is may be about to reverse.
This strategy combines the Ichimoku Cloud with the ADX indicator to better enter trades.
Long/Short orders are placed when these basic signals are triggered.
Long Position:
Tenkan-Sen is above the Kijun-Sen
Chikou-Span is above the close of 26 bars ago
Close is above the Kumo Cloud
MACD line crosses over the signal line
-DI is greater than +DI
ADX is greater than 45
Short Position:
Tenkan-Sen is below the Kijun-Sen
Chikou-Span is below the close of 26 bars ago
Close is below the Kumo Cloud
MACD line crosses under the signal line
+DI is greater than -DI
ADX is less than 45
The script is backtested from 1 January 2022 and provides good returns.
The strategy assumes each order is using 30% of the available coins to make the results more realistic and to simulate you only ran this strategy on 30% of your holdings. A trading fee of 0.1% is also taken into account and is aligned to the base fee applied on Binance.
This script also works well on MATIC (15m timeframe), ETH (5m timeframe), and SOL (15m timeframe).

ALMA/EMA/SRSI Strategy + IndicatorBack with another great high hit rate strategy!!
Disclaimer* This strategy was sampled using source code written by @ClassicScott , as referred to in the script, there is a clear line where the source code was scripted by myself.
This Strategy consists of three key factors, the ALMA, EMA crossover, and a Stochastic Rsi
ALMA: The Alma is the step line shown, turning green and red at select times. This average value gives general oversight of the macro movement of price action. and this particular one was coded by Mr.ClassicScott.
EMA crossover: At the input screen you are given an option of the fast and slow ema's. The default is solely for the hit rate and correlation to the Alma of this strategy. The arrows you see depicted on the chart are the crossover events happening.
Stochastic Rsi: The Stochastic Rsi is a stochastic value, using data sampled from the rsi. The use of this indicator in my strategy is to prevent entries when too overbought and oversold, as well as closures and vice versa, to prevent holding bags either way.
Fixed % TP: In the input screen you are given a take profit and stop loss percentage, for good R/R the hit rate will take a notch down, but with no R/R it will be near perfect.
How to use this:
Add it to your chart to get the strategy inputs. (The strategy is really only useful on a 15min TF. However the indicator within it can be used on anything at anytime!)
Watch the yellow and aqua moving averages, these are your ema's and crossover's will trigger signals based on your integer inputs.
Find Correlation between other leading indicators, as well as crossover's down/up and a red/green alma.
DO NOT use the arrows as buy/sell signals. These are simply to show ema's are crossing under or over. Momentum indicator's paired with this can be useful to determine if it could be a buy signal or sell signal.
Cheat Code's Notes:
Almost at 1000 boosts!!! I appreciate the support from everyone and I will keep trying my best to deliver quality strategies for the people.
-Cheat Code
BYBIT:BTCUSDT

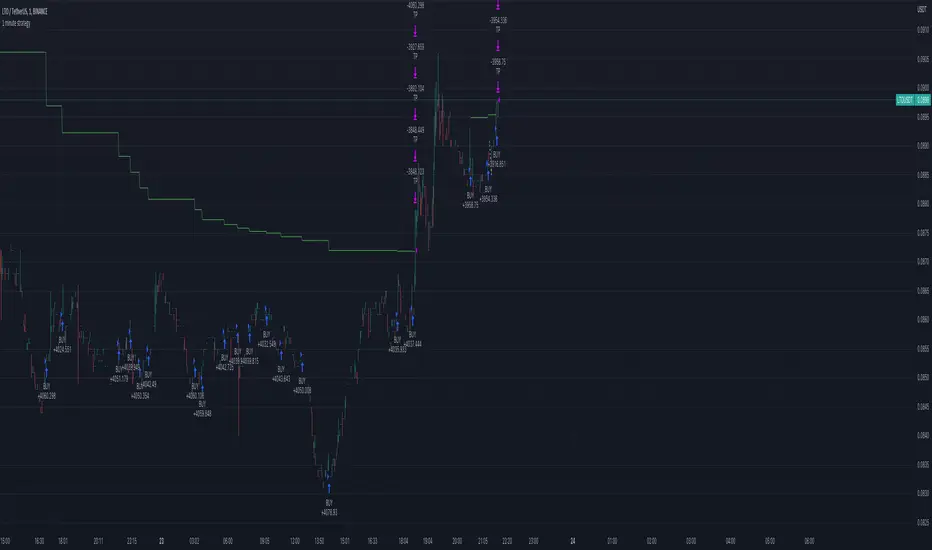
1 minute crypto strategy (MTF ZigZag)Please read the following explanation and notes before using this strategy.
This strategy is based on pyramiding. It uses two trend indicators(zigzag) in two different timeframes. One can be used to identify trend in higher timeframe and the other can be used to identify trend in smaller time frame. You can change them according to your preference. The default timeframes are set the same so the strategy only opens the trades according to one timeframe (20min). You can change the timeframe of the trend indicators to any timeframe in the settings but first you should add that timeframe to your chart timeframe so you can see that timeframe in the settings.
The first timeframe is for lower timeframe trend identification and the second timeframe is for higher timeframe identification in the settings.
IMPORTANT NOTES:
1. This strategy works best with low cap high volatile Cryptos. It is riskier on big cap cryptos in long term since it takes longer for them to recover from a big drop.
2. This strategy works in any timeframe. The lower the TF the higher profit.
3. This strategy is LONG only (spot).
4. It is very important to run a deep backtest (for example 1 year) and change the settings accordingly on the cryptos you want to trade to see how it performs in longterm.
5. The default pyramiding value is 30 and 3.33% of the portfolio (100/30=3.33%) is used for each trade. It means the strategy opens maximum 30 trades before the TP is hit. If you change the pyramiding you should also change order size as well in order for the strategy to show the exact calculation (your portfolio amount percentage/pyramiding value=ordersize percentage). If you increase pyramiding value the strategy performs safer in long term.
6. The default TP is 1% and the default SL is 80%. You can change the settings according to the backtest on the coins you want to trade. But it is better not to increase the TP.
7. The indicators don't repaint.
8. Please make sure to backtest and fully understand the way this strategy works before using it.
Fast v Slow Moving Averages Strategy (Variable) [divonn1994]This is a simple moving average based strategy that takes 2 moving averages, a Fast and a Slow one, plots them both, and then decides to enter a 'long' position or exit it based on whether the two lines have crossed each other. It goes 'long when the Fast Moving Average crosses above the Slow Moving Average. This could indicate upwards momentum in prices in the future. It then exits the position when the the Fast Moving Average crosses back below. This could indicate downwards momentum in prices in the future. This is only speculative, though, but sometimes it can be a very good indicator/strategy to predict future action.
I've tried some strategy settings and I found different promising strategies. Here are a few:
BTCUSD ( BitStamp ) 1 Day Timeframe : EMA, Fast length 25 bars, Slow length 62 bars => 28,792x net profit (default)
BTCUSD ( BitStamp ) 1 Day Timeframe : VWMA, Fast length 21 bars, Slow length 60 bars => 15,603x net profit
BTCUSD ( BitStamp ) 1 Day Timeframe : SMA, Fast length 18 bars, Slow length 51 bars => 19,507x net profit
BTCUSD ( BitStamp ) 1 Day Timeframe : RMA, Fast length 20 bars, Slow length 52 bars => 5,729x net profit
BTCUSD ( BitStamp ) 1 Day Timeframe : WMA, Fast length 29 bars, Slow length 60 bars => 19,869x net profit
Features:
-You can choose your preferred moving average: SMA , EMA , WMA , RMA & VWMA .
-You can change the length average for each moving average
-I made the background color Green when you're currently in a long position and Red when not. I made it so you can see when you'd be actively in a trade or not. The Red and Green background colors can be toggled on/off in order to see other indicators more clearly overlayed in the chart, or if you prefer a cleaner look on your charts.
-I also have a plot of the Fast moving average and Slow moving average together. The Opening moving average is Purple, the Closing moving average is White. White on top is a sign of a potential upswing and purple on top is a sign of a potential downswing. I've made this also able to be toggled on/off.
Let me know if you think I should change anything with my script, I'm always open to constructive criticism so feel free to comment below :)

Ichimoku Cloud with MACD (By Coinrule)The Ichimoku Cloud is a collection of technical indicators that show support and resistance levels, as well as momentum and trend direction. It does this by taking multiple averages and plotting them on a chart. It also uses these figures to compute a “cloud” that attempts to forecast where the price may find support or resistance in the future.
The Ichimoku Cloud was developed by Goichi Hosoda, a Japanese journalist, and published in the late 1960s. It provides more data points than the standard candlestick chart. While it seems complicated at first glance, those familiar with how to read the charts often find it easy to understand with well-defined trading signals.
The Ichimoku Cloud is composed of five lines or calculations, two of which comprise a cloud where the difference between the two lines is shaded in.
The lines include a nine-period average, a 26-period average, an average of those two averages, a 52-period average, and a lagging closing price line.
The cloud is a key part of the indicator. When the price is below the cloud, the trend is down. When the price is above the cloud, the trend is up.
The above trend signals are strengthened if the cloud is moving in the same direction as the price. For example, during an uptrend, the top of the cloud is moving up, or during a downtrend, the bottom of the cloud is moving down.
The MACD is a trend following momentum indicator and provides identification of short-term trend direction. In this variation it utilises the 12-period as the fast and 26-period as the slow length EMAs, with signal smoothing set at 9.
This strategy combines the Ichimoku Cloud with the MACD indicator to better enter trades.
Long/Short orders are placed when three basic signals are triggered.
Long Position:
Tenkan-Sen is above the Kijun-Sen
Chikou-Span is above the close of 26 bars ago
Close is above the Kumo Cloud
MACD line crosses over the signal line
Short Position:
Tenkan-Sen is below the Kijun-Sen
Chikou-Span is below the close of 26 bars ago
Close is below the Kumo Cloud
MACD line crosses under the signal line
The script is backtested from 1 June 2022 and provides good returns.
The strategy assumes each order is using 30% of the available coins to make the results more realistic and to simulate you only ran this strategy on 30% of your holdings. A trading fee of 0.1% is also taken into account and is aligned to the base fee applied on Binance.
This script also works well on MATIC (1h timeframe), AVA (45m timeframe), and BTC (30m timeframe).

Short Term RSI and SMA Percentage ChangeThis strategy utilises common indicators like RSI and moving averages in order to enter and exit trades. The Relative Strength Index (RSI) is a momentum indicator that has a value between 0 and 100, where a value greater than 70 is considered overbought and a value less than 30 is oversold. If the RSI value is above or below these values, then it can signal a possible trend reversal.
The second indicator used in this strategy is the Simple Moving Average (SMA). A SMA is an arithmetic moving average calculated by adding recent prices and then dividing that figure by the number of time periods in the calculation average. For example, one could add the closing price of a coin for a number of time periods and then divide this total by that same number of periods. Short-term averages respond quickly to changes in the price of the underlying coin, while long-term averages are slower to react.
Long/Exit orders are placed when three basic signals are triggered.
Long Position:
RSI is greater than 50
MA9 is greater than MA100
MA9 increases by 6%
Exit Position:
Price increases 5% trailing
Price decreases 5% trailing
The script is backtested from 1 May 2022 and provides good returns.
A trading fee of 0.1% is also taken into account and is aligned to the base fee applied on Binance.
This script also works well on AVAX 45m/1h, MATIC 15m/45m/1h and ETH 4h.

[B_2] 15min Crypto (Based on Technical Analysis)Republish.
HOW IT WORKS:
+ Open Long: When price close above Kumo Cloud 15m, SuperTrend 15m, RSI > 50, MACD signal (12,26,19) >0, break up Pivot High previous. Dont open long when price close just below resistants in higher timeframe (SuperTrend 2H, 4H).
+ Exit Long: When price hit TPs or SL or having Short Signals.
+ Open Short: When price close below Kumo Cloud 15m, SuperTrend 15m, RSI < 50, MACD signal (12,26,19) <0, break down Pivot Low previous.
+ Exit Short: When price hit TPs or SL or having Long Signals.
HOW TO DO IT:
Very easy to use this script. It only has 2 parts: SETUP ENTRY and SETUP EXIT.
1. SETUP ENTRY:
This strategy uses the rule of dividing capital to enter multiple orders. For example, a common rule 5-3-2 (ie: total capital is 100%, entry 1 is 50%, entry 2 is 30% and entry 3 is 20%). In this strategy, I split my capital into 4 entries. You can customize the capital percentage and price deviation for each entry.
2. SETUP EXIT:
+ Multi profit.
+ Stoploss: you have two options: Stoploss based on percentage or ATR.
+ When price hit TP1, you have two options: only move Stoploss to entry or active trailing.
BACKTEST: You can backtest this strategy on coins: ETH, CRV , RUNE, MATIC, SRM and some like: MKRUSDTPERP , AAVEUSDTPERP , SOLUSDTPERP , ETCUSDTPERP , FILUSDTPERP , BALUSDTPERP , NEARUSDTPERP , SRMUSDTPERP , ALPHAUSDTPERP , DGBUSDTPERP, ...
If you want use this scripts with setup alert or open code, please inbox to me, you are always welcome.

Ichimoku Cloud with RSI (By Coinrule)The Ichimoku Cloud is a collection of technical indicators that show support and resistance levels, as well as momentum and trend direction. It does this by taking multiple averages and plotting them on a chart. It also uses these figures to compute a “cloud” that attempts to forecast where the price may find support or resistance in the future.
The Ichimoku Cloud was developed by Goichi Hosoda, a Japanese journalist, and published in the late 1960s. It provides more data points than the standard candlestick chart. While it seems complicated at first glance, those familiar with how to read the charts often find it easy to understand with well-defined trading signals.
The Ichimoku Cloud is composed of five lines or calculations, two of which comprise a cloud where the difference between the two lines is shaded in.
The lines include a nine-period average, a 26-period average, an average of those two averages, a 52-period average, and a lagging closing price line.
The cloud is a key part of the indicator. When the price is below the cloud, the trend is down. When the price is above the cloud, the trend is up.
The above trend signals are strengthened if the cloud is moving in the same direction as the price. For example, during an uptrend, the top of the cloud is moving up, or during a downtrend, the bottom of the cloud is moving down.
This strategy combines the Ichimoku Cloud with the RSI indicator to better enter trades.
Long/Short orders are placed when three basic signals are triggered.
Long Position:
Tenkan-Sen is above the Kijun-Sen
Chikou-Span is above the close of 26 bars ago
Close is above the Kumo Cloud
RSI is greater less than 50
Short Position:
Tenkan-Sen is below the Kijun-Sen
Chikou-Span is below the close of 26 bars ago
Close is below the Kumo Cloud
RSI is greater than 50
The script is backtested from 1 June 2022 and provides good returns.
The strategy assumes each order is using 30% of the available coins to make the results more realistic and to simulate you only ran this strategy on 30% of your holdings. A trading fee of 0.1% is also taken into account and is aligned to the base fee applied on Binance.
This script also works well on SOL (45m timeframe), BNB (1h timeframe), and ETH (1h timeframe).

Gators Oscillator - Bitcoin Scalp Trader(T&M/e V3!!)Gator's Oscillator:
**For reference, all numbers, and settings displayed on the input screen are only what I HAVE FOUND to be profitable for my own strategy, Yours will differ. This is not financial advice and I am not a financial advisor. Please do your due diligence and own research before considering taking entries based on this strategy and indicator. I am not advertising investing, trading, or skills untaught, this is simply to help incorporate into your own strategy and improve your trading journey!**
INPUTS:
EV: This is an integer value set to default at 55. This value is equated to the lead value, volatility measurement, and standard deviation between averages
EV 2: This integer is used as the base value and is meant to always be GREATER THEN EV, the default is set at 163. There should be at least a 90+ integer difference between EVs for data accuracy.
EV TYPE & EV TYPE 2: This option only affects the output for the moving average histograms. (and data inserted for strategy)
Volatility Smoothing: This is the smoothness of the custom-made volatility oscillator. I have this default at 1 to show time-worthy-term (3.9%+) moves or significant trends to correspond with the standard deviation declination between EVMA and EVMA2.
Directional Length: This is the amount of data observed per candle in the bull versus bear indicator.
Take Profit: Pre-set takes profit level that is set to 4 but can be adjusted for user experience.
Style:
Base Length: Columns equated using a custom-made statistical equation derived from EV TYPE 2+EV2 to determine a range of differential in historic averages to a micro-scale.
Lead Length: Columns equated using a custom-made statistical equation derived from EV TYPE+EV to determine a range of differential in historic averages to a micro-scale.
Weighted EMA Differential: Equation expressing the differences between exponential and simple averages derived from EV+EV Type 2. Default is displaying none, but optional for use if found helpful.
Volatility: Represents volatility from multiple data sets spanning from Bollinger bands to HPV and translated through smoothing.
Bull Strength: The strength of Bulls in the current trend is derived from a DMI+RSI+MACD equation to represent where the trend lies.
Bear Strength: The strength of Bears in the current trend is derived from a DMI+RSI+MACD equation to represent where the trend lies.
(NEW) Standard Deviation between Moving Averages: Use this logarithmic indicator depicted as circles to help determine whether a move is a fake out or not. Compare the circles with the volatility line, if you see them deviating away, it is either a bull/bear trap or trend continuation is imminent until they correlate back together.
CHEAT CODE'S NOTES:
Do not use this indicator on high leverage. I have personally used this indicator for a week and faced a max of 8% drawdown, albeit painful I was on low leverage and still closed on my take profit level.
85% is not 100% do not overtrade using this indicator's entry conditions if you have made 4 consecutive profitable trades.
Mess around with the input values and let me know if you find an even BETTER hit rate, 30+ entries, and a good drawdown!!
V2 UPGRADES:
*Increased Opacity on Bull Bear Columns
*Removed the Stop Loss Input option
*Decreased EV2 to a default of 143 for accuracy
*Added additional disclaimers in the description
* Removed Bull/Bear offset values for accuracy
V3 UPGRADES:
*ADDED THE EMA DIFFERENTIAL FROM SMA STANDARD DEVIATION INDICATOR. REPRESENTED BY PURPLE BARS THAT PLOT BRIGHT AT EXTREME LEVELS (Translate this to the EMA's and SMA's are very far apart) This is a fantastic way to resolve volatility and momentum in one indicator!!
*Line Width increased for volatility
*plot's for Oversold Alma reduced to 3, also adjusted the plot shape to arrows corresponding to 'overbought/oversold values. Look for a cross-over from green/red plot to transparent for best signals.
*Histograms for bull/bear strength correspond to an increase or decrease in value
*Input screen converted into groups, with bull/bear color inline
*Converted base/lead length value's into areas with breaks. IF YOU SEE WHITE (Short/Lead Length), IT IS A SHORT TERM MOVE AND SCALPING OPPORTUNITY. IF YOU SEE BLUE(Long/Base Length) IT MEANS IT IS A MACRO MOVE, WHICH MAY LAST LONGER
-Cheat Code
BINANCE:BTCUSDT BYBIT:BTCUSDT COINBASE:BTCUSD

LudovicaLudovica is a trend following strategy that works on intraday timeframes (15 minutes).
The stop loss is decided based on the last price movement, take profits are projected through a Fibonacci extension. Two different extensions are calculated, based on a filter that affects the last price movement it is chosen which one to use for take profits.
Money management is fixed fractional: regardless of the distance between entry point and stop loss, the risk on capital for each trade is decided by the user in the strategy inputs. Take profits from 1 to 4 plan to exit with 15% of the initial size, TPs from 5 to 8 plan to exit with 10% of initial size.
There is a trailing stop system to reduce the drawdown of the strategy (note that stop loss moves as the trade develops).
Take profits are limit orders, stops (loss or trailing) occur at candlestick close (set alerts on the strategy).
Optimized strategies selectable from input panel:
-ETHUSDTPERP 15 min
-CRVUSDTPERP 15 min v1
-CRVUSDTPERP 15 min v2
-SNXUSDTPERP 15 min
Other pairs in development and soon available.
This strategy is in beta stage.

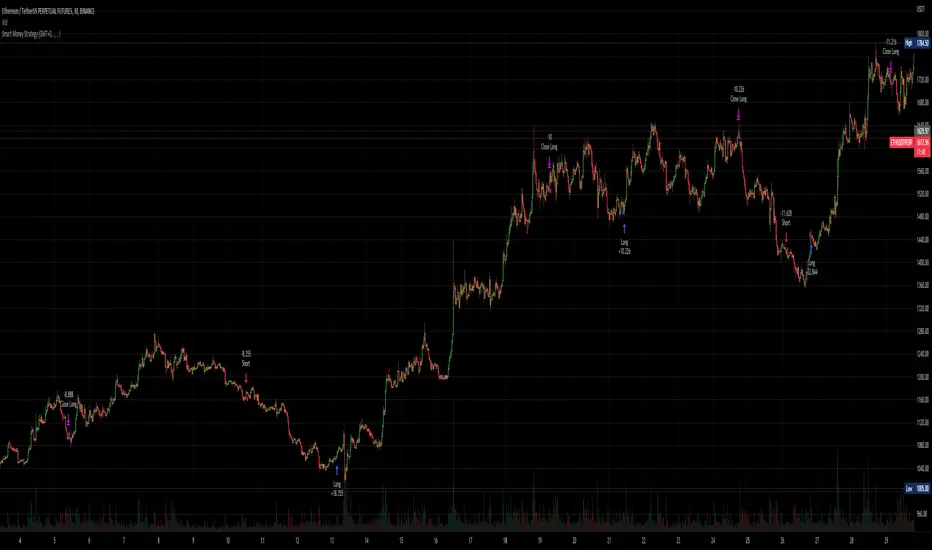
Smart Money - Oscillator and Volume StrategyOverview
This is a no-repaint strategy that is highly optimized for BINANCE:ETHUSDTPERP 30m, normal candles. It is a long/short strategy that is based on CMF, ADX/DMI, Keltner Channels, and other oscillators to identify smart money.
The overall idea of the strategy is to effectively capture the beginnings and ends of trends in price action, and go long/short accordingly. To achieve this, potential entry points are identified with various oscillators and these are then filtered using a variety of moving averages and strength/momentum indicators.
Short and sell inflections are found when ADX, DMI, and/or CMF oscillate below a specified threshold, and Keltner Channels are also used to indicate potential trades.
The indicator will continue to be updated and optimized for current and future market conditions.
If purchased, access to the indicator will be available within 24 hours.
Backtest Results
Parameters:
- 2021-01-01 to present (19 months)
- 100% equity order size
- 0.04% commission fees
- No leverage
17,089% net profit through 296 trades with 60.47% of trades being profitable.
Profit factor of 2.862, Sharpe Ratio of 1.158
Parameters:
- 2021-01-01 to present (19 months)
- $1,000 initial capital
- $1,000 order size
- 0.04% commission fees
- No leverage
584% net profit through 296 trades with 60.47% of trades being profitable.
Parameters:
- 2021-01-01 to present (19 months)
- 500% equity order size
- 0.04% commission fees
- 5x leverage
8,587,557% net profit through 299 trades with 59.87% of trades being profitable.
Inverse MACD + DMI Scalping with Volatility Stop (By Coinrule)This script is focused on shorting during downtrends and utilises two strength based indicators to provide confluence that the start of a short-term downtrend has occurred - catching the opportunity as soon as possible.
This script can work well on coins you are planning to hodl for long-term and works especially well whilst using an automated bot that can execute your trades for you. It allows you to hedge your investment by allocating a % of your coins to trade with, whilst not risking your entire holding. This mitigates unrealised losses from hodling as it provides additional cash from the profits made. You can then choose to hodl this cash, or use it to reinvest when the market reaches attractive buying levels.
Alternatively, you can use this when trading contracts on futures markets where there is no need to already own the underlying asset prior to shorting it.
ENTRY
The trading system uses the Momentum Average Convergence Divergence (MACD) indicator and the Directional Movement Index (DMI) indicator to confirm when the best time is for selling. Combining these two indicators prevents trading during uptrends and reduces the likelihood of getting stuck in a market with low volatility.
The MACD is a trend following momentum indicator and provides identification of short-term trend direction. In this variation it utilises the 12-period as the fast and 26-period as the slow length EMAs, with signal smoothing set at 9.
The DMI indicates what way price is trending and compares prior lows and highs with two lines drawn between each - the positive directional movement line (+DI) and the negative directional movement line (-DI). The trend can be interpreted by comparing the two lines and what line is greater. When the negative DMI is greater than the positive DMI, there are more chances that the asset is trading in a sustained downtrend, and vice versa.
The system will enter trades when two conditions are met:
1) The MACD histogram turns bearish.
2) When the negative DMI is greater than the positive DMI.
EXIT
The strategy comes with a fixed take profit combined with a volatility stop, which acts as a trailing stop to adapt to the trend's strength. Depending on your long-term confidence in the asset, you can edit the fixed take profit to be more conservative or aggressive.
The position is closed when:
Take-Profit Exit: +8% price decrease from entry price.
OR
Stop-Loss Exit: Price crosses above the volatility stop.
In general, this approach suits medium to long term strategies. The backtesting for this strategy begins on 1 April 2022 to 18 July 2022 in order to demonstrate its results in a bear market. Back testing it further from the beginning of 2022 onwards further also produces good returns.
Pairs that produce very strong results include SOLUSDT on the 45m timeframe, MATICUSDT on the 2h timeframe, and AVAUSDT on the 1h timeframe. Generally, the back testing suggests that it works best on the 45m/1h timeframe across most pairs.
A trading fee of 0.1% is also taken into account and is aligned to the base fee applied on Binance.

Bot MasterSqueeze 1.1 (crypt)Countertrend strategy for correction to the average value. The strategy is designed primarily for crypto.
The principle of operation is that with a rapid price change, the strategy tends to take a reverse position to return to the average value, which statistically often happens. It is enough for you to determine the percentage of the offset about the average price and the size of the averaging position as a percentage of the deposit.
With the settings, you determine how to determine the average opening price. It can be MA at the price of opening, closing, etc., and DCMA. Soon I will add a few more options for determining the average opening price
You can also choose the average price at which the transaction will try to close.
Now there are 3 methods:
- closing when returning to the average price
- closing on the first correction candle
- opening on an abnormally large candle in the direction of correction and closing on the first one is opposite
Search for the settings by the selection method for each pair separately. It is better to trade using signals via a bot.
The strategy shows itself best on volatile coins paired with the dollar for 1 hour or more.
Soon I will add new options for opening and closing deals, as well as determining the average price.
ATTENTION: the strategy involves averaging, so be careful with levers and overestimating the percentage of the transaction from the deposit. It is best to allocate no more than 25 percent to the risk of the transaction.

Short Swing Bearish MACD Cross (By Coinrule)This strategy is oriented towards shorting during downside moves, whilst ensuring the asset is trading in a higher timeframe downtrend, and exiting after further downside.
This script can work well on coins you are planning to hodl for long-term and works especially well whilst using an automated bot that can execute your trades for you. It allows you to hedge your investment by allocating a % of your coins to trade with, whilst not risking your entire holding. This mitigates unrealised losses from hodling as it provides additional cash from the profits made. You can then choose to hodl this cash, or use it to reinvest when the market reaches attractive buying levels. Alternatively, you can use this when trading contracts on futures markets where there is no need to already own the underlying asset prior to shorting it.
ENTRY
This script utilises the MACD indicator accompanied by the Exponential Moving Average (EMA) 450 to enter trades. The MACD is a trend following momentum indicator and provides identification of short-term trend direction. In this variation it utilises the 11-period as the fast and 26-period as the slow length EMAs, with signal smoothing set at 9.
The EMA 450 is used as additional confirmation to prevent the script from shorting when price is above this long-term moving average. Once price is above the EMA 450 the script will not open any shorts - preventing the rule from attempting to short uptrends. Due to this, this strategy is ideal for setting and forgetting.
The script will enter trades based on two conditions:
1) When the MACD signals a bearish cross. This occurs when the EMA 11 crosses below the EMA 26 within the MACD signalling the start of a potential downtrend.
2) Price has closed below the EMA 450. Price closing below this long-term EMA signals that the asset is in a sustained downtrend. Price breaking above this could indicate a bullish strength in which shorting would not be profitable.
EXIT
This script utilises a set take-profit and stop-loss from the entry of the trade. The take profit is set at 8% and the stop loss of 4%, providing a risk reward ratio of 2. This indicates the script will be profitable if it has a win ratio greater than 33%.
Take-Profit Exit: -8% price decrease from entry price.
OR
Stop-Loss Exit: +4% price increase from entry price.
Based on backtesting results across a selection of assets, the 45-minute and 1-hour timeframes are the best for this strategy.
The strategy assumes each order is using 30% of the available coins to make the results more realistic and to simulate you only ran this strategy on 30% of your holdings. A trading fee of 0.1% is also taken into account and is aligned to the base fee applied on Binance.
The backtesting data was recorded from December 1st 2021, just as the market was beginning its downtrend. We therefore recommend analysing the market conditions prior to utilising this strategy as it operates best on weak coins during downtrends and bearish conditions, however the EMA 450 condition should mitigate entries during bullish market conditions.

Road To DubaiROAD TO DUBAI
Useful for daily trading over all type of asset, from Stock to Crypto, Forex and Commodities. It works best with 5min to 1hr graphs, if you are a intraday trader.
This is not a simple mashup of indicators, because you can add them as your own.
This script is more like a tool to understand price action based on indicators position . Thanks to cross call based on MACD , RSI with EMA applied and few index realtime mapping, this tool will let you reduce time effort for graph analysis .
As extra feature it will let you to try different strategies , all fully customizable.
I've tried my best to keep it readble, and easy to use. The best way to learn to use it, is to disable all features from configuration and try one by one.
CONFIGURATION TIPS : Click "Settings Gear" in the Upper Right Corner and disable "Indicator Arguments"
HOW TO PROPER SETUP
Road to Dubai 3 is semiautomatic on finding best Long and Short areas, and plot on the chart.
From configuration menu you can set a Backtrace period and sensibility for RSI EMA10, RSI EMA80 and MACD on your Timeframe, 5min, 30min, 60min.
Usually when configured, those parameters works fine on almost every asset.
You only need to start understanding signals.
STANDARD FEATURES
VWAP : Green/Red line. It will reset everyday at 00.00.
EMA80 : White Line
BLUELINES : Positive and negative overextend value from VWap . This is based on a range of bar and it will extend on the opposite side the lower or higher candle. Useful for understading where price can arrive, expecially if a spike will appear.
Those indicators are quite useful for understading trends, price positions and maximum price range.
RSI EMA10 OVERBOUGHT / OVERSOLD
Yellow arrow marks where RSI arrived at his Top or Bottom. If on different timeframes (5min, 30min and 60min) something similar happen area is filled with Red or Green.
This is base on EMA10 applied to RSI (I usually refer at it as Yellow Line on my indicator HighFreq Trader)
To find good values please try High Freq Trader 1.3
RSI EMA80 CALL
Red Cross or Green Square advice for a really potential inversion of trend. When a Silver bar appear, this means the same call was triggered on different Timeframe in the sametime.
This is based on EMA80 applied to RSI (I usually refer at it as Blue Line on my indicator HighFreq Trader).
To find good values please try High Freq Trader 1.3
MACD CALL
Based on MACD with standard settings. When triggered, a lime Triangle appears. Differents size based on timeframe (5min smaller, 60min bigger). If the same call is triggered on the same place a Lime Bar appear on the opposite side of trend (this is a graphical contents, bacause with all enabled, standard use, can be difficult to read signals).
In Menu Settings you will be able to set your best parameter for your asset.
MACD FIBONACCI EXTRA FEATURE
If you want you can enable a Fibonacci draw based on MACD . This works at his best (on my opinion) with 30min MACD
EXAMPLE
NATURAL GAS
In this chart 30min you can see all calls triggered for a Short. Yellow RSI Arrow, Red Cross, Macd Triangle and Colored Red, Lime and Silver Bars are all calling for Short.
In this way you can see in notime if this can be a perfect moment for take position
VIX VXN DXY CALLS
If VIX , VXN is triggered a small Green Dot will appear. If both are in the same time a bigger Dot appear. Very useful to find trend inversion.
If DXY is triggered a Red Dot will appear (only on Daily Chart ). Very Useful to understand trend inversion on whole market.
VOLUMES REMINDERS
Find if there was an High Volume traded (HV) or Low Volume Traded (LV) in the near past. Useful to understand if some tricky situation could happen (like a sudden sell, an accumulation or distribution)

Cipher B divergencies for Crypto (Finandy support)Hello Traders!
In times of high volatility, it is important to follow a market-neutral strategy to protect your hard-earned assets. The simple script employs common buy/sell and/or divergencies signals from the VuManChu Cipher B indicator with fixed stop losses and takes profits. The signals are filtered by a local trend of a coin of interest and the global trend of Bitcoin. These trends-filtered signals demonstrated better performance on most of the back- and forward- tests for USDT cryptocurrency futures. The strategy is based on my real experience, it's a diamond I want to share with you.
In terms of visualization if the background is red and the price is below the yellow line then only a short position can be opened. Conversely, if the price is above the yellow line AND the background is green only a long position can be opened.
Inputs from VuManChu you can find on the top. Frankly, I do not know how they can help you to improve the performance of the strategy. My inputs of the script you can find in "Trend Settings" and "TP/SL Settings" at the bottom.
The checkbox "Only divergencies" lets to broadcast only more reliable buy/sell signals for a cost of rare deals.
The checkbox "Cancel all positions if price crosses local sma?" makes additional trailing stop loss. Usually, this function increases the win rate by "smoothing" the risk/reward ratio, as a usual stop loss does.
You can tune SL/TP based on backtesting.
To connect the script to Finandy just edit "name" and "secret" to connect your webhook (see the bottom of the script).
The rule of thumb for the strategy is "only divergencies" - ON, high reward/risk (TP/SL) ratio, 5 min timeframe on chart help with performance.
Finally, I am looking forward to feedback from you. If you have some cool features for my script in your mind, do not hesitate to leave them in the comments.
Good luck!
