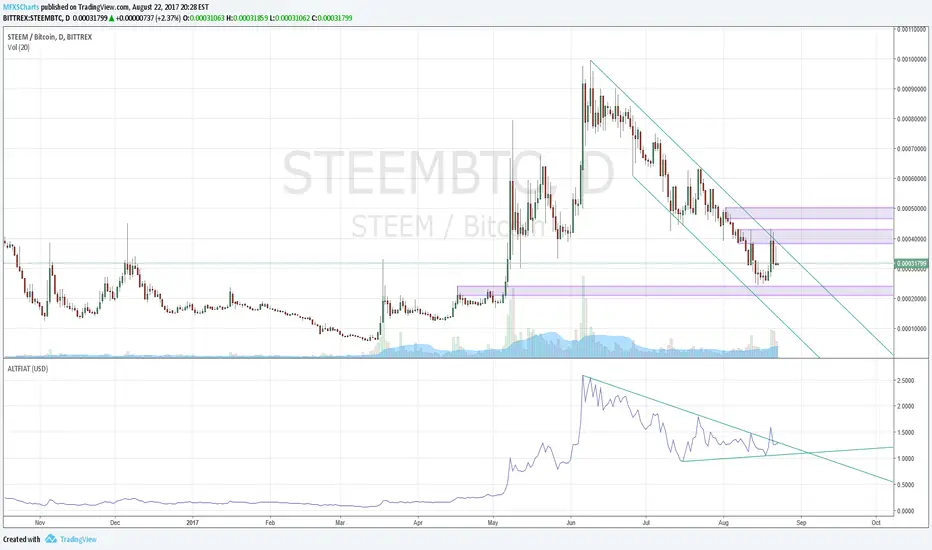
ALTFIATHandy indicator that shows you historical price of alt-coins in user-defined currency. Default is USD. Change input setting 'Currency' to relevant USD pair to get alt-price in desired currency ie to see historical price data in Australian dollars, you would enter 'AUDUSD'; to see price data in Euros or Yen, you would enter "EURUSD" or "USDJPY".
Currencies supported:
All xxxUSD pairs + CHF, CAD, JPY and CNH
Issues:
User has to input full currency pair ie AUDUSD - User should just be able to enter AUD. My string + string fix for this breaks default USD setting.
Support for USDxxx pairs currently hardcoded
Solutions to the above welcome and encouraged.
Mata Wang Kripto
Volume Conversion IndicatorVolume Conversion Indicator
The volume conversion indicator is much like the in-built volume indicator. This particular volume indicator allows you to find out how much of something has been traded in a given timeframe.
This is done by multiplying volume by the average price at that point.
What does this mean?
Well, say, for example, you were watching DGB/BTC (DigiByte/Bitcoin). Instead of the volume being displayed in the amount of DGB traded, the amount of BTC traded is displayed instead.
Feel free to comment... Hope this helps :D

Magic Moving Averages!Magic Moving Averages! is an indicator that comes standard in many forex trading platforms, and now on Tradingview designed for comfortable readability! It incorporates a series of simple moving averages plotted together with increasing periods. Finding a good trade with this is easily found with a set of rules. I took a course with Alex du Plooy on these rules and am using his suggested default values, however there are many more teachers of this method that have various rules that may be similar. If you desire a greater MA spread simply increase the MA Separation value in the input. Best for 15 mins or longer charts.
Happy trading
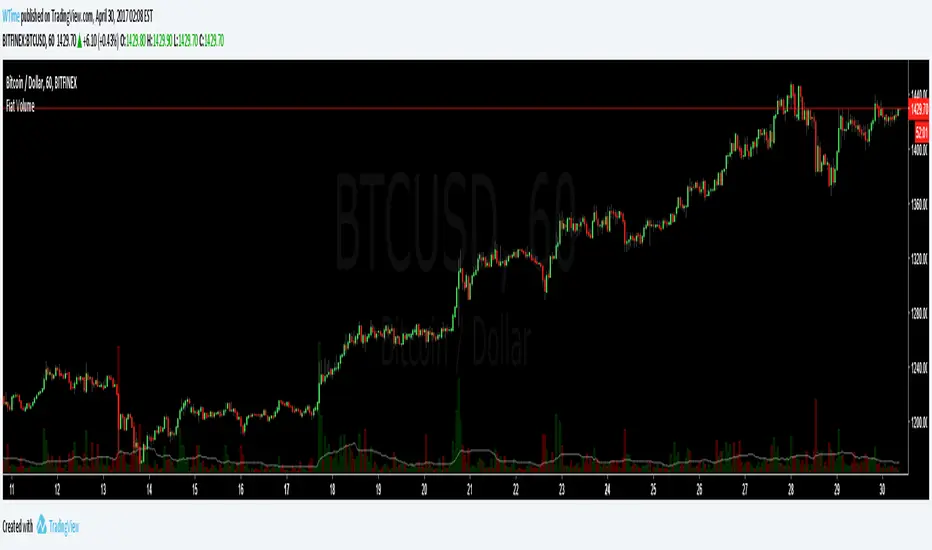
Fiat Denominated VolumeUseful for cryptocurrencies, where price swings often makes crypto denominated volume meaningless.