Multi-Exchange Volume (30 Tickers) by kurtsmock + BV + rVolauthor: kurtsmock
Fully Customizable ticker set. Up to 30 Tickers. Bitcoin set as default.
-- IMPORTANT NOTE: --
30 Exchanges are a lot. It can take a while to load. You can fully customize this indicator to your liking. Here's how:
1. Load indicator
2. Open Settings
3. Uncheck the switch box for exchanges you want unincluded
4. At the bottom of the settings menu click "Defaults" and hit "Save as Default"
5. To turn them all back on, hit "Reset Settings" in that same "Defaults" menu and click "Save as Default" again.
Also, you don't have to use this with Bitcoin. This works with any asset, just change the ticker in the settings.
There's a lot going on with this indicator so the following is descriptions and instructions to help you better understand what's going on here. Thanks!
Goal:
- To provide a mechanism for assets on multiple exchanges to have their volume evaluated together
Edge:
- Having better and more complete volume information
Notes:
- The Default Exchanges for this indicator are highest volume bitcoin exchanges, but may contain "fake volume"
- Indicator is set for Bitcoin by default. However, you can change the tickers to reflect any asset you want
////// rVol //////
Goal:
- To understand how much volume is being executed relative to the same candle on previous days/periods
Edge:
- Higher rVol implies higher volatility and market interest.
- High rVol = higher than average volume . Markets move on volume so higher than average volume indicates increased market activity/volatility
- rVol is an indirect measure of active or anticipated volatility
Definitions:
- rVol: The volume of a period compared to the Average Volume of that same period in past sessions
- Important to note it does NOT add up the last 10 (default) candles, but rather the last 10 candles at session intervals.
- Example:
-- On a Tuesday, 1h chart it will add up the last ten Tuesday, 9:00 am candles, not including the current, active candle.
-- It then averages those lookback candles.
-- It then plots the percentage relationship between the most recent candle and the average of the lookback candles
-- Avg Vol of Lookback candles = 5000,
-- Volume of most recent candle = 4000: Output = rVol = 80:
-- Volume of most recent candle was 80% of the average volume in the 9 am time period of the last ten Tuesdays in the 9 am, 1h period
Notes:
- rVol does not add current candle volume into lookback sum. So, you set lookback to be: (not including the current day)
- rVol is on a switch. So, if you want to see rVol instead of volume, hit the switch in the settings
- If you want to see both, load 2 instances of the indicator.
////// Better-er Volume //////
Goal:
To Identify:
- When a candle closes at the highest volume * range relative to the lookback period and close > open
- When a candle closes at the highest volume * range relative to the lookback period and close < open
- When a candle closes at the highest volume / price relative to the lookback period
Edge:
- Identifies beginnings of price expansion, climax of price expansion, breakouts, pivots, and take profit points on the volume chart
Notes:
- Based generally on Barry Taylor's "Better Volume" indicator and ideas from Pascal Willain's book "Value in Time."
- Better-er Volume rules are applied to both Total Volume or rVol.
-- When rVol is displayed Better-er Volume is applied to rVol
-- When Total Volume is displayed Better-er Volume is applied to Total Volume
// Plot Key: //
Green Triangle Up = Often marks the beginning and/or end of price expansion to the upside
Red Triangle Up = Often marks the beginning and/or end of price expansion to the downside
Yellow Square = High Volume but Tight Range. Implies a Battle of Bulls and Bears. High Liquidity area. Provided Liquidity is not enough to move price. Thick Limit Order Book.
Purple Triangle Up or Down = Implies high market participation. Typically at the end of expansion when very significant s/r is hit
category: volume Volatility
tags: Volume rVol relativevolume Bitcoin cryptocurrency bettervolume
Many More Volume Indicators Coming Out Soon!
Mata Wang Kripto

ANN MACD : 25 IN 1 SCRIPTIn this script, I tried to fit deep learning series to 1 command system up to the maximum point.
After selecting the ticker, select the instrument from the menu and the system will automatically turn on the appropriate ann system.
Listed instruments with alternative tickers and error rates:
WTI : West Texas Intermediate (WTICOUSD , USOIL , CL1! ) Average error : 0.007593
BRENT : Brent Crude Oil (BCOUSD , UKOIL , BB1! ) Average error : 0.006591
GOLD : XAUUSD , GOLD , GC1! Average error : 0.012767
SP500 : S&P 500 Index (SPX500USD , SP1!) Average error : 0.011650
EURUSD : Eurodollar (EURUSD , 6E1! , FCEU1!) Average error : 0.005500
ETHUSD : Ethereum (ETHUSD , ETHUSDT ) Average error : 0.009378
BTCUSD : Bitcoin (BTCUSD , BTCUSDT , XBTUSD , BTC1!) Average error : 0.01050
GBPUSD : British Pound (GBPUSD,6B1! , GBP1!) Average error : 0.009999
USDJPY : US Dollar / Japanese Yen (USDJPY , FCUY1!) Average error : 0.009198
USDCHF : US Dollar / Swiss Franc (USDCHF , FCUF1! ) Average error : 0.009999
USDCAD : Us Dollar / Canadian Dollar (USDCAD) Average error : 0.012162
SOYBNUSD : Soybean (SOYBNUSD , ZS1!) Average error : 0.010000
CORNUSD : Corn (ZC1! ) Average error : 0.007574
NATGASUSD : Natural Gas (NATGASUSD , NG1!) Average error : 0.010000
SUGARUSD : Sugar (SUGARUSD , SB1! ) Average error : 0.011081
WHEATUSD : Wheat (WHEATUSD , ZW1!) Average error : 0.009980
XPTUSD : Platinum (XPTUSD , PL1! ) Average error : 0.009964
XU030 : Borsa Istanbul 30 Futures ( XU030 , XU030D1! ) Average error : 0.010727
VIX : S & P 500 Volatility Index (VX1! , VIX ) Average error : 0.009999
YM : E - Mini Dow Futures (YM1! ) Average error : 0.010819
ES : S&P 500 E-Mini Futures (ES1! ) Average error : 0.010709
GAZP : Gazprom Futures (GAZP , GZ1! ) Average error : 0.008442
SSE : Shangai Stock Exchange Composite (Index ) ( 000001 ) Average error : 0.011287
XRPUSD : Ripple (XRPUSD , XRPUSDT ) Average error : 0.009803
Note 1 : Australian Dollar (AUDUSD , AUD1! , FCAU1! ) : Instrument has been removed because it has an average error rate of over 0.13.
The average error rate is 0.1850.
I didn't delete it from the menu just because there was so much request,
You can use.
Note 2 : Friends have too many requests, it took me a week in total and 1 other script that I'll share in 2 days.
Reaching these error rates is a very difficult task, and when I keep at a low learning rate, they are trained for a very long time.
If I don't see the error rate at an average low, I increase the layers and go back into a longer process.
It takes me 45 minutes per instrument to command artificial neural networks, so I'll release one more open source, and then we'll be laying 70-80 percent of the world trade volume with artificial neural networks.
Note 3 :
I would like to thank wroclai for helping me with this script.
This script is subject to MIT License on behalf of both of us.
You can review my original idea scripts from my Github page.
You can use it free but if you are going to modify it, just quote this script .
I hope it will help everyone, after 1-2 days I will share another ann script that I think is of the same importance as this, stay tuned.
Regards , Noldo .

Volume ComparisonThis script shows the volume of the current chart relative to the volume of another selected ticker.
For meaningful information you should compare coins with the same base pair (for example BTCUSD against LTCUSD).
Volume bars will be plotted green if the other security's volume is higher, red otherwise.
You may use this script go generate alerts and automate your trading with a bot such as WolfBot.org

BTC Volume absolute (fiat vs Tether vs futures)BTC volume split by fiat, Tether and futures in USD
fiat = COINBASE + BITFLYER + BITSTAMP + KRAKEN
Tether = BITFINEX + BINANCE + HUOBI + HITBTC
futures = BITMEX + BYBIT

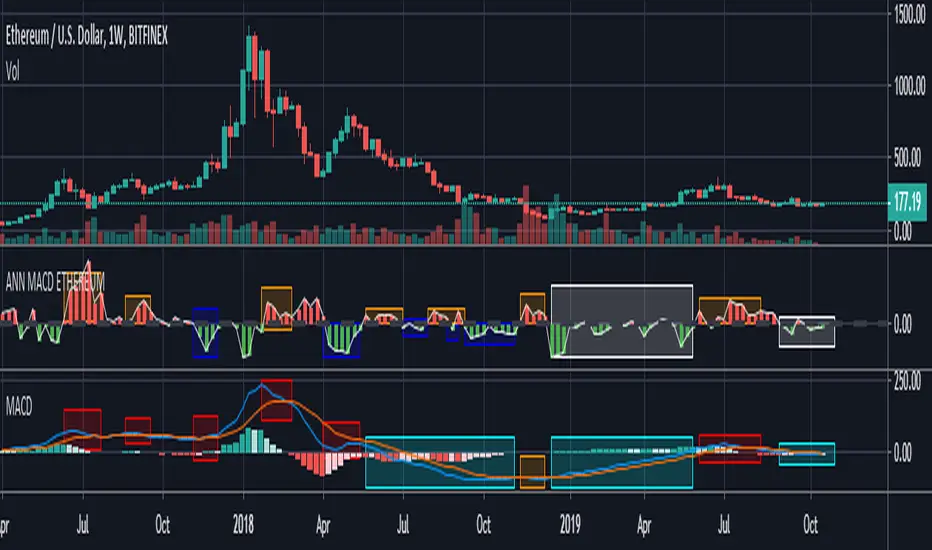
ANN MACD ETHEREUM
This script is trained with Ethereum (Timeframe : 4 hours ).
Details :
Input columns: 19
Output columns: 1
Excluded columns: 0
Training example rows: 300
Validating example rows: 0
Querying example rows: 0
Excluded example rows: 0
Duplicated example rows: 0
Input nodes connected: 19
Hidden layer 1 nodes: 8
Hidden layer 2 nodes: 1
Hidden layer 3 nodes: 0
Output nodes: 1
Learning rate: 0.7000
Momentum: 0.8000
Training error: 0.009378 ( That's a very good error coefficient. )
Many thanks to wroclai for help.
Deep learning series will continue!
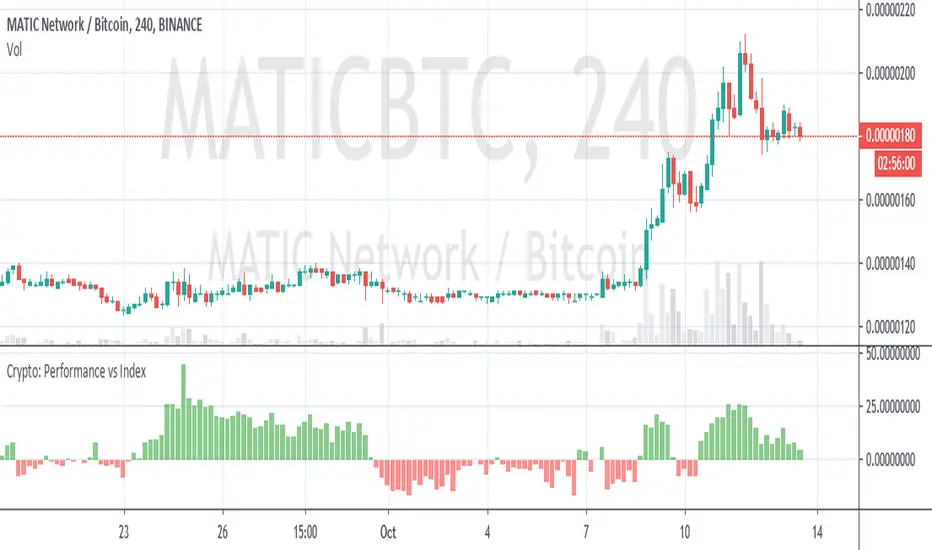
Crypto Performance vs IndexQuickly shows you if an altcoin is outperforming or underperforming it's peers. You can compare again indexes of high cap, mid cap and low cap indexes, which are provided by FTX.com. I intend to add some more features but am currently a bit busy so wanted to get it published as I've been finding it useful
InfoPanel - SeasonalityThis panel will show which is the best month to buy a stock, index or ETF or even a cryptocurrency in the past 5 years.
Script to use only with MONTHLY timeframe.
Thanks to: RicardoSantos for his hard work.
Please use comment section for any feedback.

InfoPanel Divergence IndicatorThis panel spots divergences of some well knonw indicators. It may be usefull because you have all indicators in one panel only.
Also, you can check on chart which indicator gives better results of each pair on stock or index or crypto.
TO DO: to add custom indicators.
thanks to: RicardoSantos for his script of panel coding
Tradingview scripts
Other members of TV community (I cannot remember the source and inspiration of all snipets)
Please use comment section for any feedback.

InfoPanel Indicators microtrendThis panel shows current value and trend of some well knonw indicators. It may be usefull because you have all indicators in one panel only.
thanks to: RicardoSantos for his script of panel coding
Tradingview scripts
Please use comment section for any feedback.

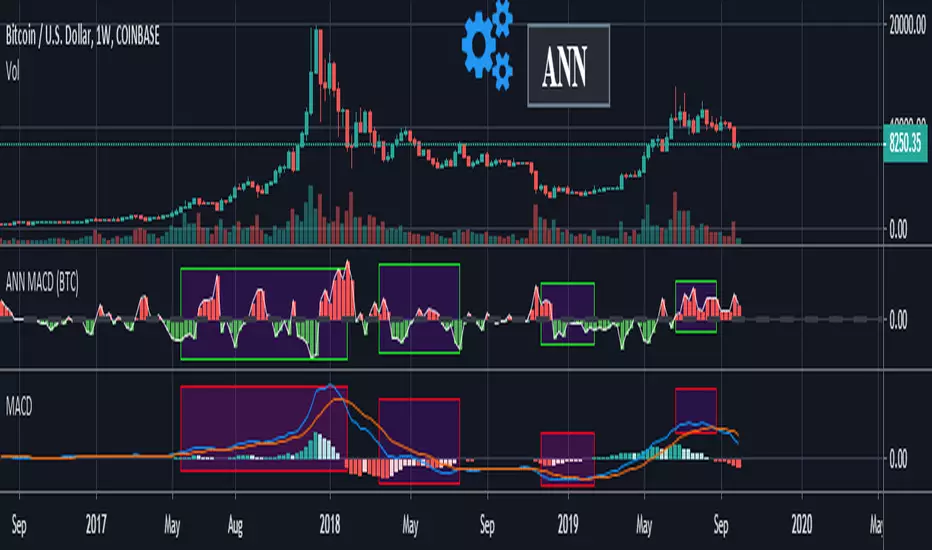
ANN MACD (BTC)
Logic is correct.
But I prefer to say experimental because the sample set is narrow. (300 columns)
Let's start:
6 inputs : Volume Change , Bollinger Low Band chg. , Bollinger Mid Band chg., Bollinger Up Band chg. , RSI change , MACD histogram change.
1 output : Future bar change (Historical)
Training timeframe : 15 mins (Analysis TF > 4 hours (My opinion))
Learning cycles : 337
Training error: 0.009999
Input columns: 6
Output columns: 1
Excluded columns: 0
Grid
Training example rows: 301
Validating example rows: 0
Querying example rows: 0
Excluded example rows: 0
Duplicated example rows: 0
Network
Input nodes connected: 6
Hidden layer 1 nodes: 8
Hidden layer 2 nodes: 0
Hidden layer 3 nodes: 0
Output nodes: 1
Learning rate : 0.6 Momentum : 0.8
More info :
EDIT : This code is open source under the MIT License. If you have any improvements or corrections to suggest, please send me a pull request via the github repository github.com
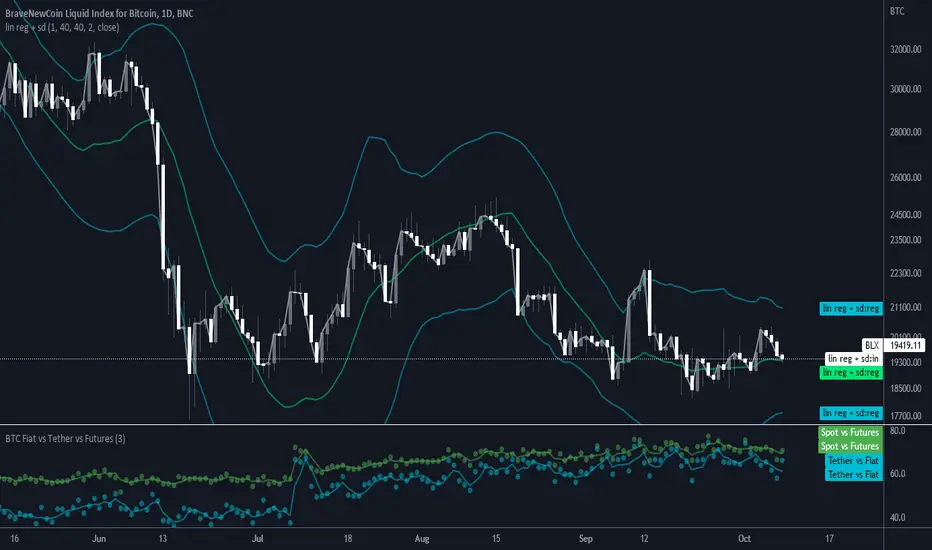
BTC Volume Fiat vs Tether vs FuturesFutures = BYBIT+ BITMEX
Fiat = KRAKEN + BITSTAMP + BITFLYER + COINBASE
Tether = HITBTC + HUOBI + BINANCE + BITFINEX
Spot = Fiat + Tether
Tether vs Fiat = 100 * Tether / (Tether + Fiat)
Spot vs Futures = 100 * Spot / (Spot + Futures)
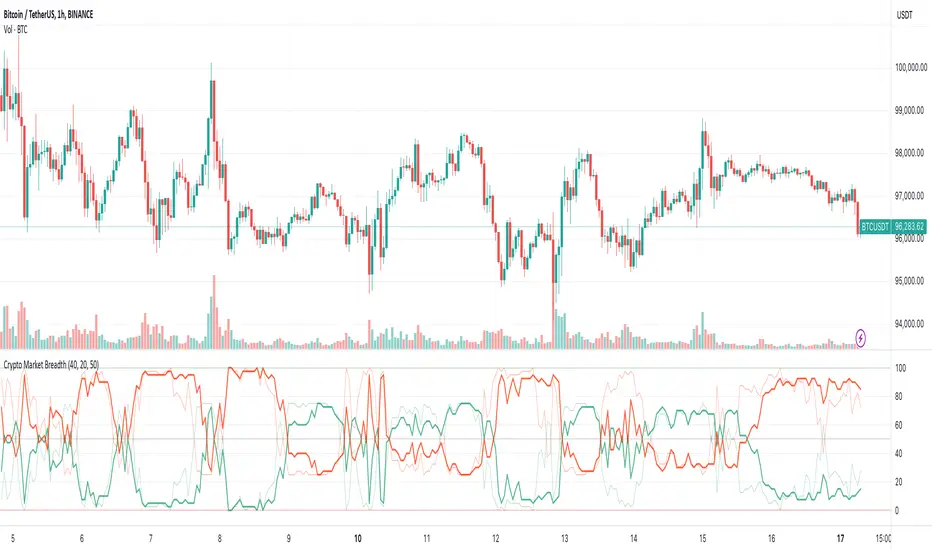
Crypto Market BreadthThis is the "Crypto Market Breadth" indicator from
I updated it to latest symbol so that it resolves again:
removed: BINANCE:NPXSUSD
added: BITFINEX:LEOUSD
Also helpful for automatic trading with WolfBot.org and TradingView Integration
Lancelot ATR Volume MeterThis is an experiment I did a while back ago.
I often think On Balance Volume is a great indicator as trend direction and volume cannot lie.
However, I bumped into a few problems.
It is slow, doesn't show volatility and often time it is prone to chop.
That's why I added ATR to the equation.
Original OBV calculation
src > 0? : +volume : src < 0? -volume
Modified OBV with ATR
src > 0 ? +volume * (volume / atr) : src < 0? -volume * (volume / atr)
I have used 2 ema for this modified OBV.
ema 3
ema 18
By adding ATR to the equation we can smooth out many erratic price movement. (Stop hunting)
Also, when price move slowly but steady, often prepping for a big move, this indicator will move faster.
In short, this indicator prevents you from being stop hunted and also provide great entry for a trending market.
Works well on BTCUSD XBTUSD, as well as other major liquid Pair.
Feel free to follow me on Twitter @Lancelot_Auger for more free Alpha.
Please acknowledge my effort by like and follow.
And lastly,
Save Hong Kong, the revolution of our times.

Lancelot Band - ATR Reversal+Trending IndicatorThis is an indicator I created recently, with the mind of spotting where price might reverse and where the price is trending. You can see this as the primary indicator for your system, however, it is recommended you use this in conjunction with other confirmation indicators.
This script focus solely on ATR or Average True Range.
This indicator is the combination of the baseline from the Ichimoku cloud and the concept of the Keltner channel.
Baseline period = 14
ATR period = 14
ATR Mult = 1.5
For reversal
Long when price crossover Lower band & Stop loss at xLower band
Sell when price crossunder Upper band & Stop loss at xUpper band
For Trend Following
Long when price crossover xUpper band and Stop loss at Upper band
Short when price crossunder xLower band and Stop loss at Upper band
Again, you will need other indicators to help you to succeed in this system. This indicator will not generate the best exit for your position but will generate a good entry signal when you use it with both volume indicator and exit indicator.
Works well on BTCUSD XBTUSD, as well as other major liquid Pair.
Feel free to follow me on Twitter @Lancelot_Auger for more free Alpha.
Please acknowledge my effort by like and follow.
And lastly,
Save Hong Kong, the revolution of our times.

Alert-QuarryLake Indicator Map - ATR Trend Following Strategy A lot of times I don't like my chart crowding with indicators, thus the reason for creating this script for my strategy QuarryLake.
This script also comes with alert.
Below is the explanation for QuarryLake
I have also updated the script in version 4.
This strategy consists of 3 indicators that I found works quite well together.
Keltner Channel, Waddah Attah Explosion, and Volatility Stop.
You can find WAE here
KC Period = 200
KCATR = 5
Vstop Period = 3
Vstop Mult = 1.5
Long when close > KC, close > Vstop, WAE trendUp
Short when close < KC, close < Vstop, WAE trendDown
Works well on BTCUSD XBTUSD, as well as other major liquid Pair.
Feel free to follow me on Twitter @Lancelot_Auger for more free Alpha.
Please acknowledge my effort by like and follow.
And lastly,
Save Hong Kong, the revolution of our times.

Trend Confirmation Indicator - Triple OBVDear all, you might wonder is there a confirmation indicator that has a high hit rate, is dependable, and could rely on the information it gives you when making a decision?
Here I present an indicator I developed specifically for cryptocurrency, in the minds of eliminating fakeouts and traps.
Trend is always invalid then there is a lack of volume, so by tracking the momentum of price direction & volume, we can have a ballpark about where the market is moving to.
On balance volume
obvshort = ema3
obvmedium = ema9
obvlong = ema26
This is a lagging indicator, which means it's not good at predicting reversal.
This is also the reason why
long signal = obvshort > obvmedium and obvshort > obvlong
shortsignal = obvshort < obvmedium and obvshort < obvlong
both without obvmedium >< obvlong
This indicator will not lie to you.
At last
Save Hong Kong, the revolution of our time.

CloudRest ATR based cloudThis is an indicator I have been working on for the past 2 years, developed specifically for cryptocurrency.
It is primarily a trend following indicator with great success and it performs the best in 4hrs to the weekly chart.
There are two components of this indicator.
The baseline from Ichimoku cloud and volatility stop .
baseline period = 26
volatility stop = 1.5ATR, 3
You can view this as the main component of a trend following system but you will need other confirmation indicators to confirm your entry.
Feel free to modify the script for your own system.
Feel free to follow me on twitter @Lancelot_Auger
I will be posting more content in the future, stay tuned.
And lastly,
Free hong kong, the revolution of our time!

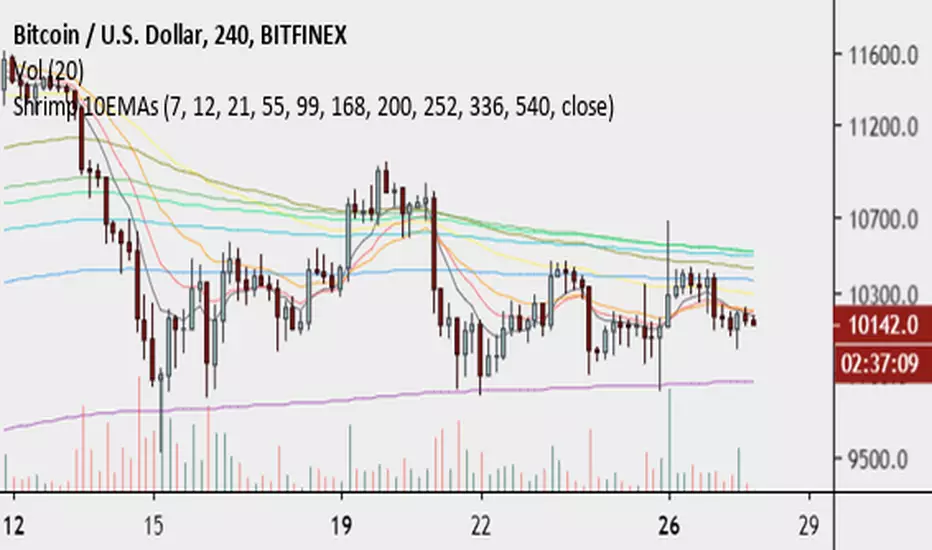
BullShrimp's 10EMAsA simple bundle of EMAs with some odd numbers that I found good confluence on 15min, 1h, 4h, 12h, 1d, 1w on BTC and on ALTS.
Works good for dynamic S/R on LTF and high probability target on MTF and HTF.
Try it out during your scans.
Lemme know what you think.
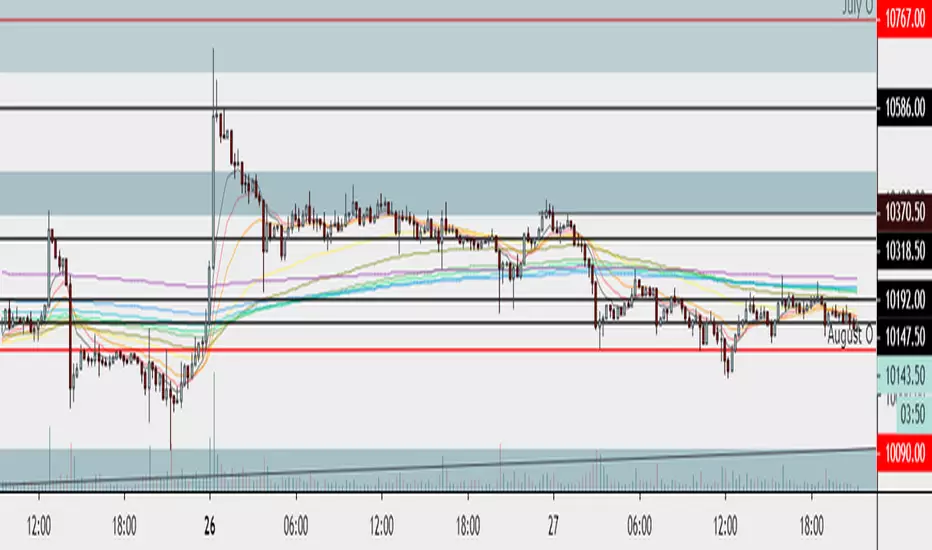
Shrimp 10EMAsA simple bundle of EMAs with some odd numbers that I found good confluence on 15min, 1h, 4h, 12h, 1d, 1w on BTC and on ALTS.
Works good for dynamic S/R on LTF and high probability target on MTF and HTF.
Try it out during your scans.
Lemme know what you think.
Dark Cloud Cover Pattern Trading Setupthis study is another script based on the candlestick pattern . there are a few filters implemented to be applied to the output result to clear out noises. it sounds like finding real Dark Cloud Cover instances are too rare (interesting though!).
Dark Cloud Cover
it is a bearish reversal candlestick pattern where a down candle (typically bearish) opens above the close of the prior up candle (typically bullish) and then closes below the midpoint of the up candle. The five criteria for the Dark Cloud Cover pattern are:
An existing bullish uptrend.
An up (bullish) candle within that uptrend.
A gap up on the following day.
The gap up turns into a down (bearish) candle.
The bearish candle closes below the midpoint of the previous bullish candle.
all these criteria are implemented in code to produce a more accurate result.
please provide me with your valuable comments,
thanks for your attention,

Piercing Line Pattern Trading Setupthis study is the first one of a series of scripts based on the candlesticks pattern which will be published over time. There are several such scripts out there that can be found on TradingView but they seem to be inaccurate with a lot of noises and messy hard to understand code. In this script, I've tried to have a clean and easy to get
of the pattern itself and the method for detecting it with enough parameters to filter out the noises.
Piercing Pattern
A piercing pattern is a technical trading signal that is formed by a closing down day with a good-sized trading range, followed by a trading gap lower the following day with a bullish candlestick that covers at least half of the upward length of the previous day's bearish candlestick body, finishing with a close higher for the day. A piercing pattern often signals the end of a small to moderate downward trend. A piercing pattern can serve as a potential indicator for a bullish reversal. This pattern is formed by two consecutive candlestick marks. The first candlestick is bearish signifying a down day and the second is bullish signifying an up day. When a trader is watching for a bullish reversal any red candlestick followed by a green candlestick could be an alert. There are a few things that set a piercing pattern apart from a general red candlestick green candlestick pattern. In a piercing pattern, a green candlestick follows a red one with a significant gap in the red candlestick close and green candlestick open. On the second-day green candlestick, the candlestick’s body must also lengthen to cover at least half of the previous day’s red candlestick . Generally, the gap down and substantial increase to the closing price are good signs for a reversal. In a piercing pattern, the second-day green candlestick will close at or above the midpoint of the previous day’s red candlestick.
please provide me with your valuable comments,
thanks for your attention,

Coinbase ALT/USD IndexA simple ALT/USD pair index of all the altcoins currently trading on Coinbase.

Tenkan Kijun Cross AlertTenkan Kijun cross alert, best used alongside a Volume indicator to help aid with finding those trend continuation patterns.
I prefer to use the Chaikin Money Flow, when it indicates and holds above the 0 line then you will bias Longs, and when below then you will Bias shorts
If you like this then please donate
BTC: 1LRbUgrkvFLQ5Mt7C62EJRD9aMvhDNT22K
ETH: 0xa509b89bccb788234278eFE63470c10946E26F3c
LTC: LV7MUr6arvCffS5N6pbTWgav5S3Yi1Eejp
